
Bitcoin enters April 2026 under visible pressure as price action struggles to regain upward strength. The market shows hesitation near key resistance, while sellers maintain control in the short term.
Although the broader structure remains intact, recent behavior suggests a fragile balance between consolidation and further downside risk. Consequently, traders now watch critical levels closely as momentum weakens and volatility compresses.
Short-Term Weakness Signals Caution
Bitcoin currently trades near $66,600, but price remains capped below a strong resistance cluster. Moreover, repeated failures near the $68,000 region highlight fading bullish strength.
The asset continues to form lower highs, which reinforces the short-term bearish trend. Additionally, price stays below key moving averages, adding further downside pressure.
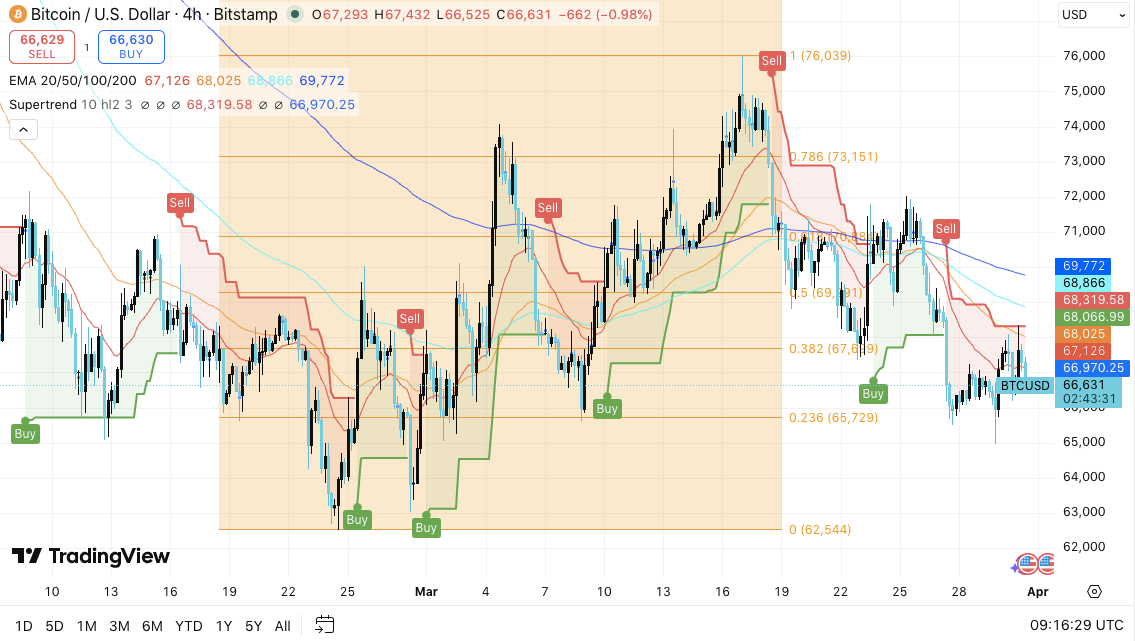
Technical indicators support this cautious outlook. The EMA cluster acts as resistance rather than support, which signals trend exhaustion.
Besides, the Supertrend indicator recently flipped bearish, confirming a shift in momentum. Fibonacci retracement levels also suggest weakness, as price struggles near shallow recovery zones.
Related: $XRP Price Prediction: Can $XRP Break Out In April As Ripple Clears Its Biggest Regulatory Hurdle?
Hence, the market reflects a corrective phase rather than a clear recovery. Traders appear hesitant to commit to strong long positions at current levels. This hesitation aligns with broader uncertainty across risk markets.
Key Levels Define Market Direction
Support zones now play a decisive role in shaping Bitcoin’s next move. The immediate level between $65,700 and $66,000 acts as a crucial defense line. A breakdown below this area could trigger a rapid decline toward $64,000. Furthermore, the $62,500 to $63,000 region remains a major structural support.
On the upside, resistance continues to cap gains. The $67,100 to $67,300 zone blocks short-term rallies.
Additionally, the $68,000 to $68,800 range represents a strong rejection area. A sustained move above $70,000 would change sentiment significantly. However, current conditions do not support that scenario yet.
Market Flows Reflect Selling Pressure
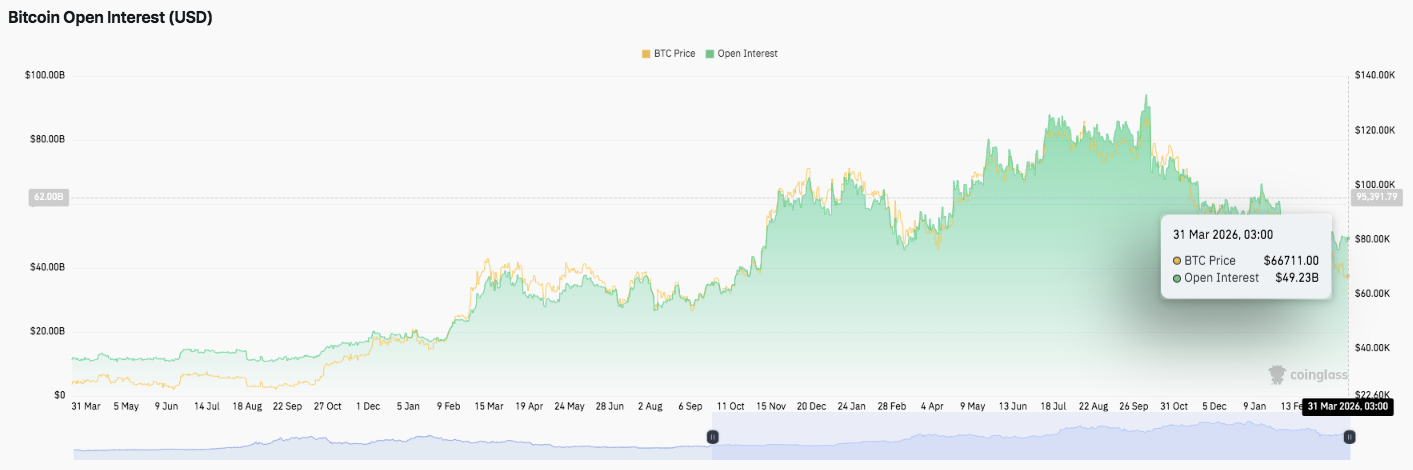
Market data reinforces the bearish tone. Open interest has grown steadily, indicating increased participation and leverage. However, recent declines suggest traders are reducing exposure as price weakens. This shift points to cautious sentiment rather than aggressive positioning.
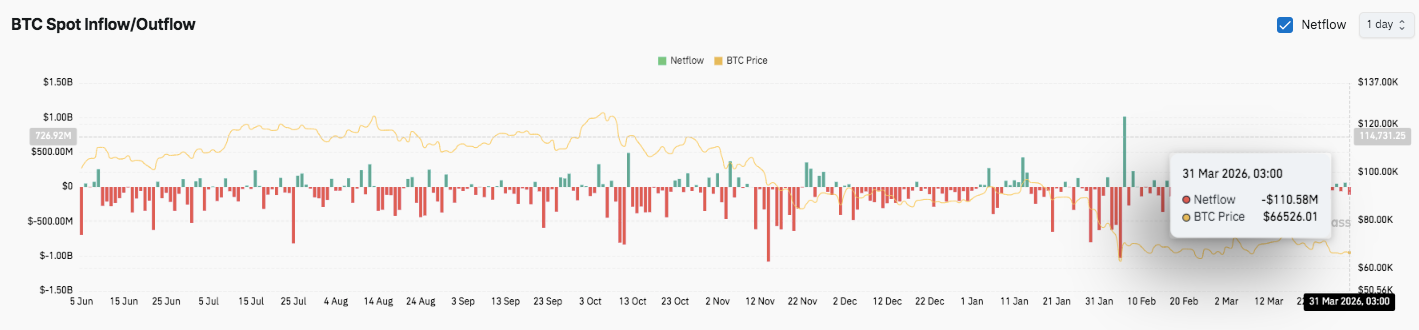
Spot flows also highlight persistent outflows, which signal ongoing selling pressure. Inflows appear briefly but fail to sustain upward momentum. Consequently, sellers maintain control while buyers act opportunistically rather than consistently.
Technical Outlook for Bitcoin (BTC)
Key levels remain clearly defined as Bitcoin moves through a consolidation phase into April 2026. Price continues to hover within a tight structure, where both upside and downside levels offer clear signals for the next directional move.
Upside levels: $67,300 serves as the first immediate hurdle, followed by the $68,000–$68,800 resistance cluster. A sustained breakout above this range could open the path toward $69,700–$70,800. If bullish momentum strengthens further, Bitcoin may attempt a move toward $72,000 and potentially higher levels.
Related: Chainlink (LINK) Price Prediction for April 2026: Will Chainlink Move Higher?
Downside levels: $65,700 remains the key short-term support that buyers must defend. A break below this level could trigger a move toward $64,500–$65,000. Moreover, continued weakness may expose the $62,500–$63,000 zone, which stands as a major structural floor. If bearish pressure intensifies, the $60,000–$62,000 macro support range could come into play.
Resistance ceiling: The $69,700–$70,800 region represents the critical level to reclaim for a medium-term bullish shift. Until price closes above this zone, sellers retain control of the broader trend.
The technical structure shows Bitcoin trading within a horizontal range, rather than a clear trend. Additionally, price remains below key moving averages, which reinforces short-term bearish pressure. However, flattening indicators suggest the market is compressing, often a precursor to a larger breakout.
Will Bitcoin Move Higher?
Bitcoin’s next move depends heavily on how price reacts around the $65,700 support zone. If buyers defend this level and build momentum, a retest of the $68,000–$70,000 region becomes likely. Moreover, stronger inflows and renewed confidence could push price toward $72,000 and beyond.
However, failure to hold support would shift the narrative quickly. A breakdown below $65,700 increases the probability of a move toward $64,000 and possibly $62,500. This scenario aligns with current market signals, where selling pressure remains dominant.
For now, Bitcoin sits in a decisive range. Market participants continue to watch for confirmation, as both technical compression and shifting sentiment point toward an upcoming volatility expansion.
Related: Chiliz (CHZ) Price Prediction: Can Bulls Sustain the $0.045 Push?