cryptopotato.com

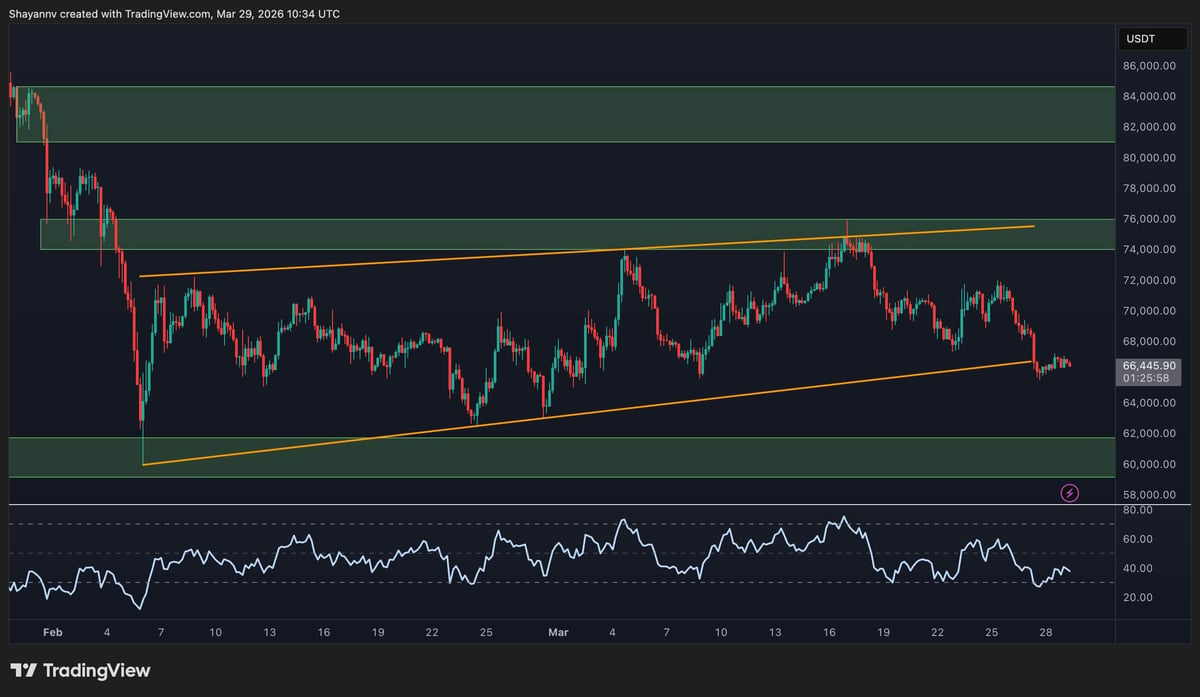
Bitcoin ($BTC) continues in a broad consolidation phase following the steep declines earlier this year. The asset remains confined in a horizontal range that signals short-term indecision among market participants. While attempts to retest higher resistance levels around $75k have been met with selling pressure, $BTC’s support near $60k has so far held, defining the lower boundary of the current range.
Bitcoin Price Analysis: The Daily Chart
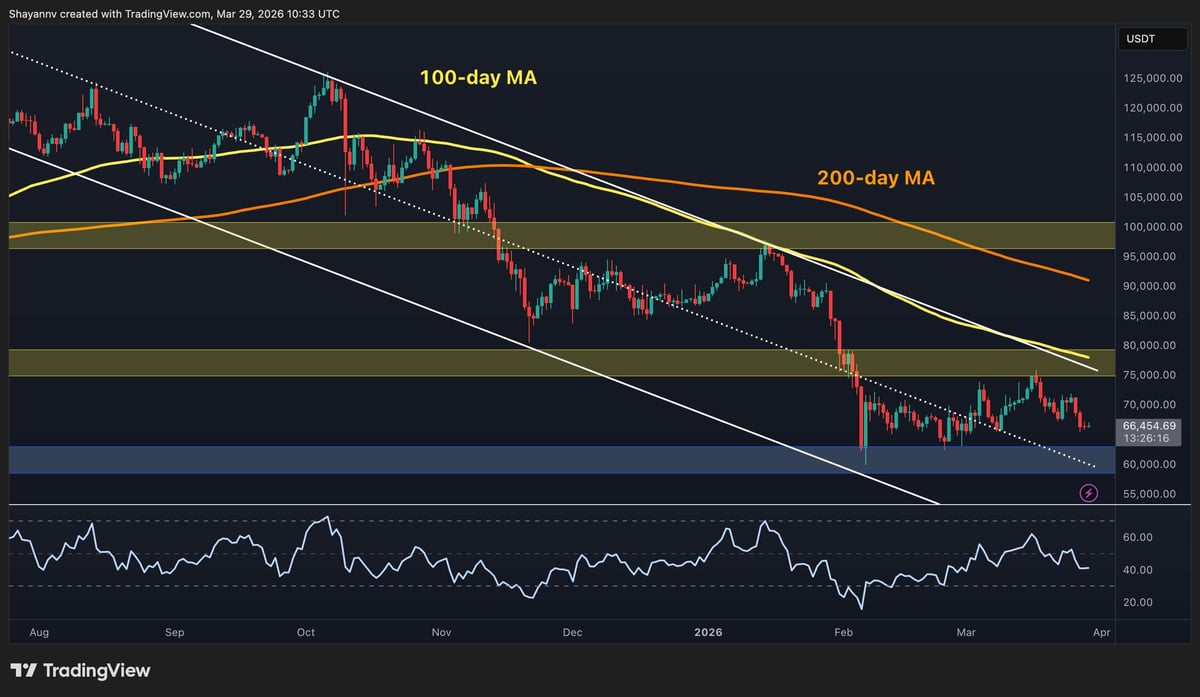
On the daily timeframe, $BTC shows clear lower highs and lows following the peak above $125k. The trend remains bearish in the broader context, as the 100-day (~$78k) and 200-day moving averages (~$90k) are both trending downward above current prices, adding overhead resistance.
The recent bounce toward the $75k supply zone has been rejected, and the asset even failed to reach the higher boundary of the large descending channel and the 100-day moving average nearby. This indicates that sellers remain active at higher levels and consistently sell into short-term rallies. The RSI also shows moderate recovery over the past couple of months, but is currently below 50, reflecting that bullish pressure is still limited.