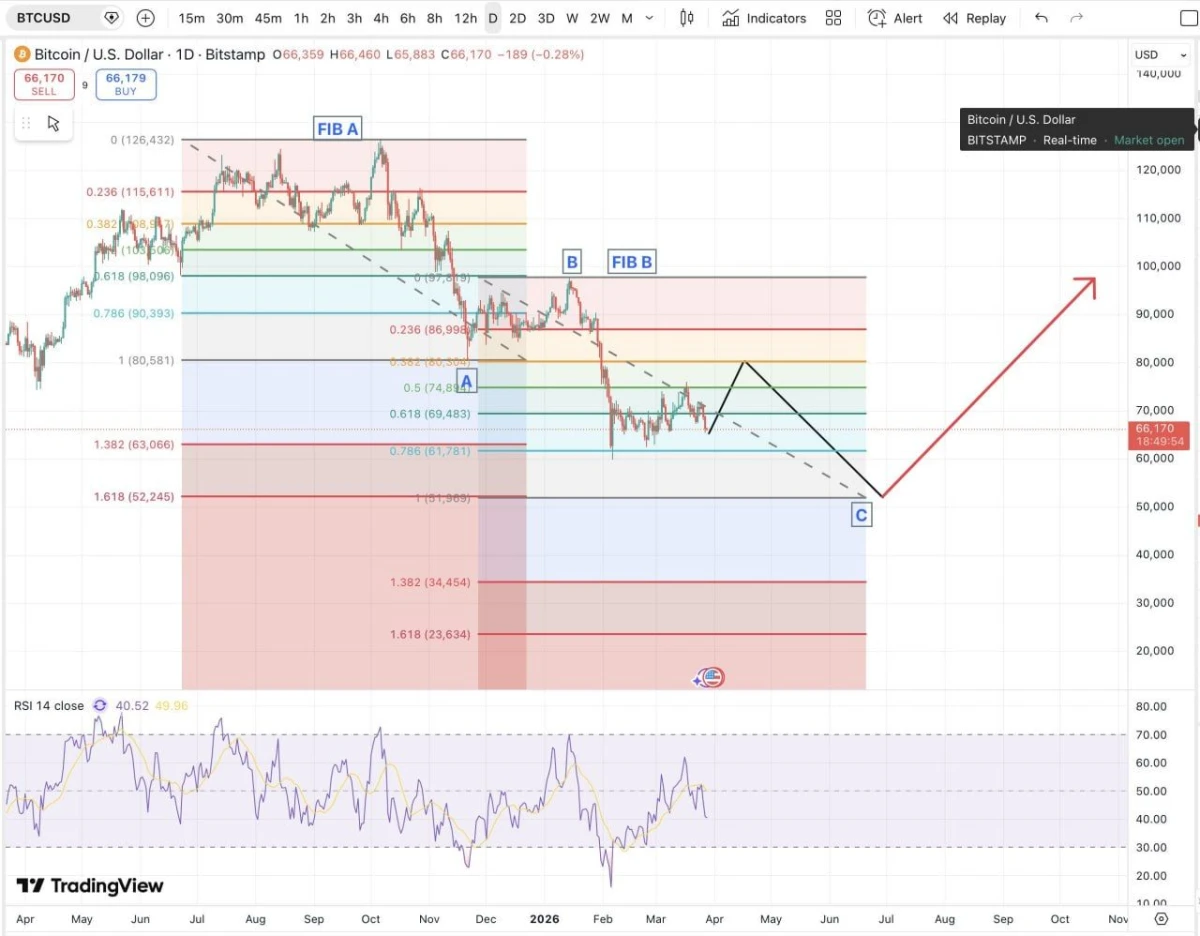
Bitcoin Short Bounce Setup. Source: Matthew Dixon on X
A dashed descending trendline still pointed lower, which kept the broader structure under pressure. The black path on the chart showed a temporary rally into resistance, followed by a decline toward the marked C zone near $51,969. After that, a red arrow projected a stronger rebound toward much higher levels later on.
The view combines short term bearish pressure with a longer term recovery idea. First, Bitcoin could climb enough to liquidate shorts. Then, if sellers regain control near resistance, the chart suggests another drop may follow before a larger upside move develops.
Dixon also added a warning about market behavior, noting that price can stay irrational longer than traders can stay solvent. That line underscored the risk of positioning too early. For now, the chart points to a possible bounce, but it keeps the next major downside move in play.
Bitcoin Tests Key Support as Trader Sees Room for Short Term Rally
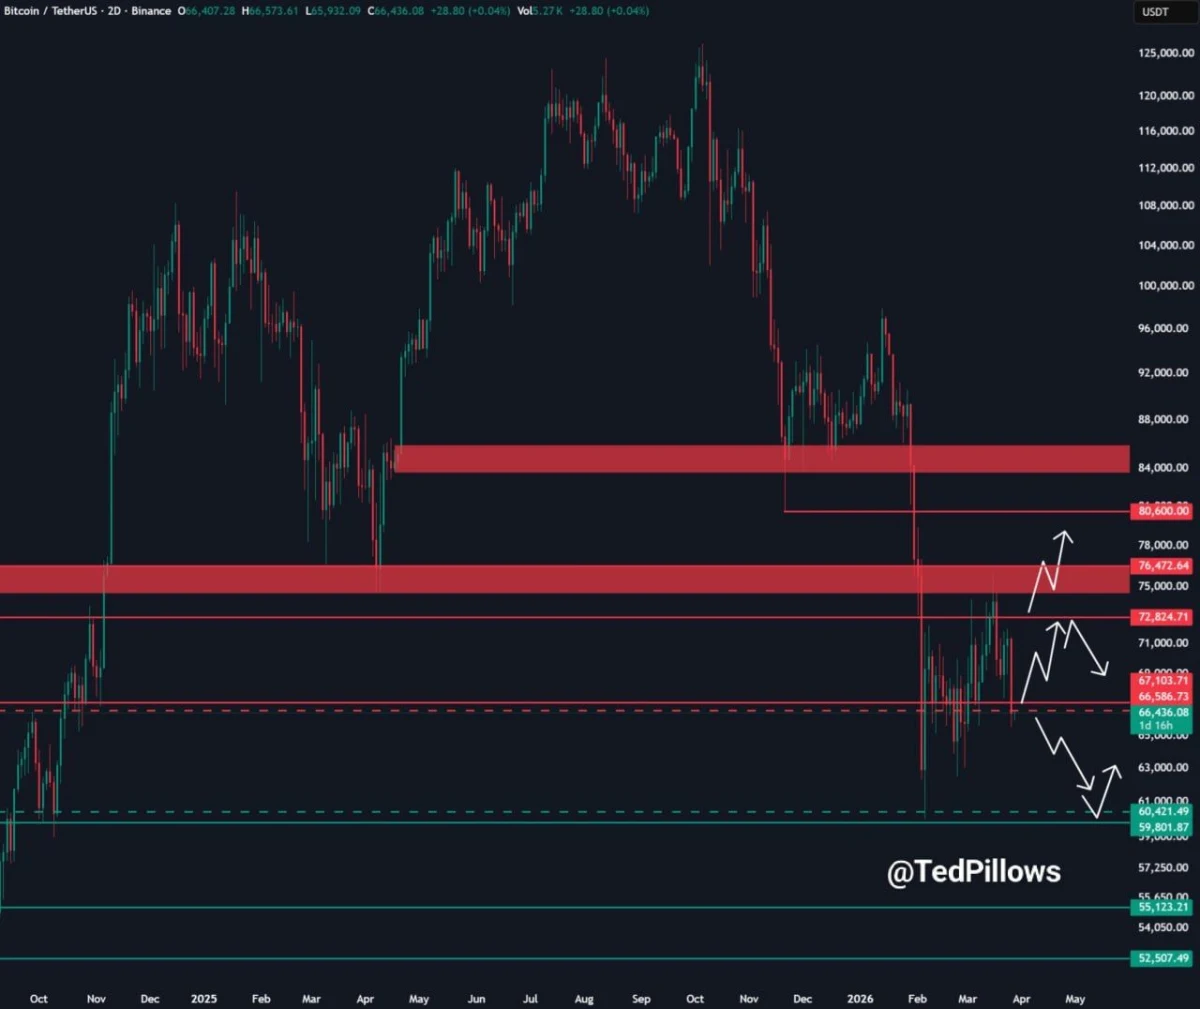
A two day Bitcoin chart shared by TedPillows showed $BTC trading at an important support zone after a sharp decline earlier in the year. The analyst said the main level to watch is the $65,000 to $66,000 area, which now acts as a near term floor.
Bitcoin 2D Chart Showing Key Support Zone. Source: TedPillows on X
The chart marked several possible paths from here. If Bitcoin holds this support band, the setup points to a rebound of about 6% to 8%, with upside levels clustered near the low $70,000s and then the mid $70,000s. In that case, buyers would need to defend the current zone and push price back into earlier resistance areas.
At the same time, the chart also outlined downside scenarios if support fails. A break below the current band could open the way toward lower support levels near $60,000 and then the mid $50,000s. Therefore, the structure remains highly dependent on whether the present range holds.
The main takeaway is that Bitcoin has reached a decision area. Support is in place, and a relief rally remains possible. However, if that floor breaks, the chart suggests the correction could extend further before a stronger base forms.

 coinpaper.com