
Bitcoin is heading into its sixth consecutive red monthly close on Tuesday, a streak that matches the longest in its history and has occurred only once before, in 2018, when $BTC rallied 300% in the months that followed.
Bitcoin Monthly Returns: What History Says About Six Red Months
Bitcoin has closed red 5 months in a row.
— Jeremy (@Jeremybtc) March 27, 2026
October. November. December. January. February.
March closes on Tuesday.
Right now $BTC is at $66k, down on the month.
Six consecutive red monthly closes would match the longest streak in Bitcoin's history.
The record was set… pic.twitter.com/0gU0erkEI6
The monthly returns table makes the current streak visible. January down 10.17%, February down 14.94%, March down 1.69% so far. Three months of red in 2026 follows October, November, and December of 2025 all closing negative, circled clearly on the chart. The only comparable sequence was 2018 into 2019, also circled, which ended with $BTC bottoming and beginning one of its sharpest recoveries.
Historical averages show April up 13.06% and May up 8.18%. Six consecutive red closes have never been followed by a seventh in Bitcoin’s recorded history. That does not guarantee a recovery, but it reframes the current setup. Six months of selling tends to flush out the weakest hands. What remains after that kind of compression is typically a market with less overhead selling pressure, not more.
Bitcoin Daily Chart: Rising Channel Holds At The Supertrend
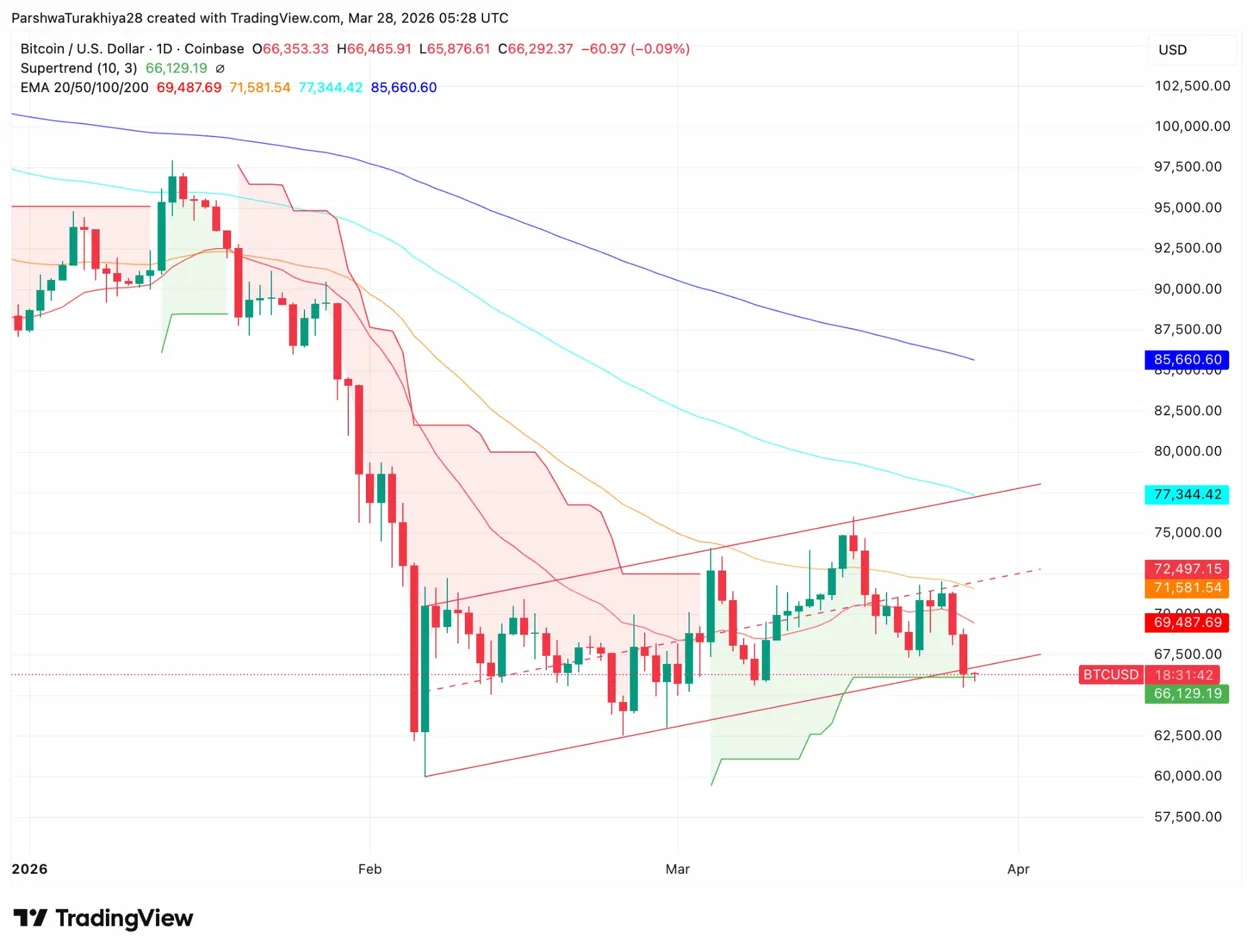
The daily chart shows $BTC building a rising channel since the February low near $60,000. The channel’s lower boundary and the Supertrend at $66,129 are sitting at almost exactly the same level as current price. That confluence is the line. Price closed Friday just above it at $66,292.
All four EMAs are stacked bearishly above. The 20-day sits at $69,487, the 50-day at $71,581, the 100-day at $77,344, and the 200-day at $85,660. Every EMA is declining. Getting back above the 20-day at $69,487 is the first real step toward changing the daily structure. Until then, the channel and the Supertrend are the only things keeping the February lows from coming back into view.
Key Technical Levels for $BTC
| Level | Value | Role |
| Supertrend / Channel floor | $66,129 | Critical support |
| 20-day EMA | $69,487 | First recovery target |
| 50-day EMA | $71,581 | Next resistance above |
| 100-day EMA | $77,344 | Major overhead resistance |
| Channel upper boundary | $75,000 | Bullish breakout target |
| Downside if channel breaks | $60,000 | February low |
Bitcoin ETF Outflows Hit A Three-Week High
The ETF data is the most pressing short-term concern. March 27 saw $225.48M in outflows, the largest single-day exit in three weeks. The day before recorded $171.22M out. Two consecutive days of heavy outflows with no fund recording a positive session points to institutional repositioning, not just noise.
BlackRock’s IBIT led the exit on March 27 with $201.53M leaving, bringing cumulative net inflows to $63.10B. Bitwise’s BITB saw $18.60M go. Total net assets across all funds sit at $84.77B, down from $91B earlier in March. The outflow streak now covers most of the second half of March after a strong start to the month. March began with $201.62M inflow on March 16, but the momentum reversed sharply from March 18 onward.
Morgan Stanley’s 14 Basis Point ETF Changes The Game
Morgan Stanley filed an amended S-1 pricing its spot Bitcoin ETF at 14 basis points, below every fund currently on the market. Grayscale’s Bitcoin Mini Trust sits at 15 basis points. BlackRock’s IBIT charges 25.
In a market where every fund offers identical Bitcoin exposure, cost is the only variable advisors act on. Morgan Stanley’s wealth management arm oversees trillions in client assets. Small allocation shifts across that base move billions. If approved, MSBT would be the first spot Bitcoin ETF issued directly by a major US bank.
Is This Bitcoin’s Final Flush Before A Recovery?
Six red months is the record. History shows it has never been followed by a seventh. April’s average monthly return across Bitcoin’s history is 13.06%, the strongest month on the calendar outside of October and November.
Hold the Supertrend and channel floor at $66,129 and the setup for an April recovery is intact. The 20-day EMA at $69,487 is the first target, then $71,581. Morgan Stanley’s ETF approval and ETF outflows stabilizing are the two catalysts that could accelerate the move.
Lose $66,129 on a daily close and the channel breaks. The February low near $60,000 becomes the next destination, and six red months becomes seven, which has no historical precedent to lean on.