
- Bitcoin has dropped to around $67,700 after breaking down from a descending triangle.
- Sentiment has flipped to Extreme fear, with a fear and greed reading near the 13th level.
- Renewed U.S.–Iran tensions and macro jitters push investors into risk-off mode.
Bitcoin price dropped to the $67,727 level following heavy selling pressure. The price dip is due to escalating geopolitical anxieties and a broader macroeconomic retreat. Earlier this week, temporary optimism surged when U.S. President Donald Trump announced a five-day pause on the Iran conflict, hinting at potential diplomatic talks.
However, the fragility of this ceasefire has become apparent to the global market. As the reality of the prolonged and unpredictable U.S.-Iran conflict sets back in, institutional and retail investors alike are aggressively de-risking their portfolios, moving capital away from volatile digital assets and towards traditional safe havens.
Bearish Market Outlook
Institutional and retail traders showed a risk-averse behavior during yesterday’s trading session across traditional equities. United States markets dropped, wiping out the brief recovery gains seen earlier in the week.
The Dow Jones Industrial Average and the S&P 500 both faced heavy, sustained sell-offs, and global oil futures exhibited extreme volatility. Investors are deeply concerned about disrupting global energy supply chains and inflationary pressures.
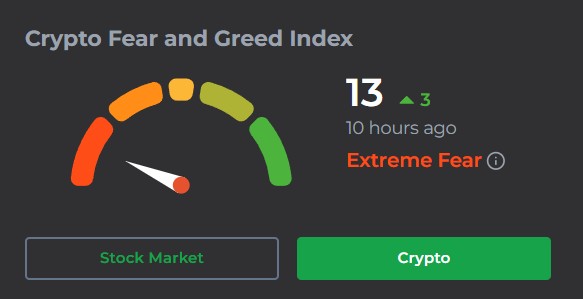
As a result of geopolitical uncertainties, the Crypto Fear and Greed Index has plummeted to a reading of 13. The market is firmly within the territory of “Extreme Fear,” a level indicative of severe panic and capitulation among market participants. Historically, “Extreme Fear” reflects a widespread belief in a further drop in Bitcoin’s price, prompting traders to liquidate positions at a loss to preserve capital.
However, in the current climate, where external macroeconomic triggers hold absolute dominance over algorithmic trading flows, this extreme fear is actively fueling the negative feedback loop and creating a high-friction environment for any attempted bullish reversals.
Examining the Bitcoin Price chart
Analyzing the 15-minute Bitcoin price chart reveals the precise structural damage inflicted upon the market over the past forty-eight hours. The visual data illustrates a textbook descending triangle formation that has aggressively broken to the downside. Earlier in the week, the asset made a valiant attempt to reclaim the $72,000 threshold, but met fierce overhead resistance.
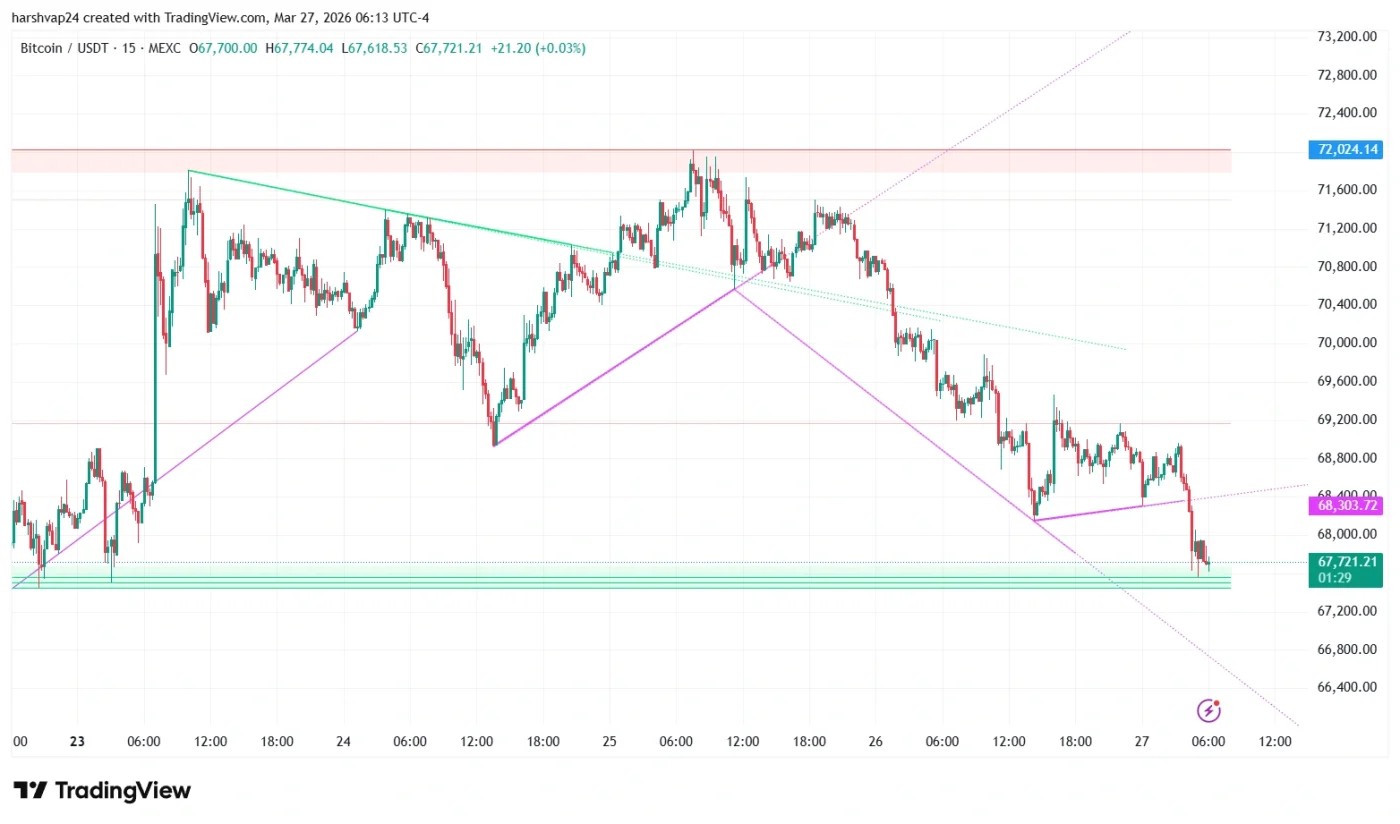
The critical psychological and technical support zone resting at $68,300 acted as the last line of defense for the bulls. The floor collapsed under broader market sell-off and triggered a cascade of long liquidations, forcing Bitcoin price into a rapid descent toward the current $67,724 support level.
From a technical indicator perspective, the short-term momentum has completely flipped in favor of the bears. The 50-period and 200-period exponential moving averages on the lower timeframes have formed a definitive death cross, visually confirming the loss of bullish strength. Furthermore, the Relative Strength Index (RSI) has plunged into deep oversold territory, reflecting the sheer velocity of the selling pressure.
The immediate bearish scenario suggests that if the current frail support at $67,700 fails to hold, Bitcoin could experience a rapid flush down to the $66,000 liquidity pool. This would likely be driven by further negative developments in the U.S.-Iran geopolitical theater or continued weakness in the traditional equities market.
On the flip side, the bullish argument relies on the concept of mean reversion and seller exhaustion. If the $67,700 level serves as a local bottom, a relief bounce back to test the previous breakdown point at $68,300 is highly probable. Reclaiming that level would be the first necessary step to neutralizing the immediate bearish technical structure.
Editor’s Note
As the weekend approaches, the cryptocurrency market remains in a highly precarious position, entirely tethered to the whims of international relations and Wall Street’s anxiety. The intersection of a fragile geopolitical ceasefire, tumbling traditional markets, and severely damaged technical chart structures creates a profoundly challenging environment for traders.
For the moment, the Bitcoin price is caught in a tug-of-war between deeply entrenched extreme fear and the underlying long-term scarcity narratives that typically support the asset. Market participants will be closely monitoring the geopolitical news cycle over the next forty-eight hours, knowing that a single headline could either validate the current breakdown or spark a massive short-squeeze recovery.