However, the both parties have released a list of specific demands and conditions that currently represent their official positions for entering a potential ceasefire. Along with the U.S-Iran-Israel conflict continuing to fuel uncertainty in the broader, on-chain data on $BTC’s user activities signals a sign of risk aversion sentiment rather than conviction in either direction.
Major Bitcoin holders have dramatically cut down on large transfers, with activity dropping to lows not seen in years as regulatory and global tensions remain looming.
Santiment on-chain metrics show that daily Bitcoin transactions above $100,000 averaged just 6,417 this past week, the lowest reading since September of 2023. Transactions over $1 million dropped even more to 1,485 per day – the slowest pace since October 2024.
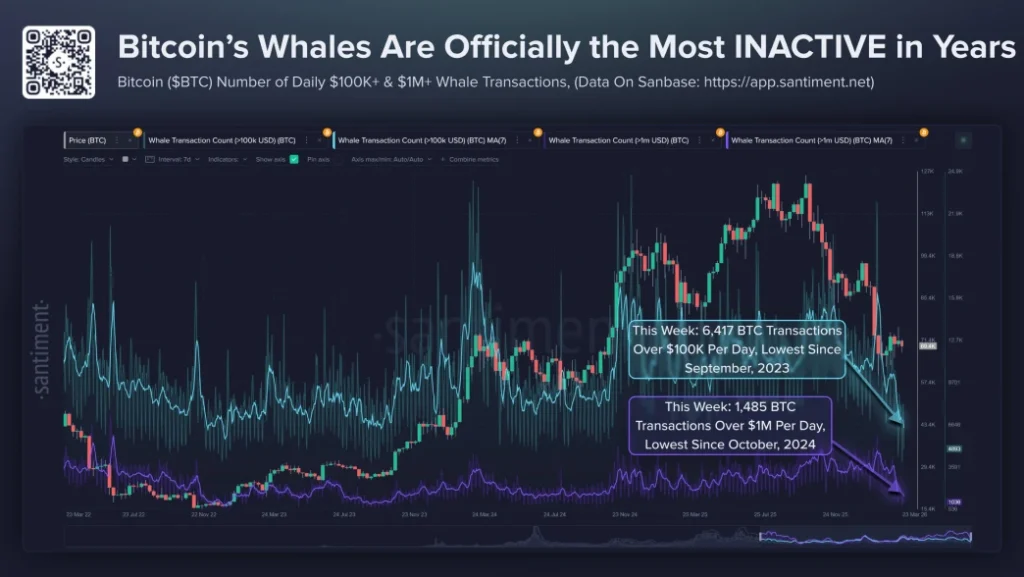
Charts monitoring these whale flows show steep drops over recent periods with mid-sized and ultra-large transfers both stalling at the same time. Large holders are apparently reflecting the caution exhibited by smaller investors, holding coins pretty much in place awaiting some developments regarding the stalled Digital Asset Market Clarity Act in Congress and wider international uncertainties.
Bitcoin itself has moved with moderate volatility near the level of $70,000 in recent sessions. The subdued whale movement gives no clear indication of the direction of price movement, only that large capital is parked and awaiting action for the moment.
$BTC Price Faces 18% Downside Risk Amid Bear Flag Formation
Over the past seven weeks, the $BTC price has showcased a slow yet steady recovery within two ascending trendlines in daily charts. While the series of higher highs and high lows within this channel showed sustainable recovery but technical outlook signals the formation of a bear flag pattern.
This chart setup emerges after a strong downtrend followed by a temporary recovery within the channel pattern to recoup the prevailing bearish momentum. If the selling pressure persists, the $BTC price could plunge over 4.8% and challenge the flag pattern’s support trendline at $67,300.
A potential breakdown could signal the continuation of prevailing downtrend and push Bitcoin towards $56,000.
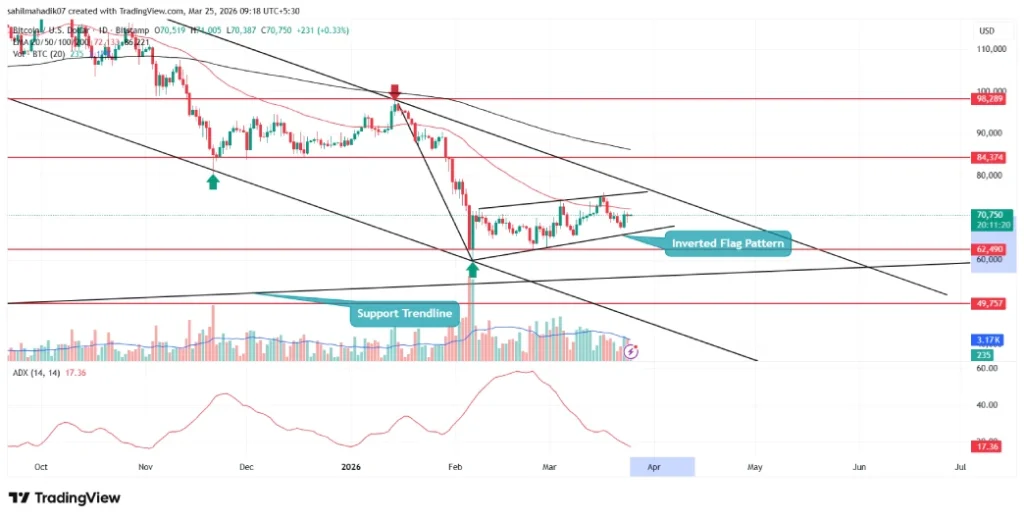
$BTC/USDT -1d chart
On the other hand, if $BTC price breaks above the $75,500 mark, the buyers could chase the initial target of $84,400, followed by $98,200.

 cryptonewsz.com