
Bitcoin is sending mixed signals as on chain flow data points to a possible new bull phase, while the price chart shows a fresh breakdown below short term support. Together, the setups leave Bitcoin at a key turning point, with stronger liquidity signals on one side and growing technical weakness on the other.
Bitcoin Bull Signal Returns as Inter Exchange Flow Pulse Turns Higher
Bitcoin may be showing an early sign of renewed strength after the Inter Exchange Flow Pulse, or IFP, started rising again, according to a chart shared by Ali Charts using CryptoQuant data. The indicator tracks the movement intensity of Bitcoin between centralized exchanges and is often used to gauge shifts in market liquidity. In the latest chart, the IFP appears to be turning up after a long decline, while Bitcoin also starts to recover from a recent drop.
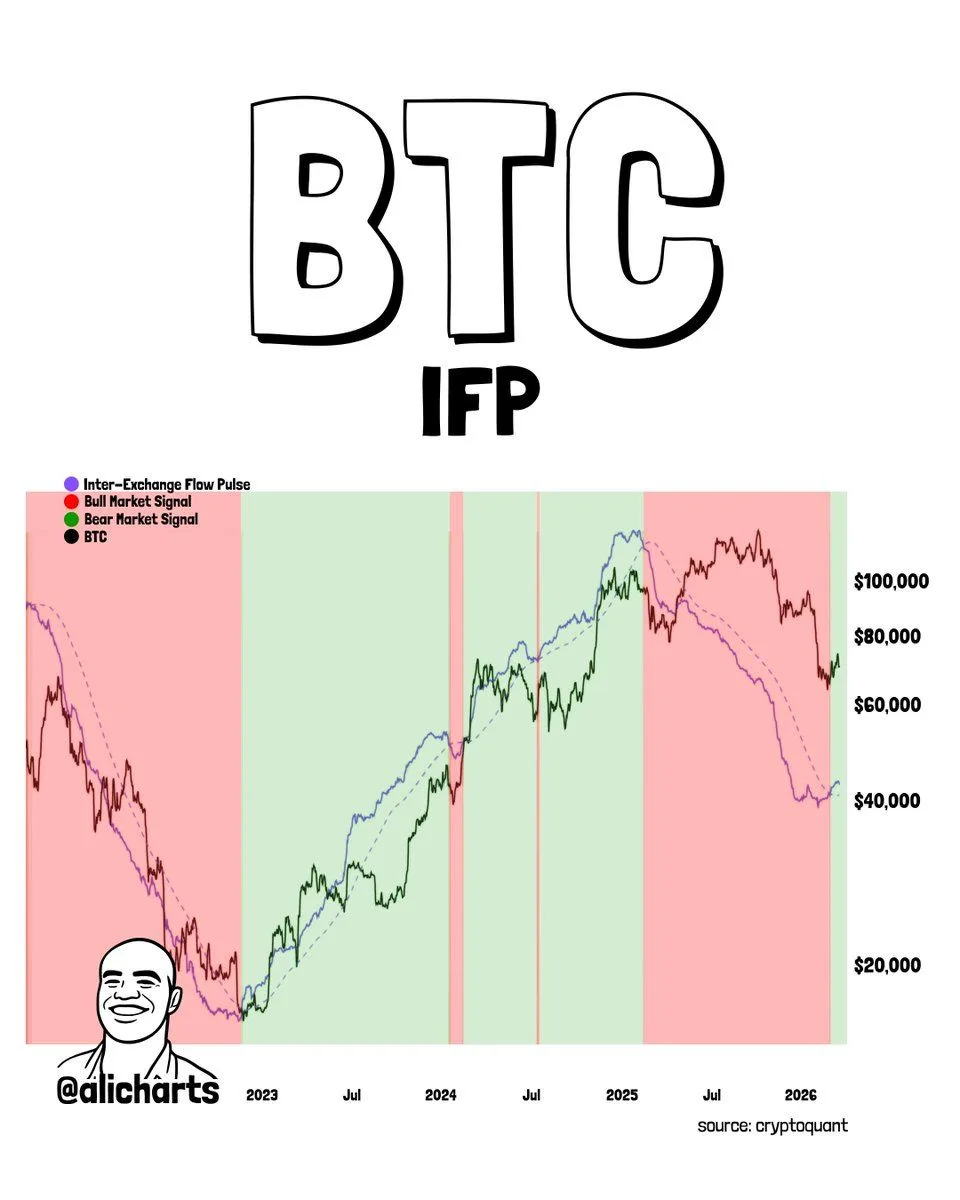
Bitcoin Inter Exchange Flow Pulse Chart: Source: Ali Charts
The chart places Bitcoin and the IFP against colored market phases. Green zones mark bull market signals, while red zones mark bear market signals. Earlier cycles on the chart show that when the IFP moved higher and stayed strong, Bitcoin also entered broader upward trends. By contrast, falling IFP readings tended to appear during weaker market phases or after major tops.
In the current setup, the IFP had been trending lower through much of the recent decline, then began to rise again near the latest part of the chart. That shift matters because it can point to stronger liquidity rotation between exchanges, which some analysts read as a sign that market activity is expanding again. As a result, the move is being interpreted as a possible fresh buy signal.
At the same time, the chart does not show a straight line higher for Bitcoin after every signal. Previous cycles included pullbacks, pauses, and false starts before broader trends became clear. Therefore, the latest IFP turn is better viewed as an early market signal than as proof that a full rally is already underway.
Even so, the timing is notable. The new upward move in the IFP comes after Bitcoin spent months inside a red marked phase, which the chart associates with bearish conditions. If that pulse continues to rise and Bitcoin follows with stronger price action, the signal could support the case that the market is moving into a new expansion phase.
For now, the chart suggests Bitcoin is at an important transition point. The indicator has turned higher, and that has historically aligned with stronger periods for price. Whether this becomes a lasting bull market signal will likely depend on whether the IFP keeps climbing and whether Bitcoin can build on the recent rebound.
Bitcoin Breaks Below Triangle Support as $62K to $63K Zone Comes Back Into Focus
Bitcoin has broken below local support near the $69,000 zone and moved out of a symmetrical triangle structure, according to a chart shared by analyst Cryptorphic on X. The breakdown followed a rejection from the $71,000 to $72,000 area, which had acted as a short term resistance band. As a result, the chart now points to weakening momentum and a possible move toward lower support levels.
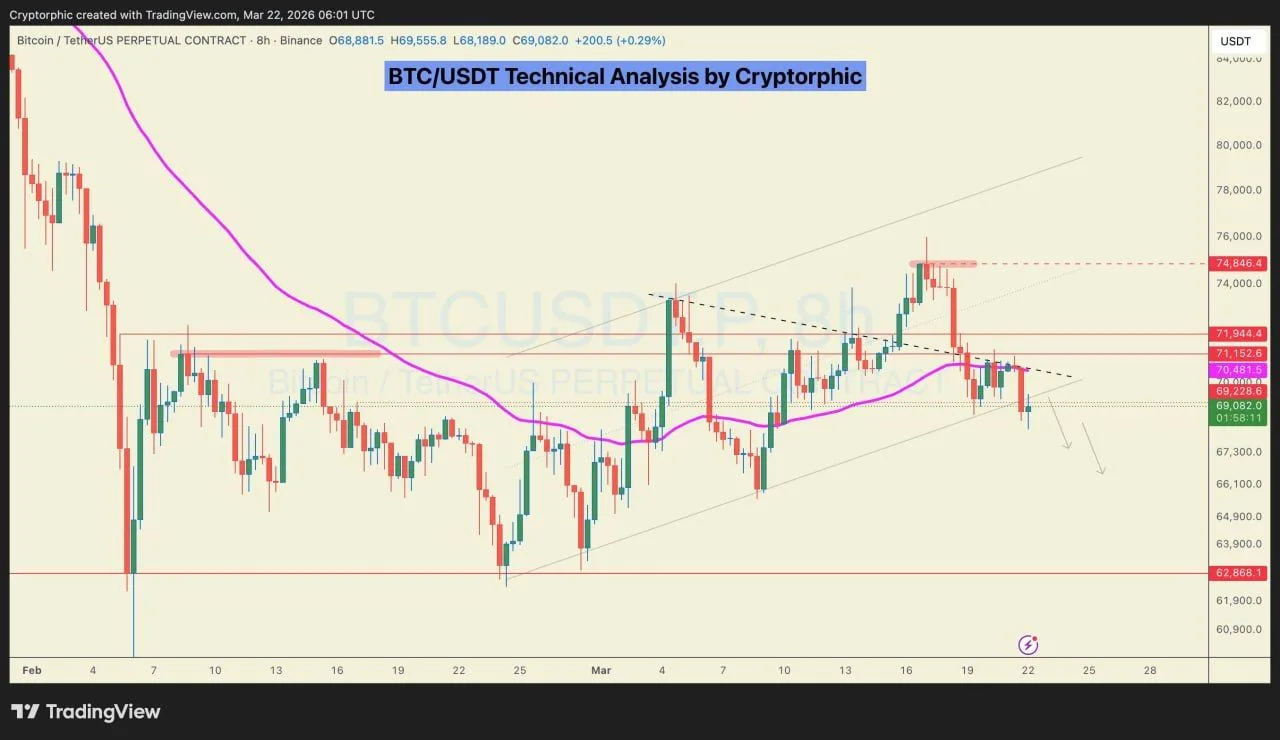
Bitcoin Symmetrical Triangle Breakdown Chart: Source: Cryptorphic
The eight hour BTC/USDT chart on Binance shows price losing the lower boundary of the triangle after several sessions of narrowing consolidation. Earlier, Bitcoin tried to push higher but failed to hold above the nearby resistance area. That rejection was followed by a slide back below the short term structure, which the analyst reads as a bearish shift in momentum.
The chart also places Bitcoin below key horizontal levels that had supported price during the recent range. Once that support gave way, the structure started to favor a deeper pullback instead of another immediate recovery attempt. In addition, the projected arrows on the chart suggest further downside if sellers keep control after the breakdown.
The next major area on the chart sits near $62,000 to $63,000. That zone stands out as a broader support region and could become the next target if the current weakness continues. Therefore, the chart suggests Bitcoin is moving away from its recent consolidation pattern and back toward a lower liquidity area where buyers may need to step in.
For now, the key signal is the loss of structure rather than a completed larger trend reversal. Bitcoin already failed at resistance, then lost local support, and now faces pressure below the triangle. If the breakdown holds, the bearish case strengthens and the $62,000 to $63,000 area becomes the main level to watch.