
Bitcoin is bouncing, but the setup still leans bearish. The Bitcoin price surged to a local high near $76,000 on March 17 before dropping sharply to around $68,690 by March 19. From that low, the price has recovered nearly 3%, moving back above $70,700, at press time.
This rebound shows short-term strength. But it may also be setting up the next move lower. That risk becomes clearer when both structure and macro conditions are considered together.
Bitcoin Bounce Builds Right Shoulder, Not Breakout
On the 8-hour chart, Bitcoin is forming a head and shoulders pattern, a structure that typically signals a move lower. The head formed near $76,000, with the left shoulder earlier in March. The current bounce is now shaping the right shoulder.
This makes the ongoing move important. Bitcoin is pushing into a resistance zone between $70,800 and $72,800, with extensions toward $73,500 still possible. Any rejection in this range can complete the right shoulder.
The structure only turns bullish if Bitcoin reclaims $76,000 cleanly.
On the downside, the neckline sits under $68,600. A break below this level can trigger a breakdown. In simple terms, the higher this bounce goes without breaking $76,000, the more complete the bearish setup becomes.
$BTC–DXY Model Shows Why The Bounce Still Exists
Despite the bearish structure, Bitcoin continues to hold up. BeInCrypto’s proprietary $BTC–DXY cycle model helps explain this.
On the 8-hour timeframe, the correlation between Bitcoin and the US dollar has slipped slightly below zero again. Even a mild negative correlation has historically supported upside. A similar setup appeared in late February, when Bitcoin rallied nearly 17% after correlation turned negative.
However, the current cycle is weaker. The correlation is hovering close to zero rather than moving deeply negative. This means Bitcoin is not fully reacting to dollar strength. It is moving more on internal momentum than strong macro alignment.
This macro backdrop aligns with comments from Gracy Chen, CEO at Bitget, who said:
“Markets are no longer reacting to policy decisions alone. Rising energy costs, delayed easing expectations, and a firmer dollar are creating a more selective investment environment where broad risk appetite becomes harder to sustain.”
In this environment, Bitcoin can still move higher when correlation turns slightly negative. But the move is less stable and more dependent on short-term momentum. If correlation flips back above zero again, as it did earlier in March, the probability of another correction increases quickly.
Positioning And Profits Suggest Selling Pressure Can Return
The derivatives market is already leaning toward downside risk.
On Binance’s $BTC perpetuals (seven-day positioning), short leverage stands near $1.93 billion, while long leverage is around $711 million. This means short positions are roughly 2.7 times larger than long positions.
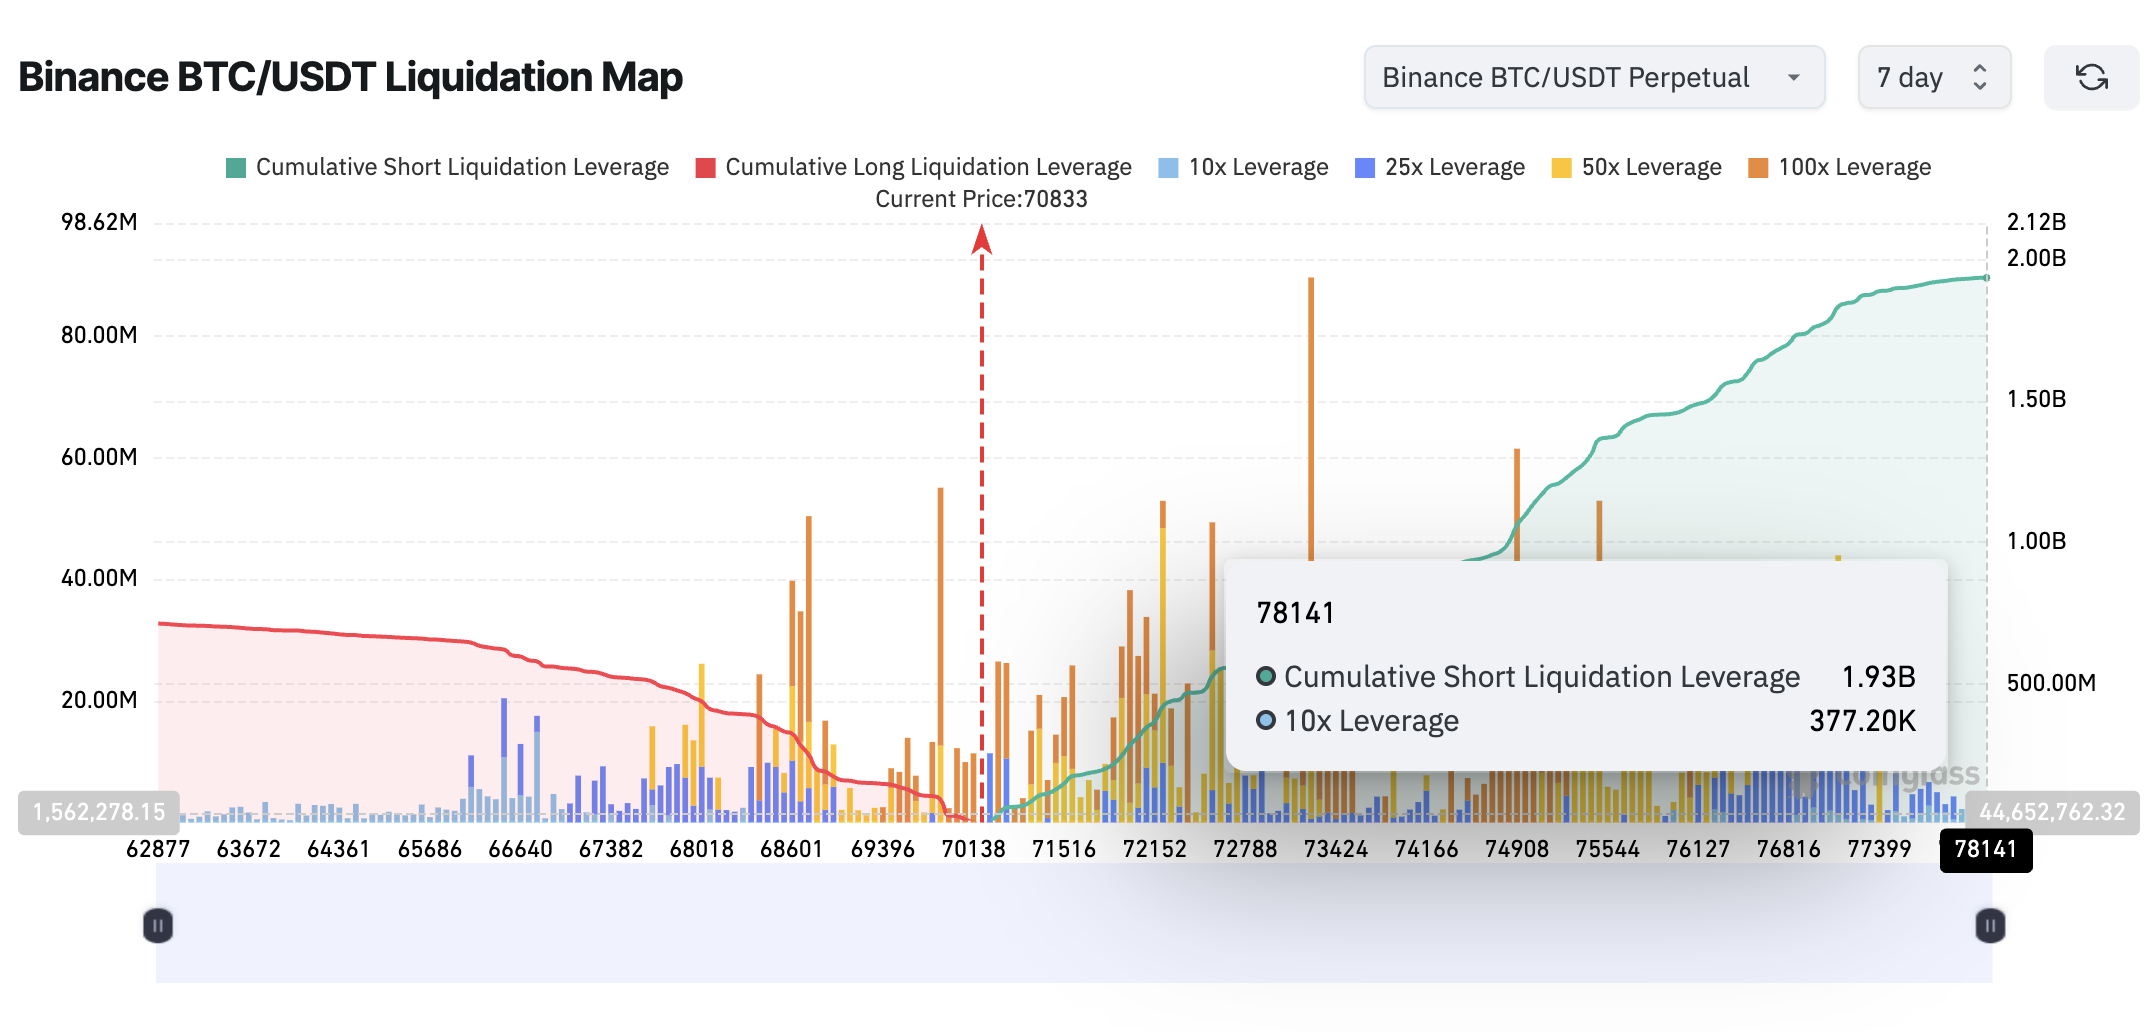
That imbalance suggests traders are preparing for a move lower. At the same time, on-chain data shows that profit levels remain elevated.
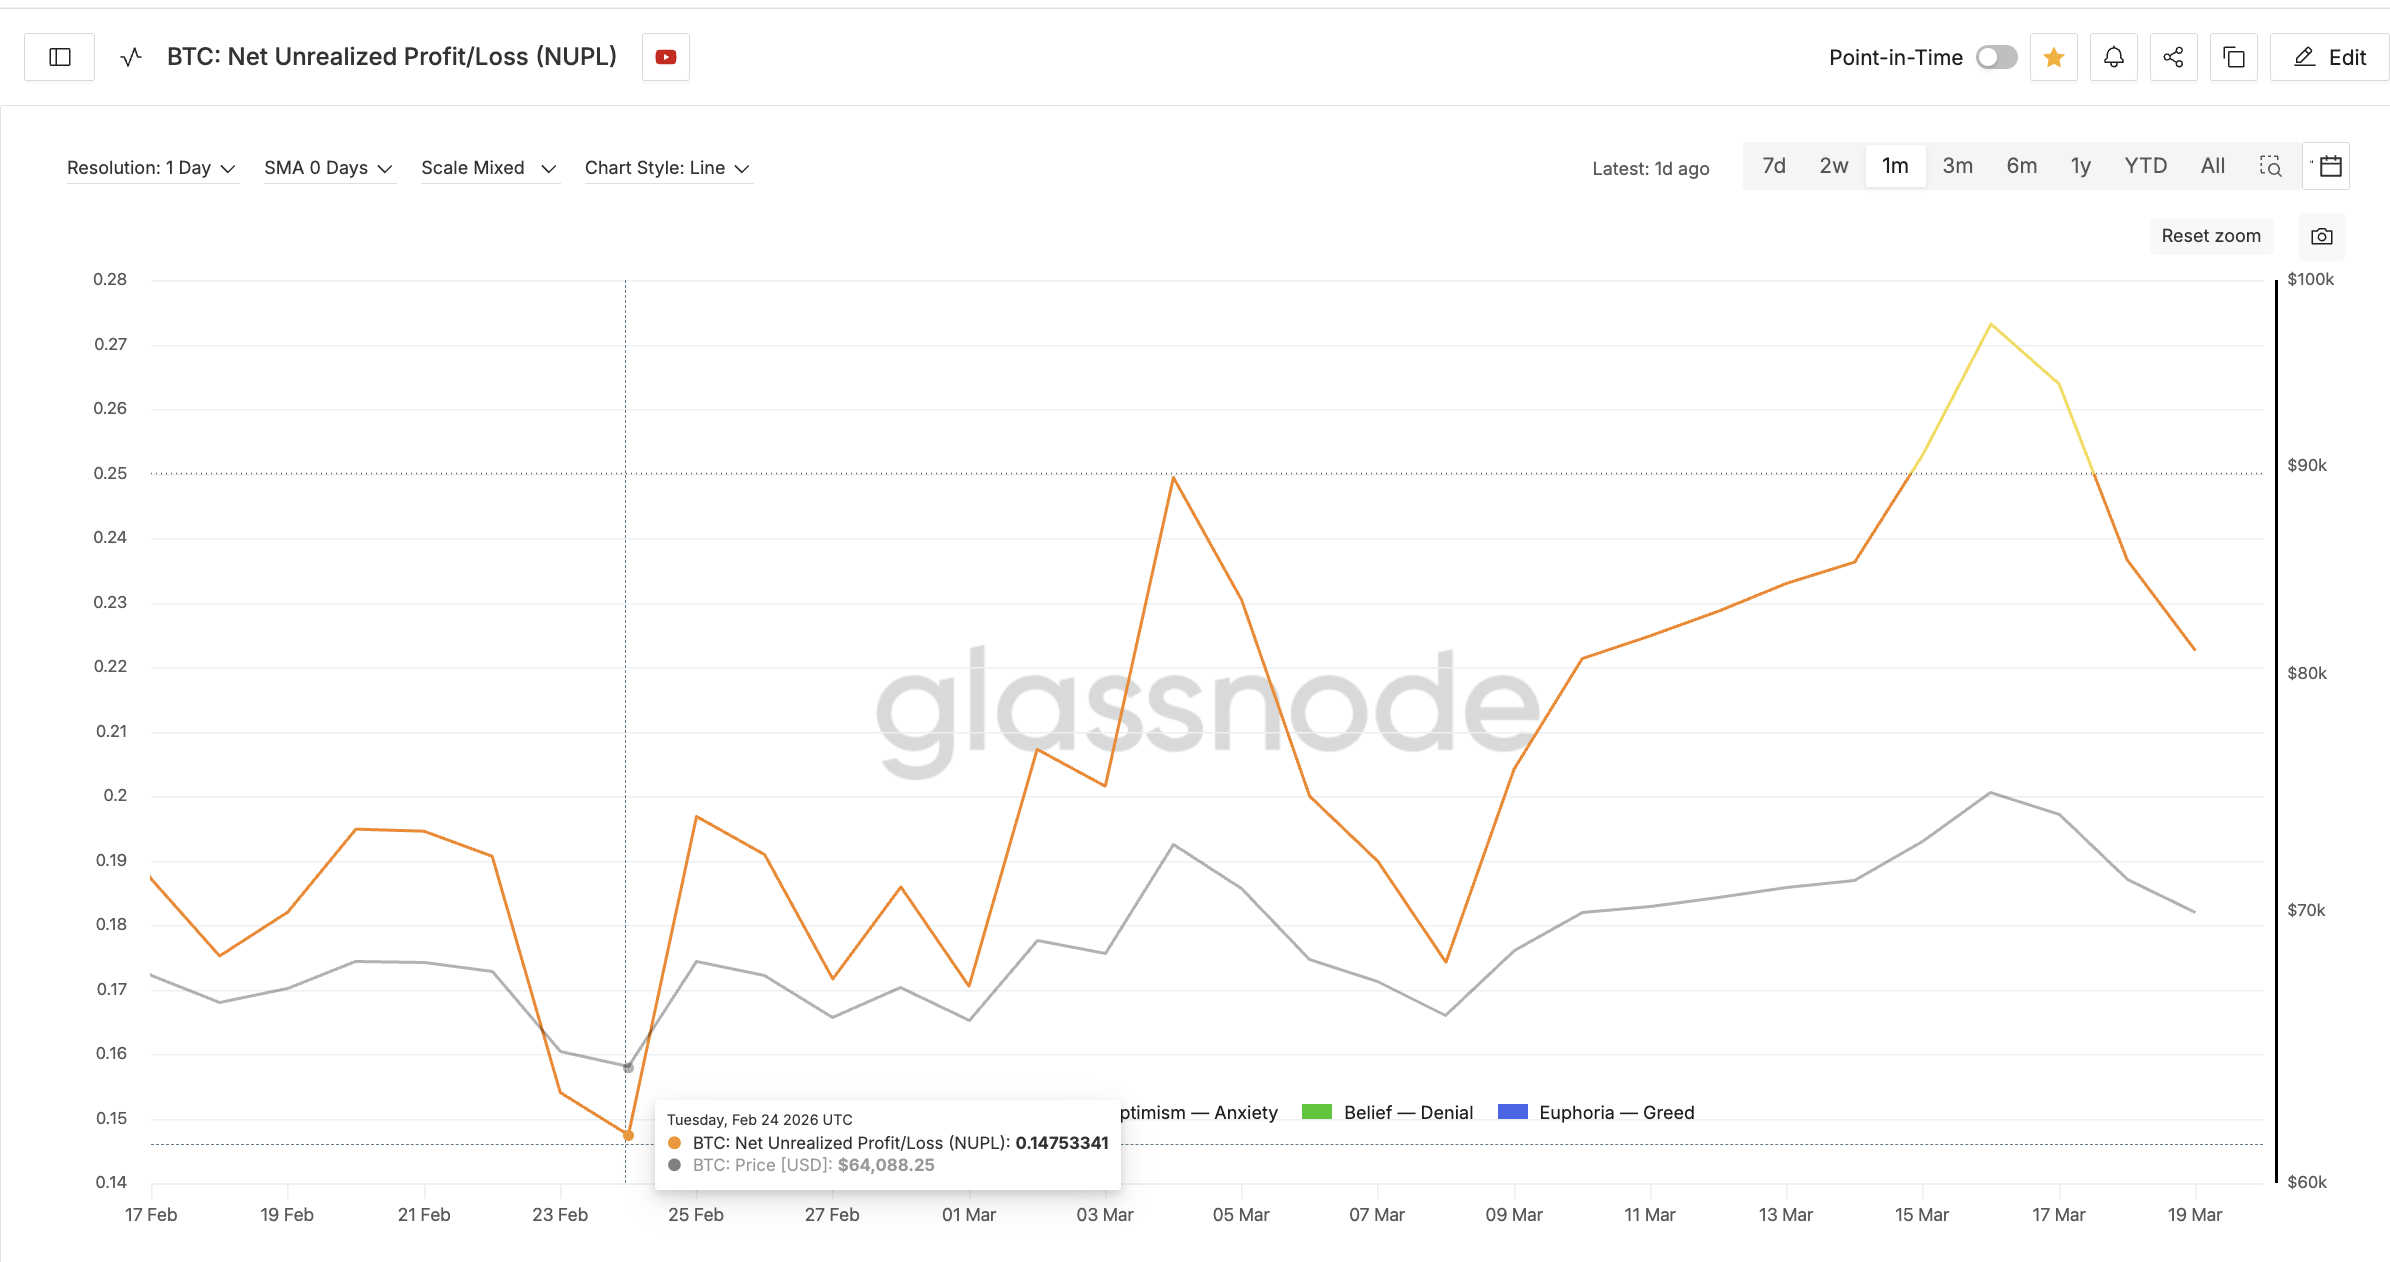
Bitcoin’s Net Unrealized Profit/Loss (NUPL), a metric measuring paper profit/loss, dropped from around 0.27 on March 16 to 0.22, but this is still well above the February low near 0.14. Even after the correction, a large portion of the market remains in profit. This matters because elevated profits often turn into selling when conviction weakens. And the bearish positioning per the Binance Liquidation Map confirms weakening conviction.
This setup directly reflects broader liquidity conditions post the Fed’s announcement to keep the rates steady on inflation concerns. Chen also added:
“Bitcoin’s short-term pressure after the announcement reflects tighter liquidity conditions, while institutional positioning remains highly sensitive to any shift in inflation data or geopolitical stability. If energy pressures ease or macro data softens, capital could return quickly to scarce assets and stronger crypto exposures.”
This is the key connection. When liquidity tightens, DXY tends to strengthen, pulling capital away from risk assets like Bitcoin.
- Fewer participants can sustain buying
- Rallies struggle to extend
- Breakouts often fail
That is exactly what the current structure reflects. Bitcoin is bouncing, but the move lacks the strength needed to break key resistance levels.
What This Means For Bitcoin Price
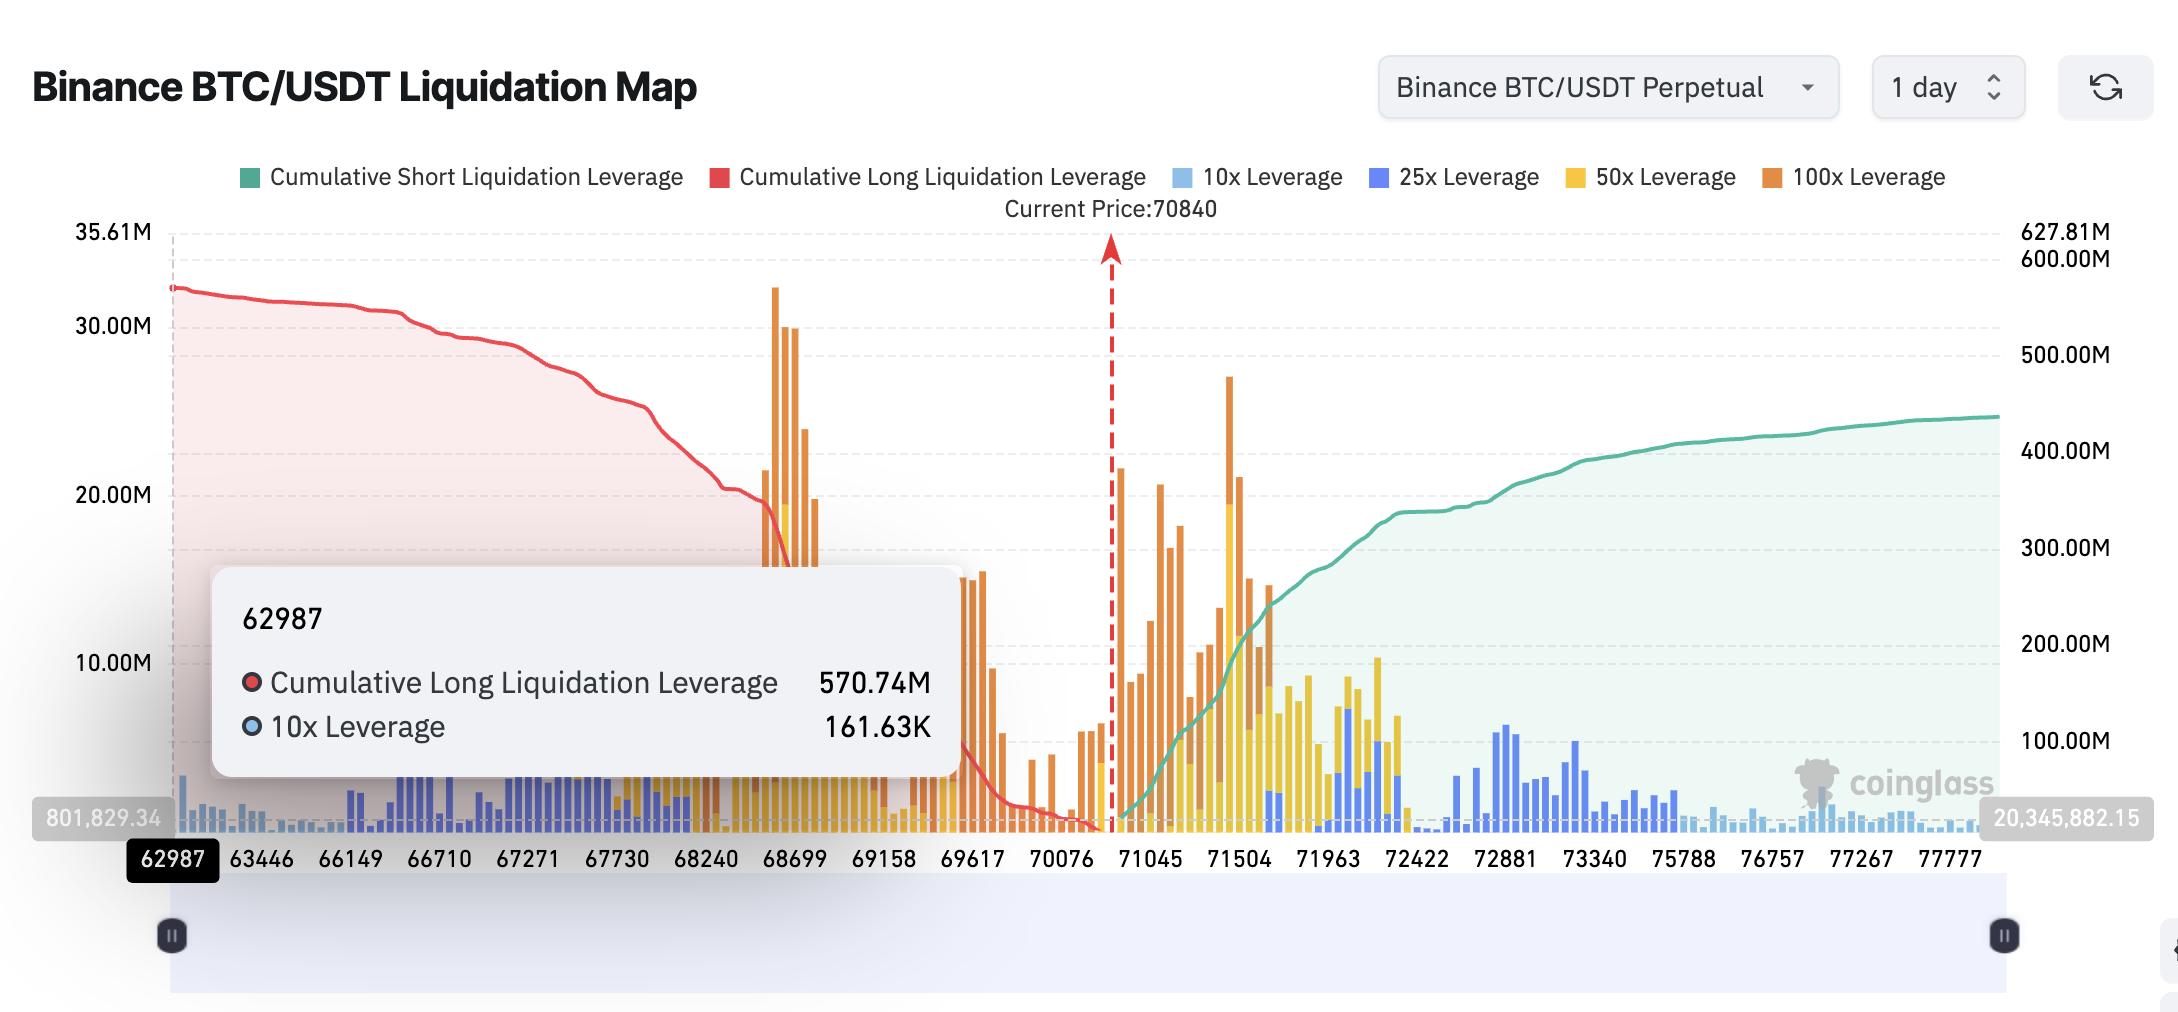
The Bitcoin price is at a critical point. In the short term, the bounce can extend toward $72,000–$73,500, supported by mild negative correlation and short-term positioning. Per the one-day $BTC/USDT liquidation data, the market still appears to be eyeing a continued bounce. The pattern changes if we see the 7-day positioning, discussed earlier.
 $BTC Liquidation Map">
However, the broader structure remains bearish below $76,000.
A breakdown below $67,800 would confirm the head and shoulders pattern and open the path toward $61,800, marking an approximate 8% decline, per the Head-to-Neckline projection.
In this environment, the bounce is real, but it is happening under tighter liquidity conditions. Without stronger inflows and with NUPL still elevated, the bounce is more likely to complete a bearish pattern than start a sustained recovery.
The post Bitcoin Bounce Faces 8% Risk as Bitget CEO Flags ‘Tighter Liquidity Conditions’ appeared first on BeInCrypto.