
Bitcoin is trading at $70,426 per unit on March 10, 2026, after rebounding from an intraday low of $67,958 and briefly testing a session high of $71,220. The cryptocurrency’s market capitalization stood at $1.408 trillion with $54.48 billion in 24-hour trading volume as price action stabilized within a well-defined intraday range.
Bitcoin Chart Outlook
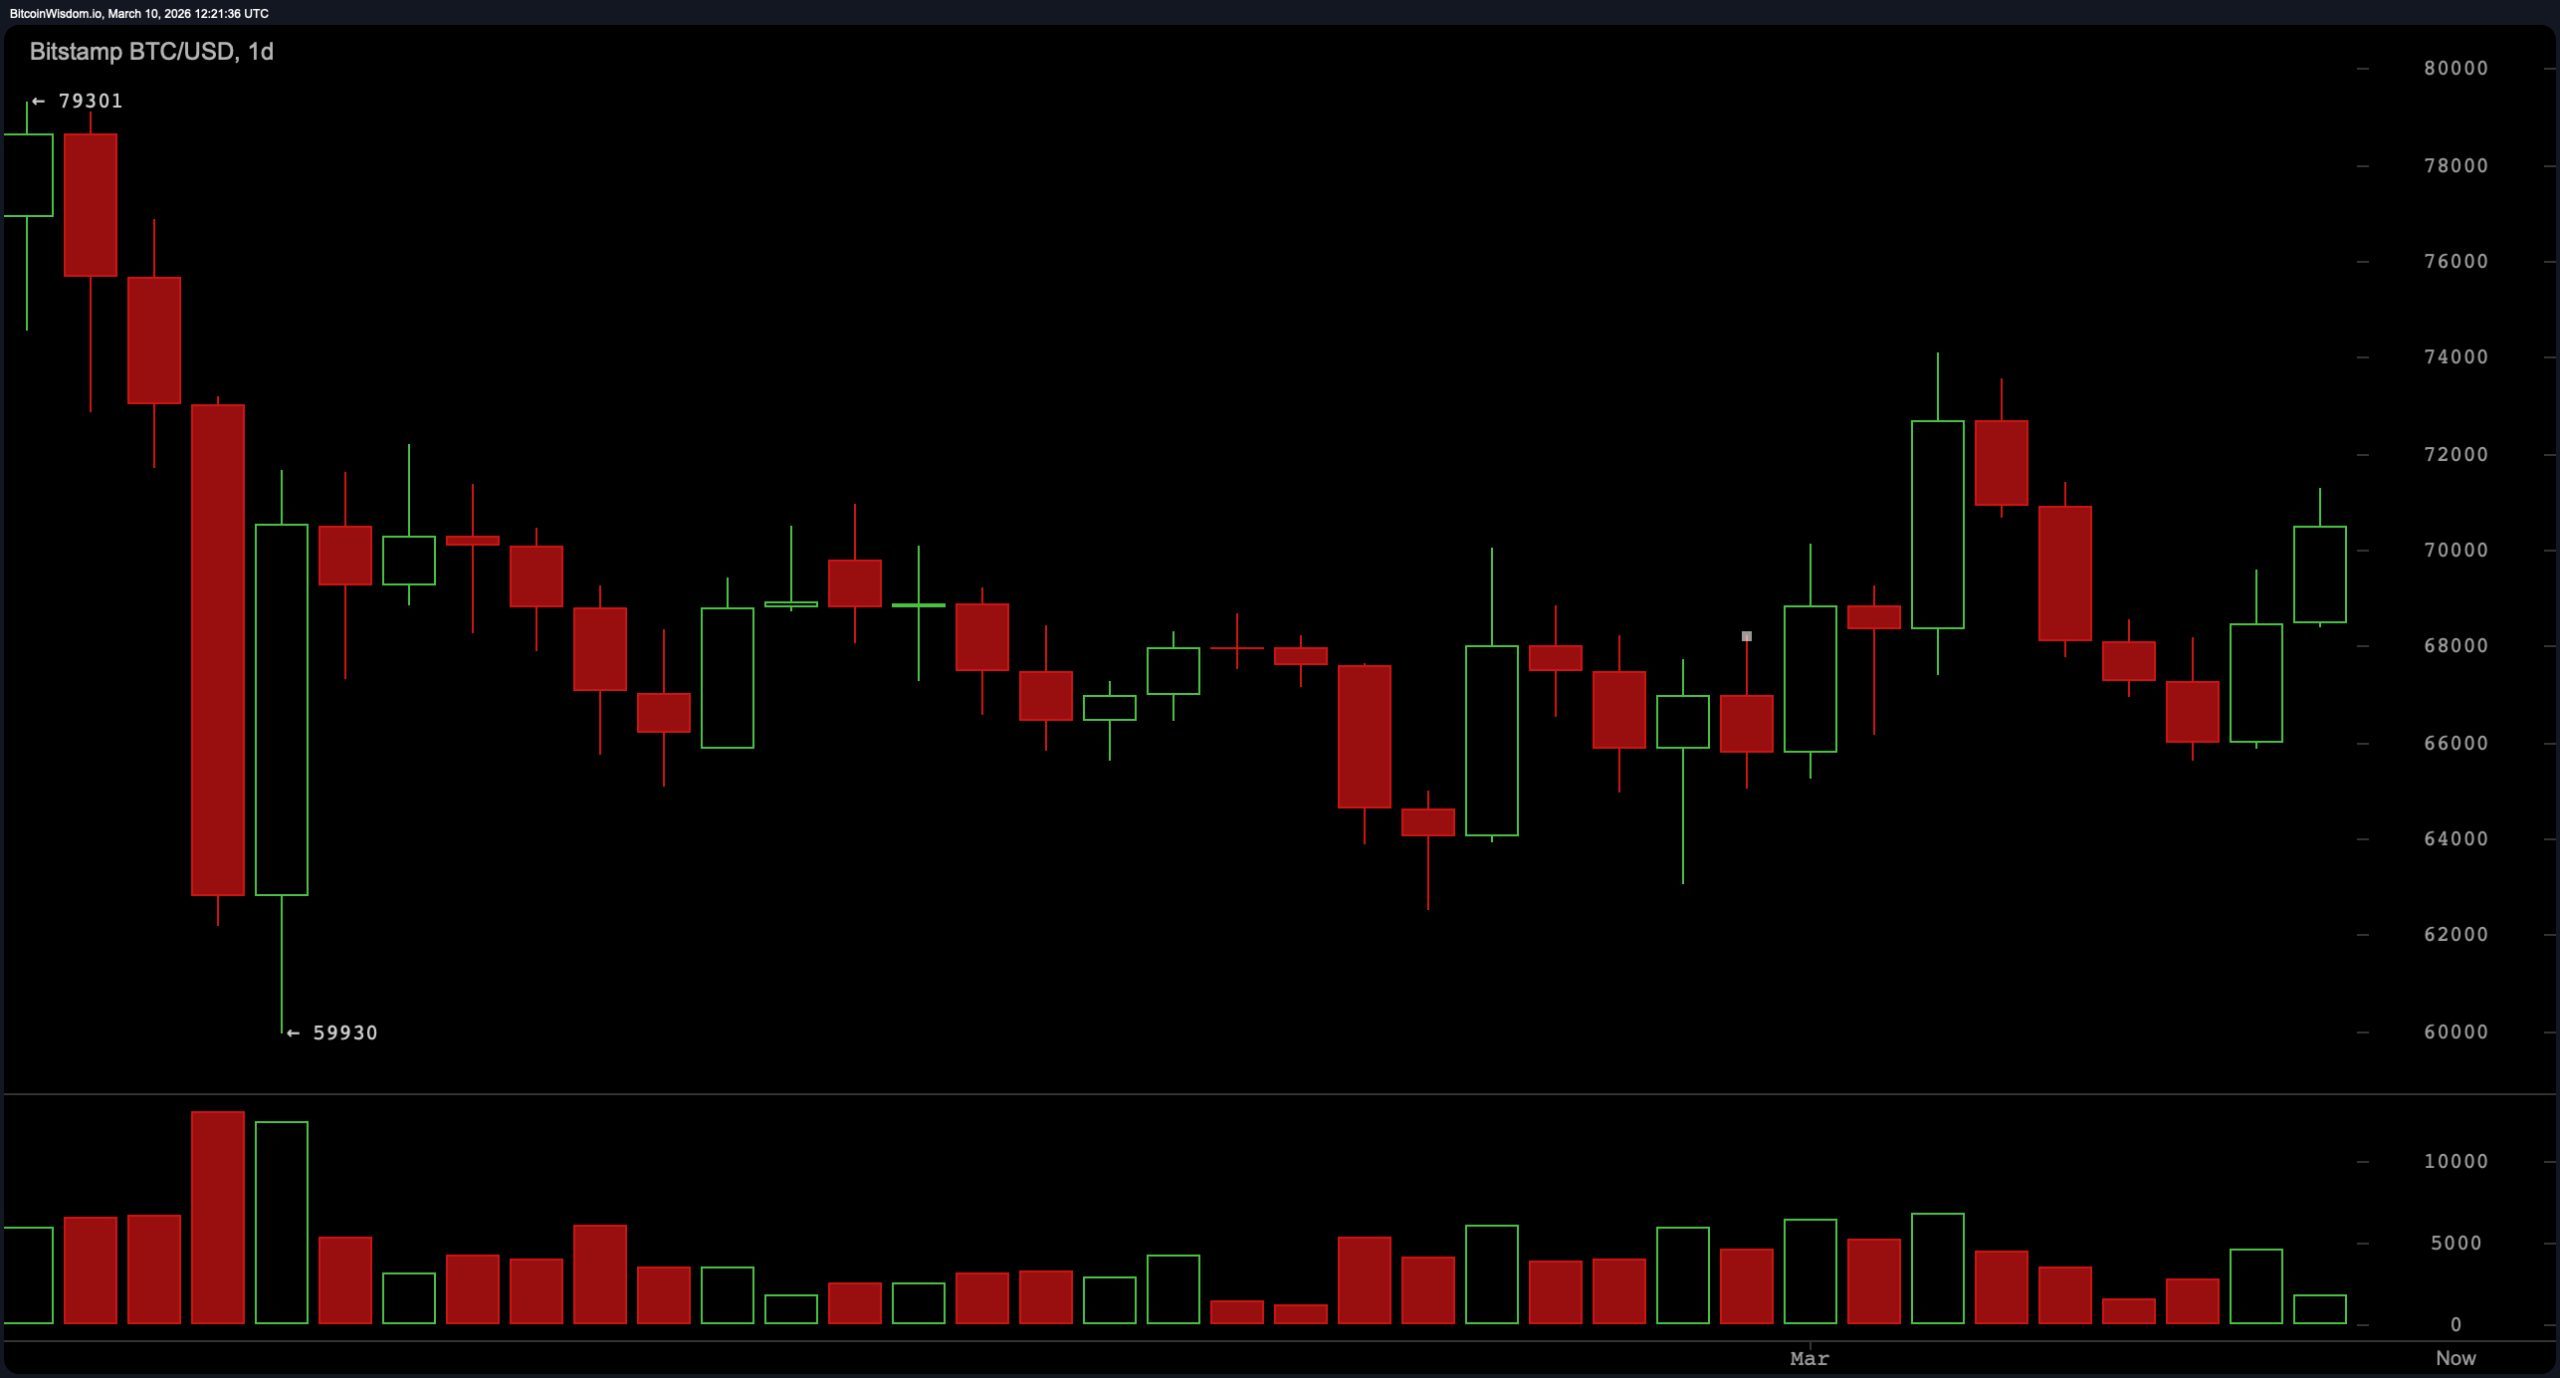
Price behavior across the daily chart reflects a market that has shifted from sharp downside volatility earlier in the broader cycle to a phase of range-bound consolidation. The session range between $67,958 and $71,220 highlights persistent two-sided activity, with participants repeatedly testing the upper boundary while defending lower support areas.
The recovery from the session low suggests buyers remain active near the lower portion of the range, though the inability to firmly establish territory above $71,000 continues to reinforce the market’s consolidation posture rather than signaling a decisive directional breakout.
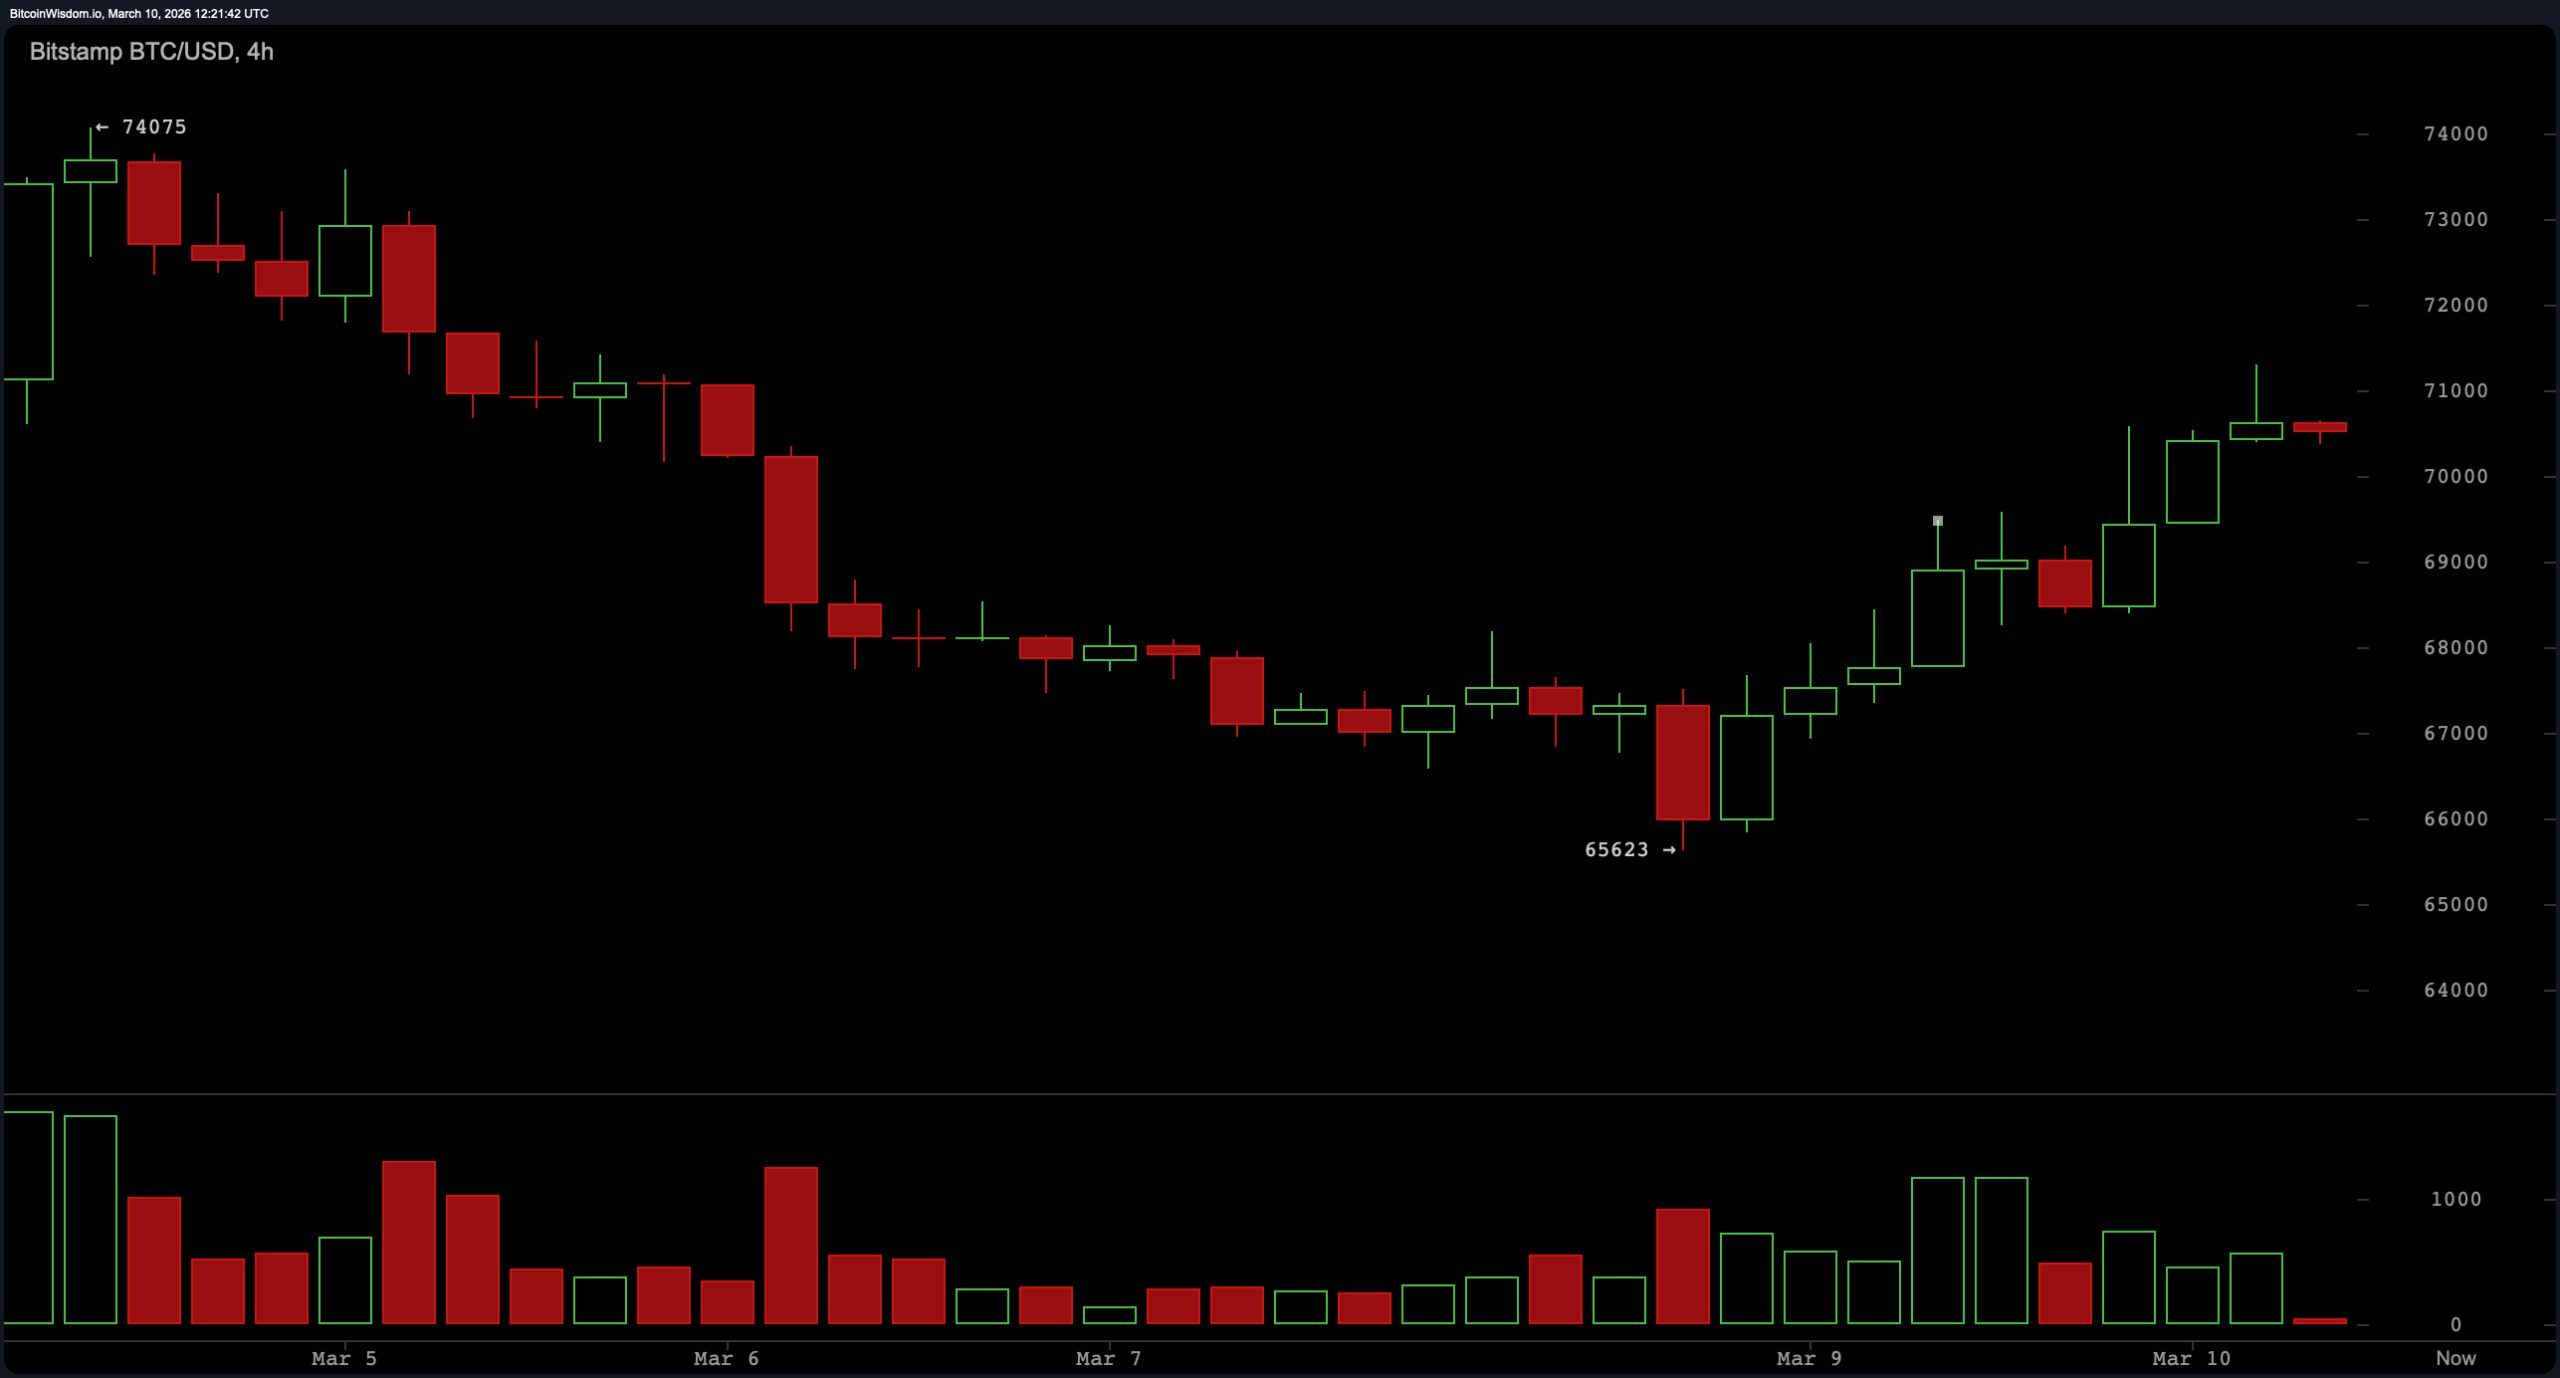
The four-hour chart presents a clearer view of the recovery structure that has unfolded following the recent downside move toward the mid-$60,000 region. Price action has formed a series of higher lows, gradually lifting bitcoin back toward the upper segment of the current range. The advance toward the $71,000 region coincides with a visible supply zone where prior upward attempts lost momentum. While the upward staircase pattern indicates strengthening short-term structure, the approach toward this resistance band suggests that the market is now testing whether the recovery has sufficient participation to challenge the ceiling again.
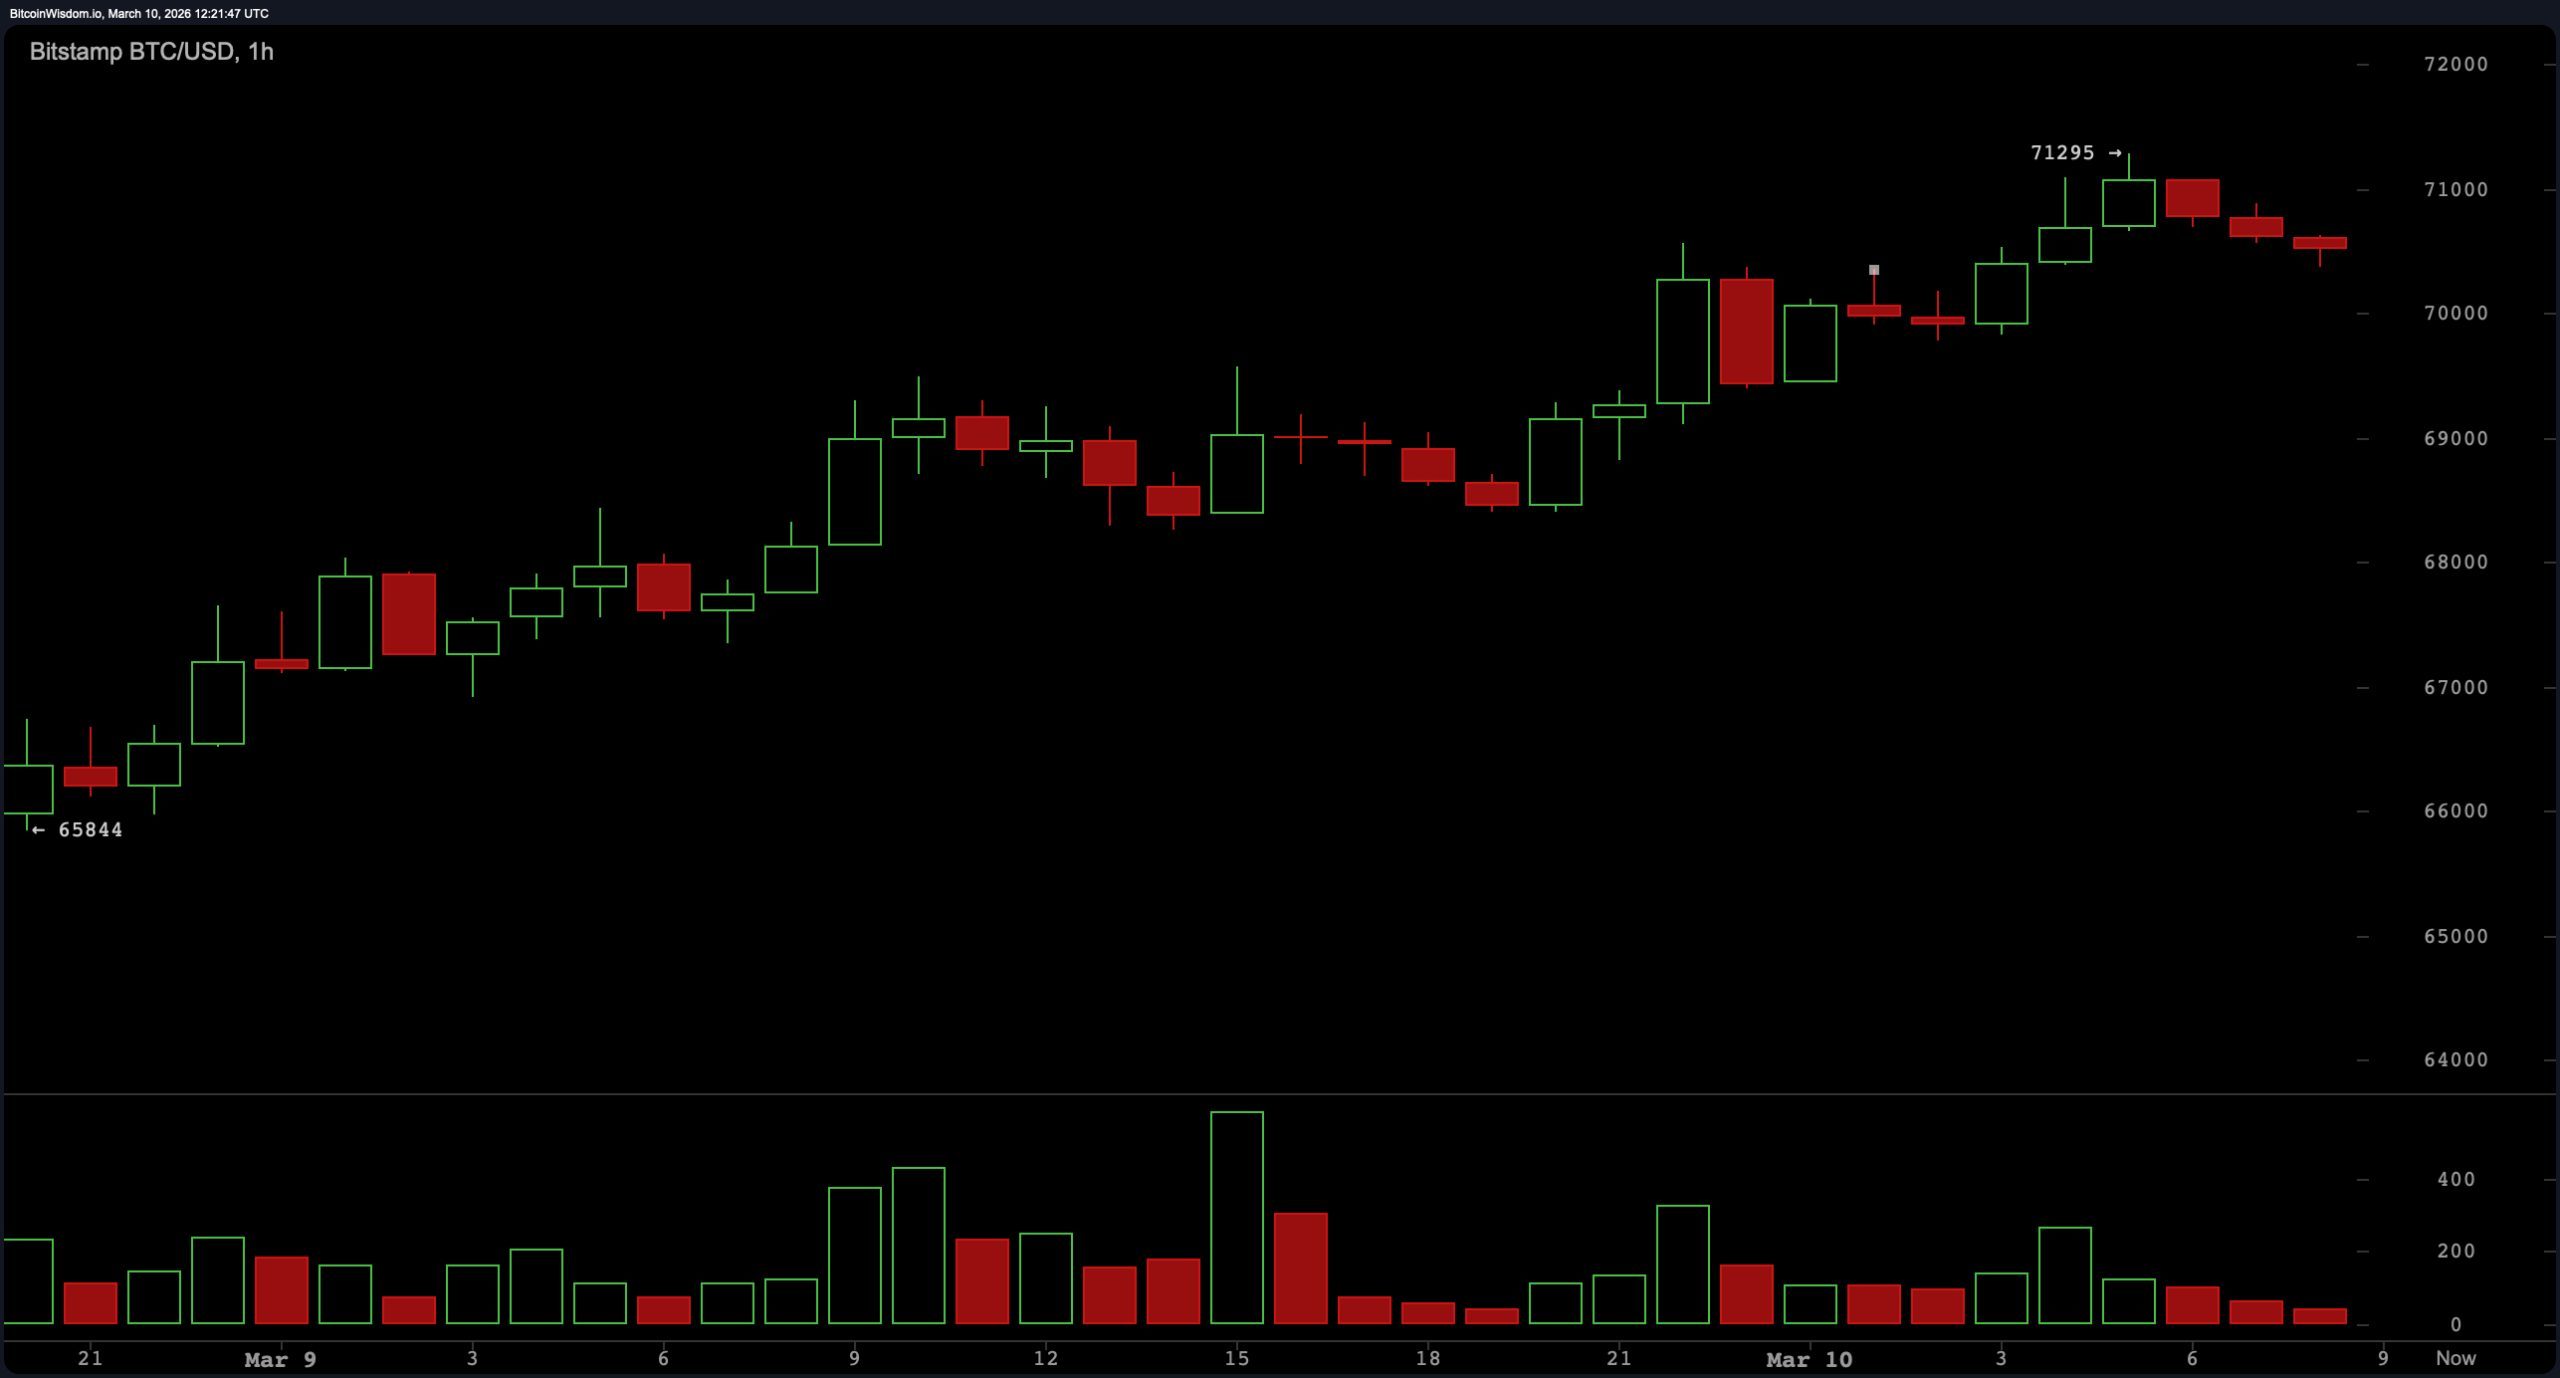
On the one-hour chart, the rally from the intraday low toward the $71,220 high shows momentum beginning to moderate as price pauses near resistance. Candles following the local high display reduced follow-through, indicating a cooling phase rather than a sharp continuation move. Liquidity testing around the $70,000 region remains evident, with the market hovering above nearby short-term structural support areas between roughly $68,500 and $69,000. In short: the rally ran up the hill, reached the fence, and is now deciding whether to hop it or simply stare at it for a while.
Oscillator readings from TradingView reinforce the market’s broadly neutral posture. The relative strength index ( RSI) sits at 52, while the Stochastic prints 50, both indicating balanced momentum conditions rather than an overextended environment. The commodity channel index (CCI) stands at 125, and the average directional index (ADX) registers 31, reflecting moderate trend strength without a decisive directional push.
The Awesome Oscillator on Tuesday prints 433, while momentum reads 3,628, and the moving average convergence divergence ( MACD) level sits at −906. Taken together, oscillators show two signals favoring upward momentum and nine neutral readings, suggesting modest positive pressure but not an overwhelming surge in conviction.
Moving averages present a more divided technical picture depending on the timeframe sensitivity. Short-term indicators lean positive, with the exponential moving average (10) at $68,517 and the simple moving average (10) at $68,694, both positioned below the current price. The EMA (20) at $68,711 and SMA (20) at $67,725 also sit beneath the market, alongside the EMA (30) at $69,919 and SMA (30) at $67,894.
Long-term trend gauges remain overhead, however, including the EMA (50) at $73,162 and SMA (50) at $73,201, as well as the EMA (100) at $80,432, SMA (100) at $81,749, EMA (200) at $88,693, and SMA (200) at $94,970. The result is a technical landscape where short-term averages support the current recovery, while longer-term averages loom above like skeptical supervisors waiting to see whether this rally can keep its momentum.
Bull Verdict:
If bitcoin continues holding above the $69,000 structural support area highlighted on the lower timeframes, the technical bias favors another test of resistance between $71,000 and $71,200. Sustained strength above that band would signal expanding momentum within the current range structure and could open the door to a move toward the upper boundary of the broader consolidation zone around $72,000 to $74,000, provided volume and short-term momentum indicators continue aligning.
Bear Verdict:
Failure to maintain support above the $69,000 region would weaken the current recovery structure and likely shift attention back toward the $67,500–$68,000 support zone identified on the four-hour chart. A deeper decline toward the $66,000–$64,000 demand area would place bitcoin back near the lower boundary of the broader consolidation range, where market participants have previously stepped in to stabilize the price.
FAQ 🔎
-
What is bitcoin’s price on March 10, 2026?
Bitcoin is trading around $70,426, rebounding from a 24-hour low of $67,958.93 and nearing resistance around $71,200. -
Is bitcoin in an uptrend right now?
Short-term charts show a recovery with higher lows, but the broader structure remains range-bound between roughly $64,000 and $72,000. -
What are the key bitcoin resistance levels today?
Immediate resistance sits between $71,000 and $71,200, with stronger range resistance forming near $72,000–$74,000. -
What are the main bitcoin support levels to watch?
Key support zones appear around $69,000, $67,500–$68,000, and the major demand area near $64,000–$65,000.