
Bitcoin trades near key support as analysts highlight a historic accumulation area. Where’s $BTC headed?
Bitcoin ($BTC) is lower by about 1.16% over the past 24 hours, with the price trading near $67,973 as the market experiences mild short-term volatility. The intraday chart shows $BTC initially moving above the $68,000 region before momentum weakened and the price slipped toward the $66,000 area.
After touching this lower range, buyers return and push the asset back upward, allowing Bitcoin to recover much of the earlier decline while continuing to fluctuate between roughly $66,000 and $68,000.
Bitcoin posts a 3.42% rise over the last week, suggesting short-term buying pressure is gradually returning. However, the broader trend still reflects weakness, with $BTC down 3.64% over 30 days and 25% across 90 days. This leaves traders watching closely to see whether the recent rebound marks the beginning of a stronger recovery.
Will Bitcoin See a Stronger Recovery?
Notably, Bitcoin is moving within the daily Bollinger Bands indicator after a decline from higher levels earlier in the day. The middle band (20-day SMA) around $67,471 is currently acting as a short-term pivot point, with price fluctuating slightly above it. Meanwhile, the upper Bollinger Band near $71,261 forms the nearest resistance zone, while the lower band around $63,681 provides the next key support if selling pressure returns.
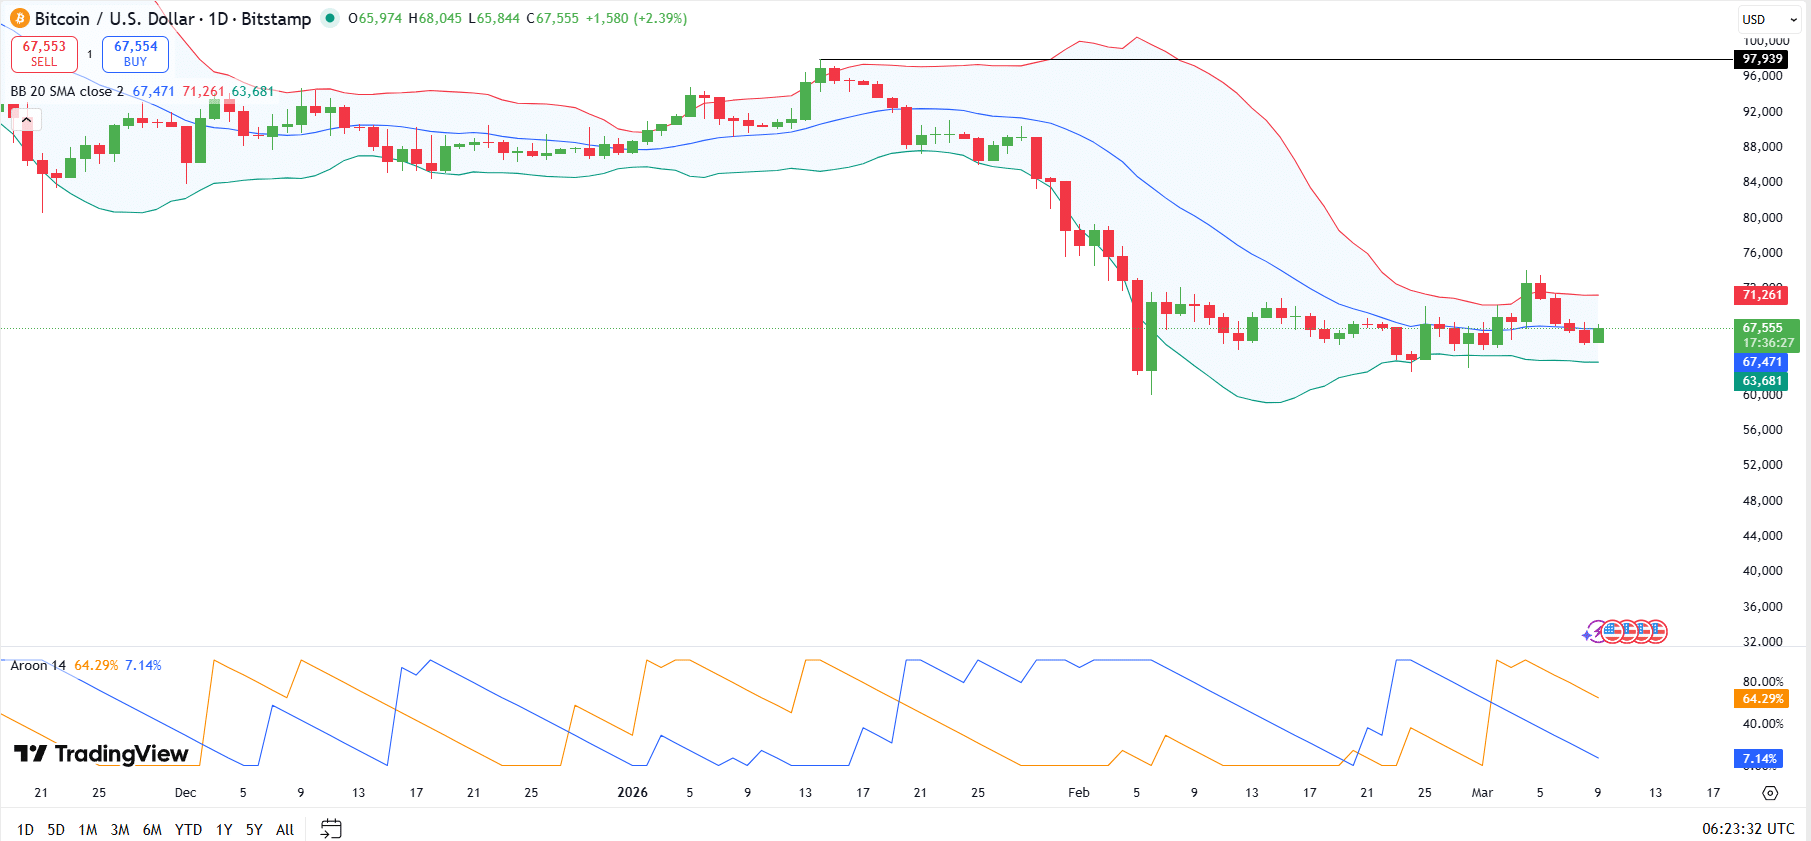
Meanwhile, momentum indicators provide additional context for the current structure. The Aroon indicator shows Aroon Up above 64% while Aroon Down sits around 7%. This signals that recent upward price activity is strengthening while bearish momentum continues to fade in the current trend.
If Bitcoin maintains support above the middle Bollinger Band and begins pushing toward the $71,000 resistance region, the asset could attempt a short-term recovery. Failure to hold above the current support zone may expose Bitcoin to another test of the $63,000–$64,000 range, where the lower band aligns with potential demand.
Best Accumulation Zone Yet?
Elsewhere, crypto analyst Trader Tardigrade highlights that Bitcoin is currently approaching a historically important technical level on the monthly chart. According to the analyst, the 20-month exponential moving average (EMA) has repeatedly acted as a key accumulation zone for long-term holders throughout previous market cycles.
In earlier phases of Bitcoin’s trend, price pullbacks toward this moving average often coincided with periods where investors accumulated positions before the market resumed a broader upward trajectory.

The chart shared by the analyst identifies several historical accumulation areas where Bitcoin retraced toward the 20-month EMA before continuing its long-term rally. The latest pullback places Bitcoin in what the analyst describes as “Accumulation Zone 4,” suggesting the market may again be testing a level that historically attracted long-term buyers. The analyst also notes that such technical setups appear infrequently.