Bitcoin held inside a tight range while a liquidation heatmap showed heavy liquidity stacked near $69,000 to $70,000 and another pocket forming around $62,000. On the daily chart, $BTC also printed a breakout and retest from a tightening triangle, with $70,000 marked as the next level to clear.
Bitcoin Liquidity Heatmap Shows Key Levels Around $69K and $62K
A Bitcoin liquidation heatmap shared by analyst Columbus on X shows $BTC trading inside a compressed range while liquidity clusters build above and below the current structure. The four hour BTCUSD chart overlays price action with the MMT heatmap, which highlights areas where large liquidation pools may form.
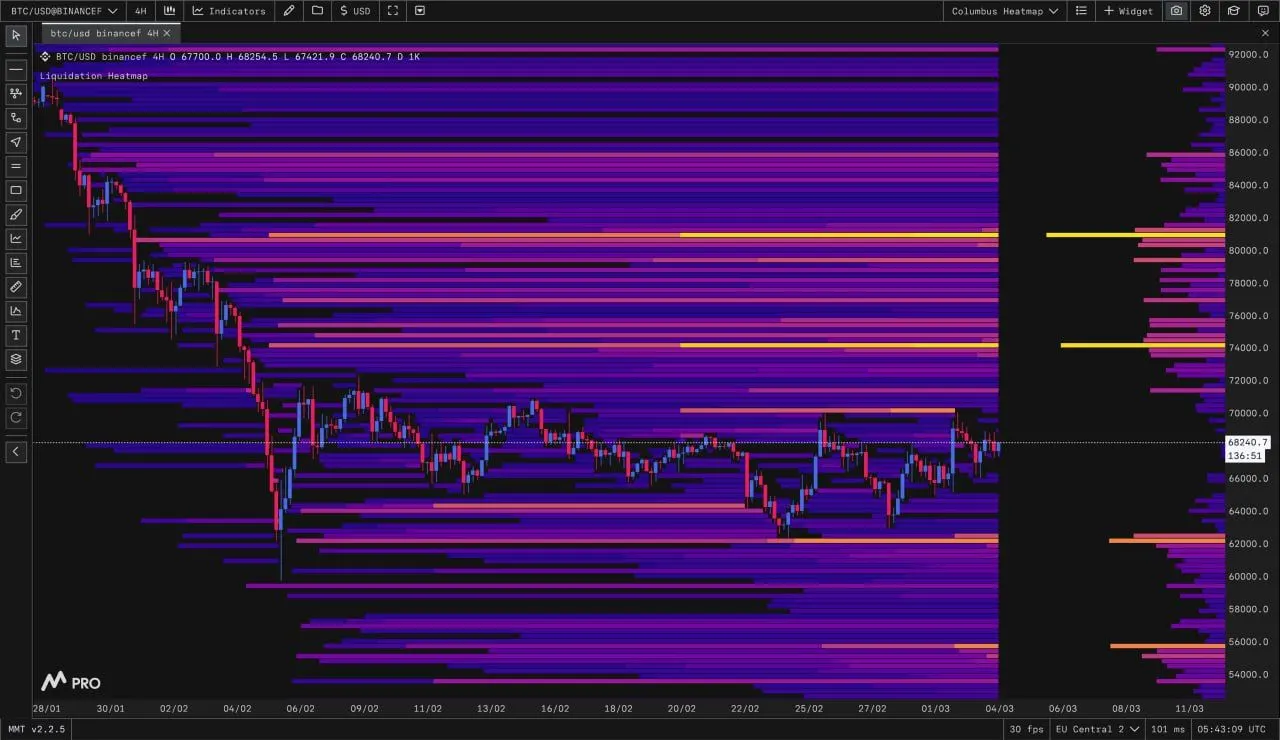
Bitcoin Liquidation Heatmap Range Structure. Source: Columbus
The chart indicates that liquidity remains concentrated near the $69,000 to $70,000 region. These bands appear as brighter zones on the heatmap, suggesting a higher concentration of potential liquidations if price moves upward into that area. According to the analyst’s commentary, this zone could trigger a short squeeze if traders leaning short are forced to close positions.
Meanwhile, the heatmap also shows a developing liquidity pocket near the $62,000 area. That region sits below the mid range where $BTC has been consolidating during recent sessions. If price loses the middle section of the range and momentum shifts lower, the liquidity cluster near $62,000 could act as a potential draw for price.
Recent candles on the chart show Bitcoin moving sideways within the range rather than establishing a directional breakout. Each downward push has met buying activity, while upward attempts have stalled near overhead resistance. As a result, the market continues to compress between the upper liquidity band and the lower pocket.
According to the analyst, the next directional move may emerge once price reaches either liquidity cluster. A move above the upper zone could accelerate momentum through short liquidations, while a drop below the mid range could shift attention toward the lower liquidity pocket.
Bitcoin Daily Chart Shows Breakout and Retest From Triangle Compression
Meanwhile, a daily Bitcoin chart shared by SuperBitcoinBro on X shows $BTC breaking above a tightening triangle and then retesting the former resistance line. The chart marks the sequence as “breakout” and “retest,” with the next move framed as a possible continuation if price holds above the reclaimed trendline.
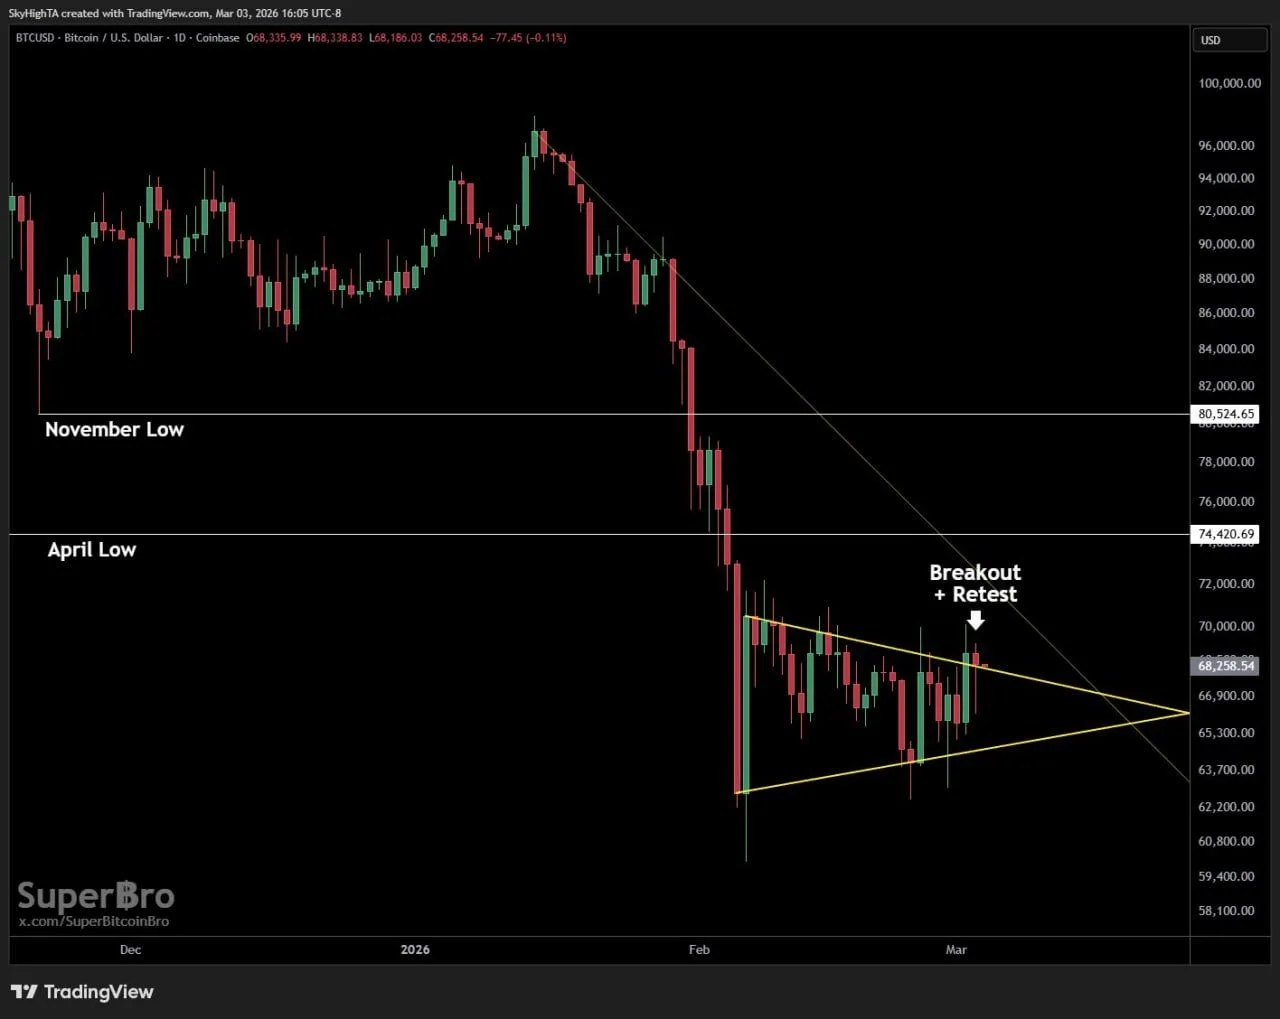
Bitcoin Daily Triangle Breakout and Retest. Source: SuperBitcoinBro
Before the triangle formed, the chart shows a steep selloff that pushed Bitcoin below two labeled reference levels, the November low near $80,524 and the April low near $74,421. After that drop, candles began compressing into a wedge, with lower highs pressing down and higher lows pushing up toward an apex.
The highlighted retest appears after price pushed through the upper boundary of the triangle and then revisited that line. In the same view, the post points to $70,000 as the next level to clear for follow through, while the triangle’s upper trendline now acts as the nearby structure the market is trying to defend.