
Bitcoin price today trades near $67,071, down 2.56% after testing the $60,000 to $62,000 support zone and bouncing back above the 20-day EMA at $68,307. The move places buyers in a defensive position as institutional flows surge despite ongoing global turbulence.
ETF Inflows Hit $458M As Institutions Buy Volatility
U.S. spot bitcoin ETFs recorded $458.2 million in net inflows on March 2, according to SoSoValue data. BlackRock’s IBIT led with $263.2 million, while seven other funds including Fidelity and Grayscale recorded inflows with no funds experiencing outflows.
The return of inflows comes amid heightened global instability and persistent U.S.-Iran tensions following joint U.S. and Israeli strikes. The session marks a continuation of the trend that began last week when ETFs recorded $787 million in weekly inflows, ending five consecutive weeks of negative flows. In January and February combined, the ETFs witnessed over $1.8 billion in net outflows before the reversal.
Related: Ethereum Price Prediction: $38.69M ETF Inflows Fuel Triangle Break Above $2k
The timing of the inflows and heavy concentration in BlackRock’s IBIT suggests coordinated buying among large allocators such as pension funds and endowments. Similar patterns appeared across other crypto ETFs, with Ethereum recording $38.7 million, Solana $17.4 million, and XRP roughly $7 million in inflows.
Daily Chart Shows Support Test At Multi-Month Low
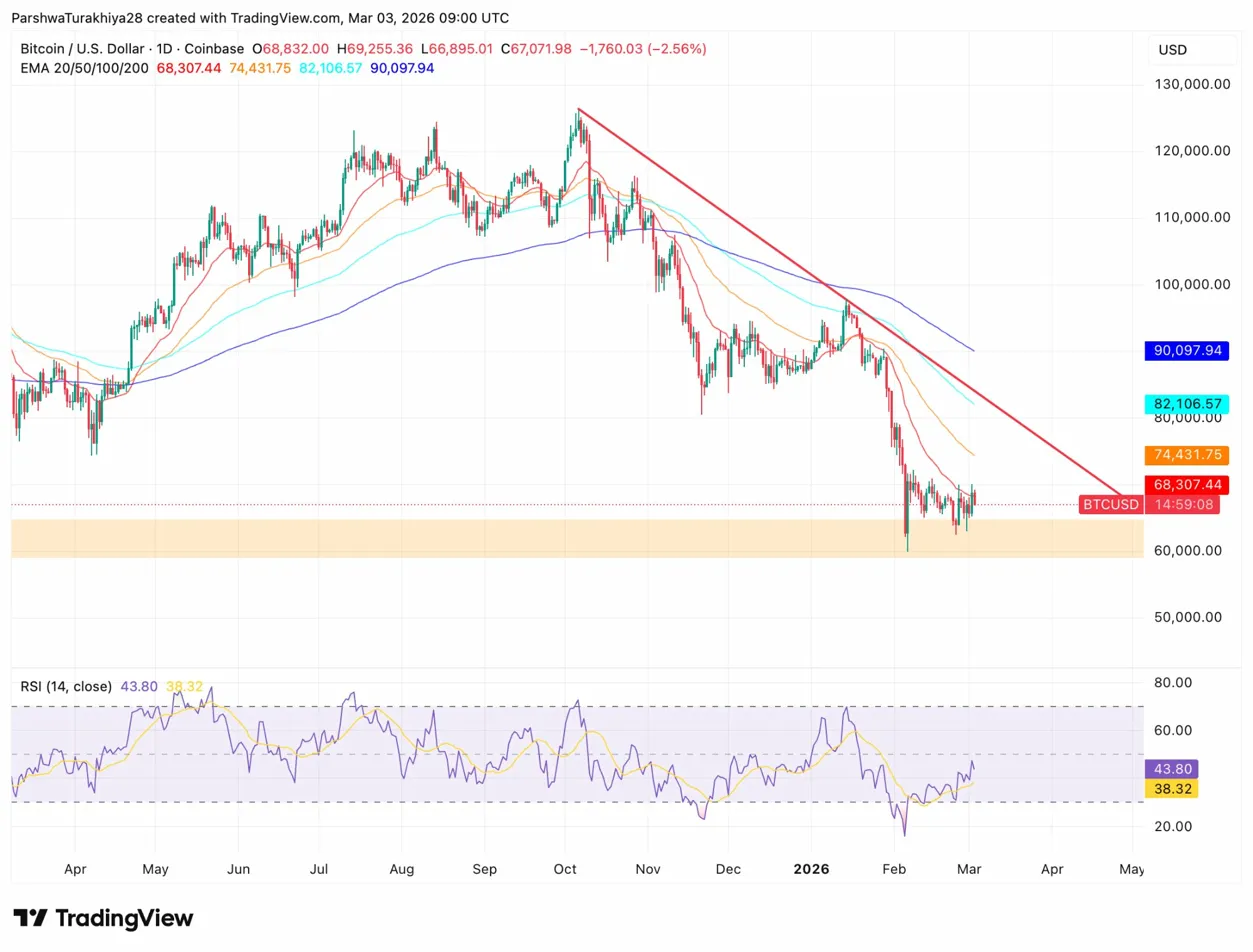
The daily chart shows Bitcoin testing the $60,000 to $62,000 support zone (orange shaded area) before bouncing back above the 20-day EMA at $68,307. The spike low to $60,445 in late February created a long lower wick, suggesting buyers stepped in aggressively at those levels.
All four EMAs remain below recent highs, with the 20-day at $68,307, 50-day at $74,431, 100-day at $82,106, and 200-day at $90,097 forming a descending resistance ladder. A descending trendline (red line) has capped rallies since November 2025 highs near $130,000.
Related: Terra Classic Prediction: LUNC Consolidates After Rally as Traders Eye Breakout
The RSI sits at 43, recovering from oversold levels near 38 but still below the neutral 50 level. When RSI climbs from oversold territory during bounces, it suggests the move has room to extend before hitting resistance.
Key levels:
- Immediate support: $67,000 to $65,000
- Critical floor: $60,000 to $62,000 (orange zone)
- First resistance: $68,307 (20-day EMA)
- Major resistance: $74,431 (50-day EMA)
Bitcoin Nears 20 Million Supply Milestone
According to the Clark Moody Dashboard, 19,996,979 $BTC have been mined, leaving just roughly 3,000 $BTC remaining before the 20 millionth bitcoin is reached, approximately seven days away at current issuance rates. Once that threshold is crossed, more than 95% of the fixed 21 million supply will be in circulation.
Satoshi Nakamoto hard coded the 21 million cap into bitcoin’s protocol to create absolute scarcity, contrasting with fiat currencies that can be expanded by central banks. Bitcoin’s issuance has slowed through halvings, which cut miner rewards roughly every four years, pushing inflation below 1% with about 450 $BTC mined daily.
At the current pace, 99% of bitcoin’s total supply will be mined by January 2035. The final full bitcoin is expected around 2105, with fractional issuance continuing until about 2140. After that, miners will rely entirely on transaction fees.
For supporters, the 20 million milestone reinforces bitcoin’s scarcity narrative as new supply dwindles. The combination of accelerating institutional demand through ETFs and diminishing new supply creates a fundamental setup that historically precedes extended rallies.
Outlook: Will Bitcoin Go Up?
The next move depends on whether Bitcoin can hold the $65,000 to $67,000 zone and reclaim the 20-day EMA at $68,307.
- Bullish case: Bitcoin holds $65,000 and breaks above $68,307 with sustained volume. That reclaims the 20-day EMA and targets the 50-day EMA at $74,431, confirming the ETF-driven recovery continues.
- Bearish case: A daily close below $65,000 exposes the $60,000 to $62,000 support zone. Losing that floor opens the door to $58,500 and the 200-week moving average.
Related: $NEAR Protocol Price Prediction: $NEAR Eyes Short-Term Rally Amid Stabilizing Flows
Disclaimer: The information presented in this article is for informational and educational purposes only. The article does not constitute financial advice or advice of any kind. Coin Edition is not responsible for any losses incurred as a result of the utilization of content, products, or services mentioned. Readers are advised to exercise caution before taking any action related to the company.