Markets are stuck between a corrective downtrend and stretched sentiment, where Bitcoin prezzo reflects both intense fear and signs of a tiring selloff.
Summary
Bitcoin prezzo: fear is in control, but the selloff is getting tired
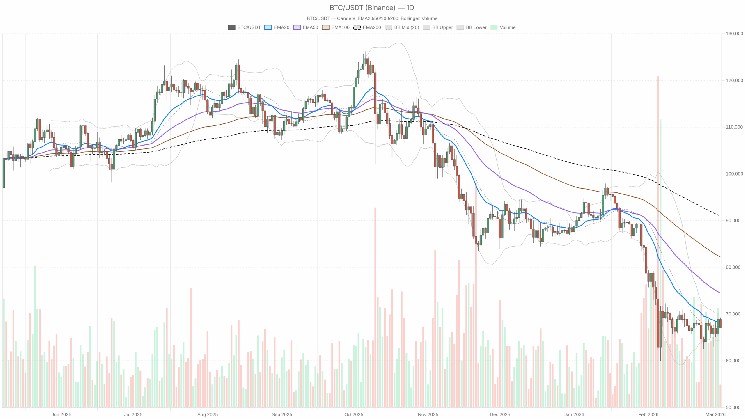
Bitcoin ($BTC) is trading around $67,100, sitting below its short- and medium-term daily moving averages after a difficult run of months. On the higher timeframe, the market is still in a corrective, bearish regime, but the combination of extreme fear (Fear & Greed at 14) and a volatility structure that is no longer accelerating suggests we are closer to the late part of the downtrend than the start.
Right now the dominant force is risk-off positioning: $BTC dominance is high at about 56.5% and total crypto market cap is modestly up on the day. This usually means capital is hiding in Bitcoin and stables while avoiding high-beta altcoins. The question for the next legs is simple: does this correction evolve into a deeper trend break toward the mid–$60Ks and below, or does fear overextend and fuel a sharp mean-reversion rally back toward the low–$70Ks?
On the daily chart the bias is bearish, but the intraday structure is not in free fall. Moreover, hourly and 15-minute timeframes show short-term oversold conditions and fading downside momentum, which opens the door for a corrective bounce inside a broader downtrend.
Daily timeframe (D1): macro bias remains bearish
Trend and EMAs (D1)
– Price: $67,111
– EMA 20: $68,333
– EMA 50: $74,476
– EMA 200: $90,959
– Regime flag: bearish
$BTC is trading below all the major daily EMAs, with a clear downside stacking: price < 20-day < 50-day < 200-day. That is classic downtrend structure. The 20-day EMA is close enough to price to act as an immediate dynamic resistance; the 50-day and 200-day are much higher and currently irrelevant for short-term price, but they remind us how far $BTC has pulled back from prior highs.
What it implies: the main scenario is still bearish. Any bounce toward $68.3K–$70K is, by default, a rally into resistance unless $BTC can reclaim and hold above the 20-day EMA.
RSI 14 (D1): 43.8
Daily RSI is sitting just below the midpoint, in the low 40s. Momentum is negative but not washed out.
What it implies: sellers remain in control on the higher timeframe, but this is not extreme oversold territory. There is room for another leg down if macro or flows deteriorate, yet we are close to the zone where dip buyers usually start to step in more aggressively if the structure stabilizes.
MACD (D1)
– MACD line: -2,307.86
– Signal line: -3,074.18
– Histogram: +766.32
The MACD lines are deeply negative, reflecting the strong prior downside phase, but the histogram is now positive: the MACD line has crossed above its signal line while still below zero.
What it implies: the downtrend on the daily chart is losing momentum. This is typically what you see in late-stage selloffs or early base-building phases: price may still drift lower or move sideways, but the persistent, clean downside impulse is fading. It does not give us a buy signal on its own; it says the worst momentum is likely behind us, unless a new shock hits.
Bollinger Bands (D1)
– Middle band (20 SMA): $67,302
– Upper band: $70,183
– Lower band: $64,421
– Price: $67,111
$BTC is trading very close to the middle band, after spending time below it earlier in the move.
What it implies: volatility is elevated but not explosive, and price has migrated back toward the midline after weakness. That is typical in a consolidation phase inside a broader downtrend. The lower band around $64.4K is the immediate volatility support; repeated tags of that area without follow-through would reinforce a short-term bottoming narrative. A daily close back above the midline and heading toward the upper band would be the first sign of a more constructive mean reversion.
ATR 14 (D1): $2,964
Average daily range is close to $3K.
What it implies: volatility is high enough that 4–5% daily swings are entirely normal here. Position sizing matters: levels can be pierced intraday without necessarily breaking the broader structure. Traders should not overreact to a $1–2K move; it is just one average day of noise in this environment.
Daily pivot levels (D1)
– Pivot point (PP): $67,815
– First resistance (R1): $68,554
– First support (S1): $66,372
Price is currently trading below the daily pivot but above S1.
What it implies: intraday, $BTC is leaning to the bearish side of the daily range, but it has not yet tested the first support. The $66.3K–$66.5K pocket is the first real line in the sand for today’s session; sustained trading below there would open the path toward the lower Bollinger Band near $64.4K.
Hourly timeframe (H1): weak, but not collapsing
On the 1H chart the system labels the regime as neutral, which matches what the indicators are showing: downside pressure, but no clean one-way trend.
Trend and EMAs (H1)
– Price: $67,104
– EMA 20: $68,068
– EMA 50: $67,458
– EMA 200: $66,731
Price is under the 20- and 50-hour EMAs, but the 200-hour is still below price. The short-term averages have rolled over, but the longer intraday trend is not fully broken yet.
What it implies: this is a short-term pullback within a broader intraday range. Sellers have the upper hand on the hourly chart, but until price convincingly loses the 200-hour EMA around $66.7K, it is more of a corrective drift than a new, impulsive breakdown.
RSI 14 (H1): 41.4
Hourly RSI is in bearish territory, but far from oversold.
What it implies: intraday momentum is negative and supports the daily bearish bias, yet there is capacity for both further grinding down and sharp squeeze rallies. It is a “do not chase late” zone rather than a fresh high-conviction short area.
MACD (H1)
– MACD line: +215.42
– Signal line: +449.30
– Histogram: -233.87
The MACD values are slightly positive but the histogram is negative, meaning the MACD line is crossing down under the signal line while both sit above zero.
What it implies: the prior intraday bounce has stalled, and momentum is shifting back to the downside, but the overall hourly trend has not flipped deeply bearish. Think of this as a market that tried to rebound, failed to sustain it, and is now drifting lower rather than cascading.
Bollinger Bands (H1)
– Middle band: $68,460
– Upper band: $70,383
– Lower band: $66,538
– Price: $67,104
Price is trading in the lower half of the band range, closer to the lower band but not hugging it.
What it implies: bears are in control intraday, but volatility is contained. There is no sign yet of a volatility expansion move; instead, the market is bleeding lower within an established envelope.
ATR 14 (H1): $581
The average hourly range is around $580.
What it implies: $400–800 swings on an hourly basis are standard noise here. For execution, it means entries that are too tight to the pivot or recent swing can get shaken out quickly.
Hourly pivot levels (H1)
– Pivot point (PP): $67,497
– R1: $67,919
– S1: $66,682
Price is trading slightly below the hourly pivot and above S1.
What it implies: the market is leaning bearish within today’s intraday structure, but has not yet broken the key $66.7K–$66.8K zone that aligns with both S1 and the 200-hour EMA. That confluence is the immediate short-term battleground.
15-minute timeframe (M15): execution layer, stretched on the downside
On the 15-minute chart, the regime is tagged as neutral, but here the details matter more for timing entries and exits than for bias.
Trend and EMAs (M15)
– Price: $67,107
– EMA 20: $68,013
– EMA 50: $68,241
– EMA 200: $67,428
Price is below all the intraday EMAs, including the 200 on the 15-minute chart.
What it implies: short-term structure is clearly weak; any quick bounce into $67.4K–$68K is, initially, just a retest of broken supports and short-term moving averages. Fast money will be looking to fade those bounces unless higher timeframes start to confirm a reversal.
RSI 14 (M15): 22.3
This is deeply oversold on the very short timeframe.
What it implies: the 15-minute chart is ripe for a bounce or at least a pause. That does not change the daily bias, but it warns that pressing fresh shorts here on the smallest timeframe offers poor immediate reward-to-risk; a squeeze back toward the 20- or 50-EMA on M15 would be entirely normal.
MACD (M15)
– MACD line: -265.53
– Signal line: -192.57
– Histogram: -72.96
Both MACD and signal are below zero, and the histogram is negative.
What it implies: short-term momentum is still to the downside, consistent with the oversold RSI. The market is weak, but because it is already stretched, this is where you often start to see jagged, two-way price action: sharp little rallies inside a broader intraday downtrend.
Bollinger Bands (M15)
– Middle band: $68,041
– Upper band: $68,685
– Lower band: $67,397
– Price: $67,107
$BTC is trading below the lower band on this timeframe.
What it implies: price is extended to the downside on the micro view. That often leads to snap-back moves toward the midline, even if the larger trend is down. It is a poor spot to initiate new aggressive shorts, but not yet a clear reversal area on its own.
ATR 14 (M15): $266
Average 15-minute range is about $266.
What it implies: for scalpers, this is a wide tape; intrabar moves of $150–$300 are routine. Tight stops around obvious levels will be hunted; more thoughtful placement away from the noise is crucial.
Pivot levels (M15)
– Pivot point (PP): $67,181
– R1: $67,287
– S1: $67,001
Price is slightly below the 15-minute pivot and hovering near S1.
What it implies: the very short-term tape is leaning bearish but trying to stabilize near the first support. It is exactly the kind of area where you expect either a minor intraday bounce or an acceleration if S1 breaks on volume.
Sentiment and broader market context
The crypto-wide Fear & Greed Index sits at 14 (Extreme Fear). $BTC dominance around 56.5% alongside a modestly rising total market cap points to capital rotating into Bitcoin and stables while the market de-risks elsewhere.
What it implies: fear is real, but it is already heavily priced in. Historically, extreme fear readings during a corrective phase often precede strong relief rallies, though they do not pinpoint timing. As long as dominance stays elevated and altcoins underperform, Bitcoin remains the relative safe asset within crypto, even if its own price is under pressure.
Scenarios for Bitcoin prezzo: where do we go from here?
Main bias from D1: bearish, but late-stage and vulnerable to a squeeze.
There is a clear tension across timeframes:
- Daily chart: downtrend structure, negative but easing momentum.
- Hourly chart: neutral-to-bearish drift, no capitulation.
- 15-minute chart: oversold and stretched, due for a bounce.
That mix usually resolves either into a relief rally inside a downtrend or a final flush that resets the shorter timeframes before a more meaningful reversal.
Bullish scenario (countertrend, then potentially more)
In the bullish path, the current oversold intraday setup turns into a rebound that gains traction on higher timeframes.
Key steps for this scenario:
1. Short-term stabilization above $66.5K
The $66.3K–$66.8K zone is critical: it combines daily S1, hourly S1, and the H1 200 EMA. Holding above this area and putting in higher lows on the 15-minute and hourly charts would signal sellers are losing control intraday.
2. Reclaim of intraday moving averages
Price needs to retake the 15-minute 200 EMA near $67.4K and then the 20- and 50-hour EMAs around $67.5K–$68.1K. That would turn the current bleed into a short-term trend reversal.
3. Break back above the daily pivot and 20-day EMA
A daily close above the pivot at $67.8K and, more importantly, above the 20-day EMA near $68.3K would be the first serious sign that the correction is maturing. From there, a move toward the upper daily Bollinger Band and the $70K–$71K region becomes realistic.
4. Extension toward $72K–$74K
If momentum improves and volume expands on the way up, the next logical magnet would be the prior supply area in the low–$70Ks, with the 50-day EMA at $74.5K as a stretch target for a full mean-reversion swing.
What invalidates the bullish scenario?
A clean break and daily close below $64.4K (the lower daily Bollinger Band) would strongly argue that the market is not ready to base yet. That would put the focus back on lower supports and delay any sustained upside for weeks, not days.
Bearish scenario (trend continuation, potentially one more leg down)
In the bearish path, the daily downtrend re-asserts itself, and the short-term oversold conditions on the 15-minute chart are worked off via a shallow bounce that fails quickly.
Key steps for this scenario:
1. Failure to reclaim $68K
If every small rally gets sold before $BTC can regain the hourly EMAs and the daily pivot, it signals strong supply overhead. Repeated rejections around $67.5K–$68.0K would confirm this.
2. Break of $66.5K and $66.3K supports
Losing the $66.7K 200-hour EMA and the clustered S1 levels would open the door to a test of the daily lower band around $64.4K. In that move, 15-minute oversold conditions could persist as price grinds lower.
3. Daily close near or below the lower Bollinger Band ($64.4K)
A decisive daily candle closing at or beneath the lower band would mark a volatility expansion to the downside, likely driven by renewed fear, liquidations, or macro headlines. From there, traders would start discussing deeper retracement zones below $60K.
4. Momentum rollover on D1 indicators
If the MACD histogram on D1 turns back down toward zero or negative while RSI sinks into the 30s, it would confirm that the early signs of momentum easing were a false dawn and that the trend is accelerating again.
What invalidates the bearish scenario?
A sustained move and daily close above $70K, accompanied by rising volume and a firm MACD histogram on the daily chart, would severely weaken the bearish narrative. In that case, the recent leg would be better framed as a correction in a larger bull market, with the path of least resistance shifting back upward.
Positioning, risk, and how to think about Bitcoin prezzo here
This is a tricky part of the cycle. The daily chart says downtrend, the intraday chart says tired but not reversed, and sentiment says everyone is scared. Those conditions often deliver sharp, counterintuitive moves in both directions.
A few practical takeaways for traders analyzing Bitcoin prezzo in this environment:
- Respect the daily downtrend. Unless and until $BTC can reclaim the 20-day EMA and hold it, rallies are guilty until proven innocent. That argues against blindly buying every dip.
- Do not ignore extreme fear. With sentiment this depressed and the daily MACD starting to turn, the risk of a violent short-covering rally is real. Shorts added late into intraday oversold conditions can be painful.
- Size for volatility. With a ~$3K daily ATR and $500+ hourly ranges, levels will be overshot routinely. If your positioning cannot tolerate a few thousand dollars of noise against you, your sizing is probably too large for this tape.
- Use confluence, not single signals. The more alignment you see between key supports (pivot levels, EMAs, Bollinger Bands) across timeframes, the more meaningful the area. Right now, $66.3K–$66.8K is one such zone on the downside; $68K–$70K is shaping up as the equivalent on the upside.
Overall, $BTC is in a corrective downtrend dominated by fear, but the internal momentum picture is no longer one-sided. For traders, this is a phase to stay nimble, respect both tails, and let the levels, not emotions, dictate whether the next big move is a breakdown or a squeeze higher.