
Bitcoin is trading at $63,922 on Feb. 28, 2026, at 8 a.m. EST, clinging to the mid-$60,000s after a bruising February drawdown. The narrative grew considerably more fraught as hostilities in the Middle East began commanding international attention. For now, bitcoin’s broader structure remains heavy, and the charts across multiple timeframes suggest that rallies continue to face stiff overhead pressure.
Bitcoin Slips Toward Key Support Amid U.S., Israel Strikes on Iran
To start the weekend, the globe collectively dropped its coffee as the U.S.–Iran feud hit the fan in spectacular fashion, with America and Israel teaming up for a coordinated air-and-missile bash on Iran—complete with boom-filled skies over Tehran and other cities. Apparently, the missions have been aimed at Iran’s military components and top brass in what some scribes have dubbed “Operation Lion’s Roar” or “Operation Epic Fury.”
Iran fired back with volleys of missiles and drones at Israel and U.S. bases across the Middle East, while airspace slammed shut and airlines worldwide threw up their hands, canceling or rerouting flights faster than you can say “geopolitical headache.” The fireworks arrived after weeks of nuclear talks going absolutely nowhere, and following the latest debacle, bitcoin—threw a fit, tanking hard as everyone suddenly remembered they hate risk and adore cash and gold bullion under mattresses.
Bitcoin Chart Outlook
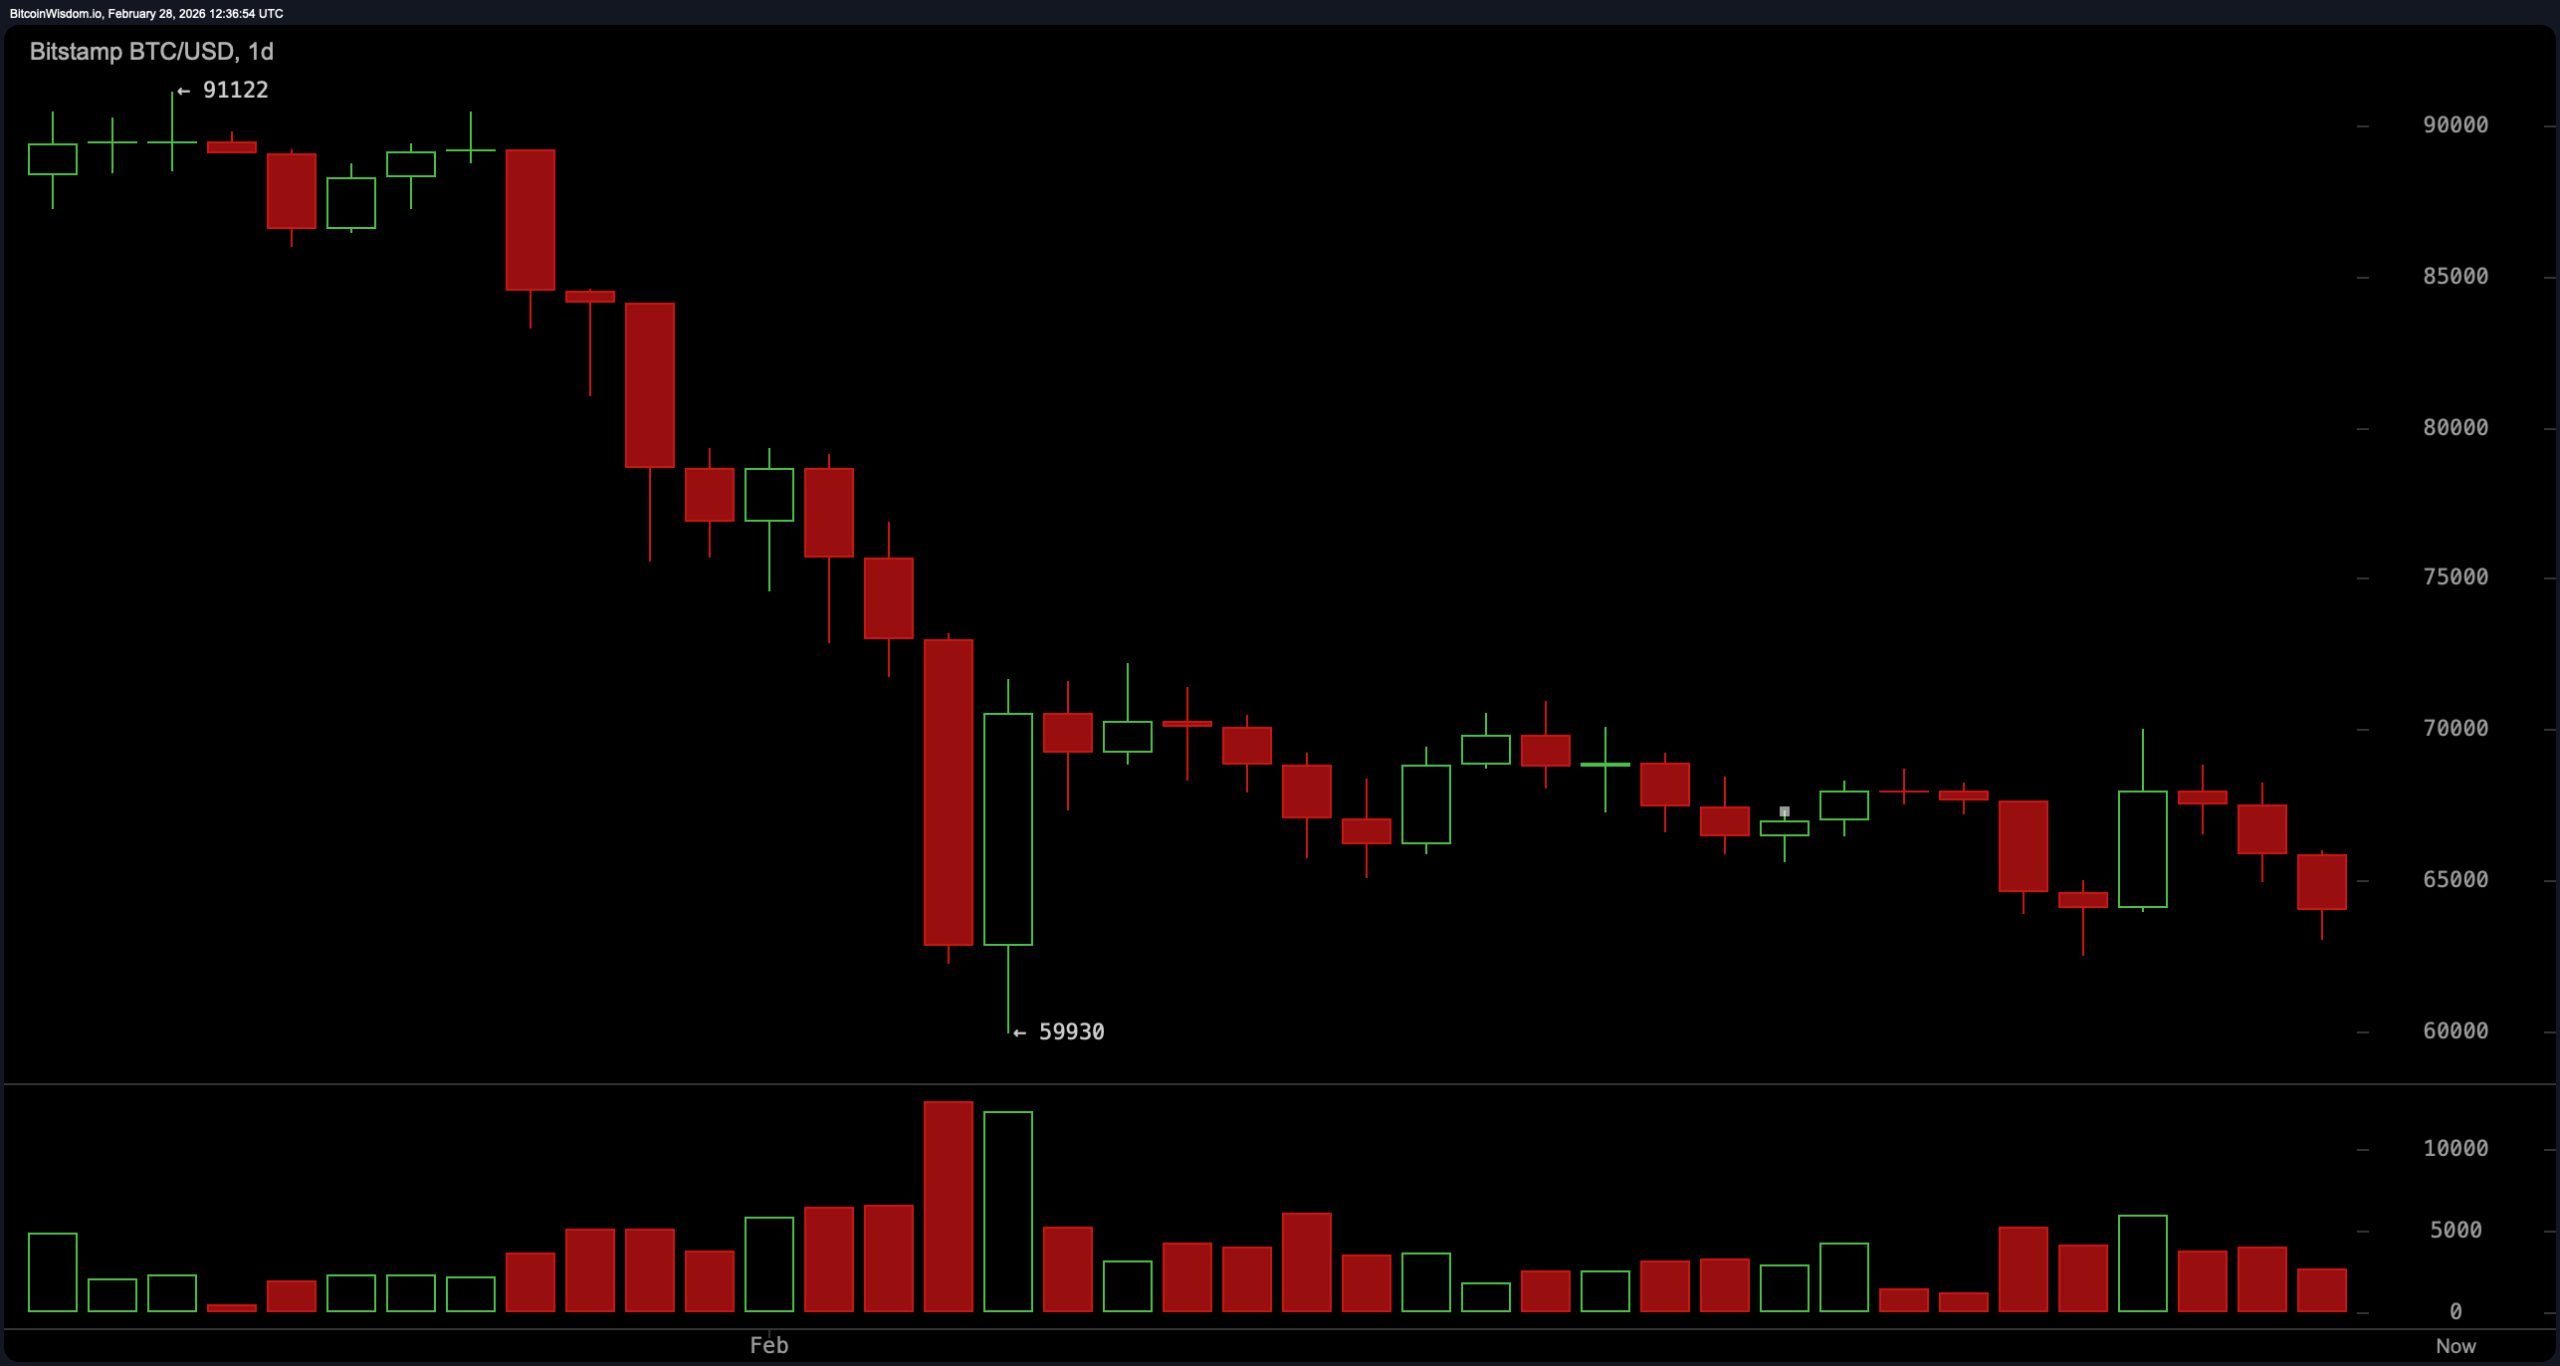
The daily chart paints a clear macro picture: Bitcoin has fallen from a February high near $91,122 to a low around $59,930, marking roughly a 29% decline during the month. Price action continues to form lower highs beneath the $70,000 region, with consolidation between $64,000 and $70,000 reflecting distribution rather than accumulation. Major resistance sits at $69,500 to $70,000, with additional overhead supply near $75,000, while critical support remains at $59,900 to $60,000. Until that $70,000 ceiling is convincingly reclaimed on a daily closing basis, the broader trend structure favors continuation of the corrective phase.
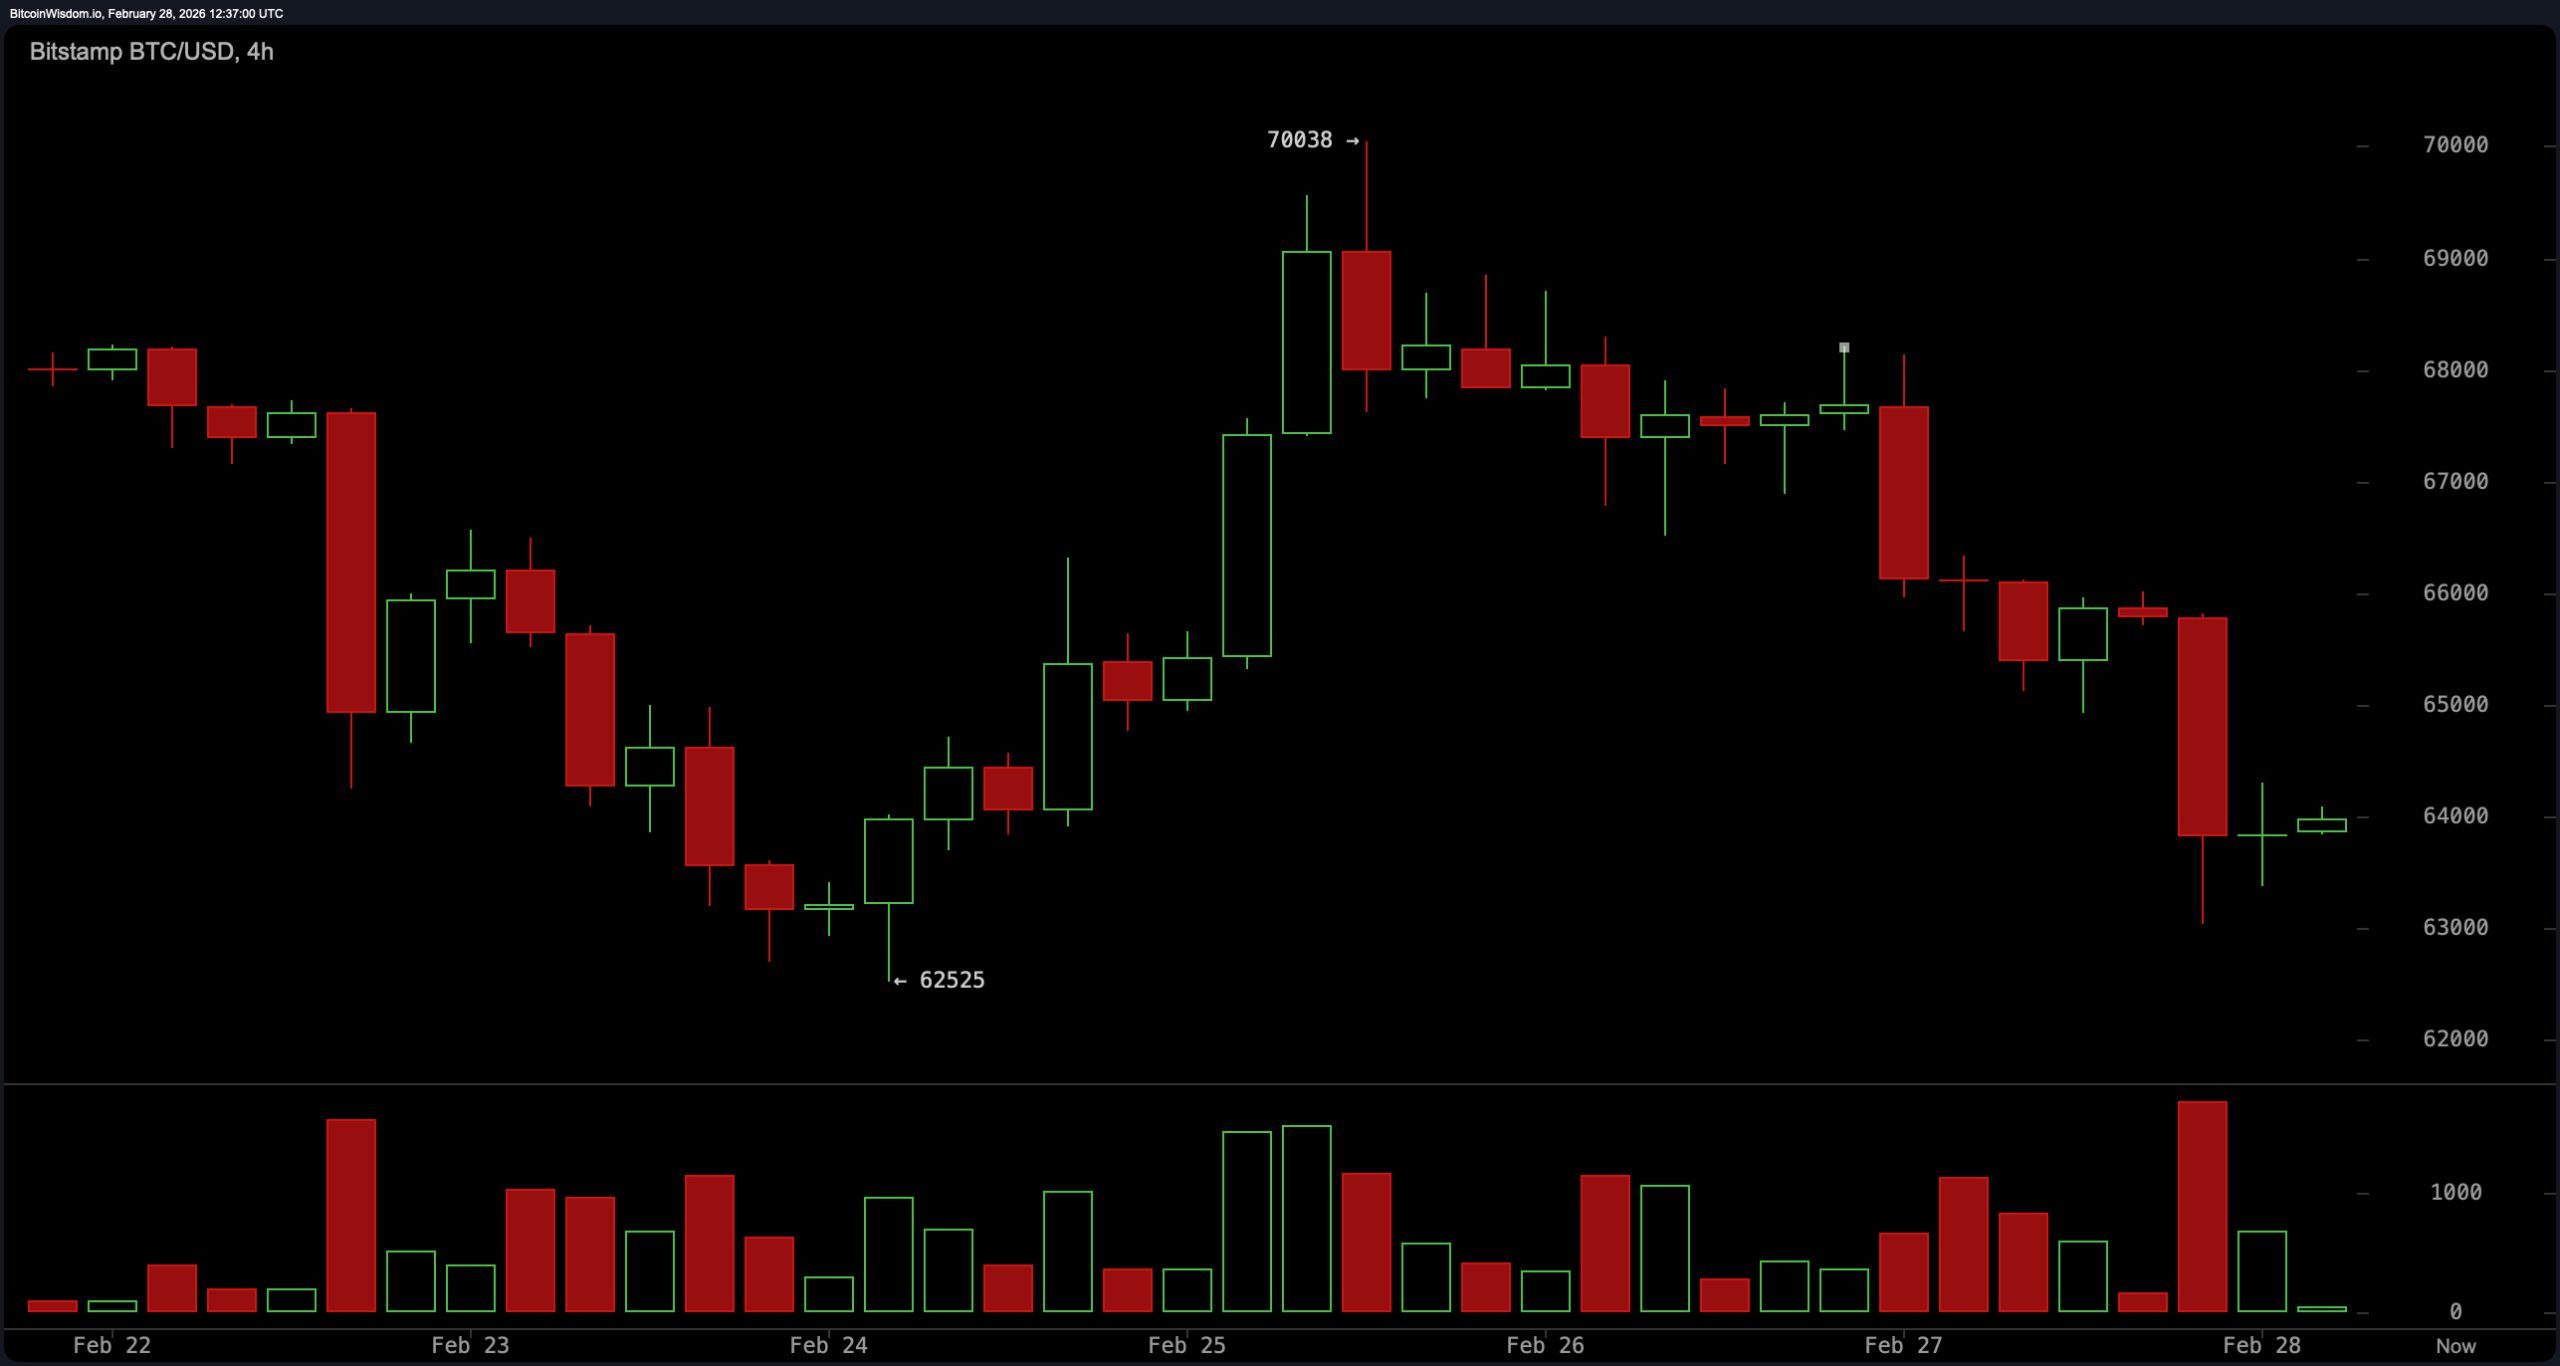
On bitcoin’s four-hour timeframe, the failed breakout to $70,038 earlier in the week established a decisive lower high. The subsequent breakdown toward $62,525 confirmed renewed downside momentum, accompanied by expanding volume on red candles. Current resistance is concentrated between $67,800 and $68,500, while support rests in the $63,000 to $63,500 zone, with a breakdown trigger below $62,500. Structurally, bounces appear corrective rather than impulsive, reinforcing the prevailing bearish swing bias unless price can sustain strength above $70,000.
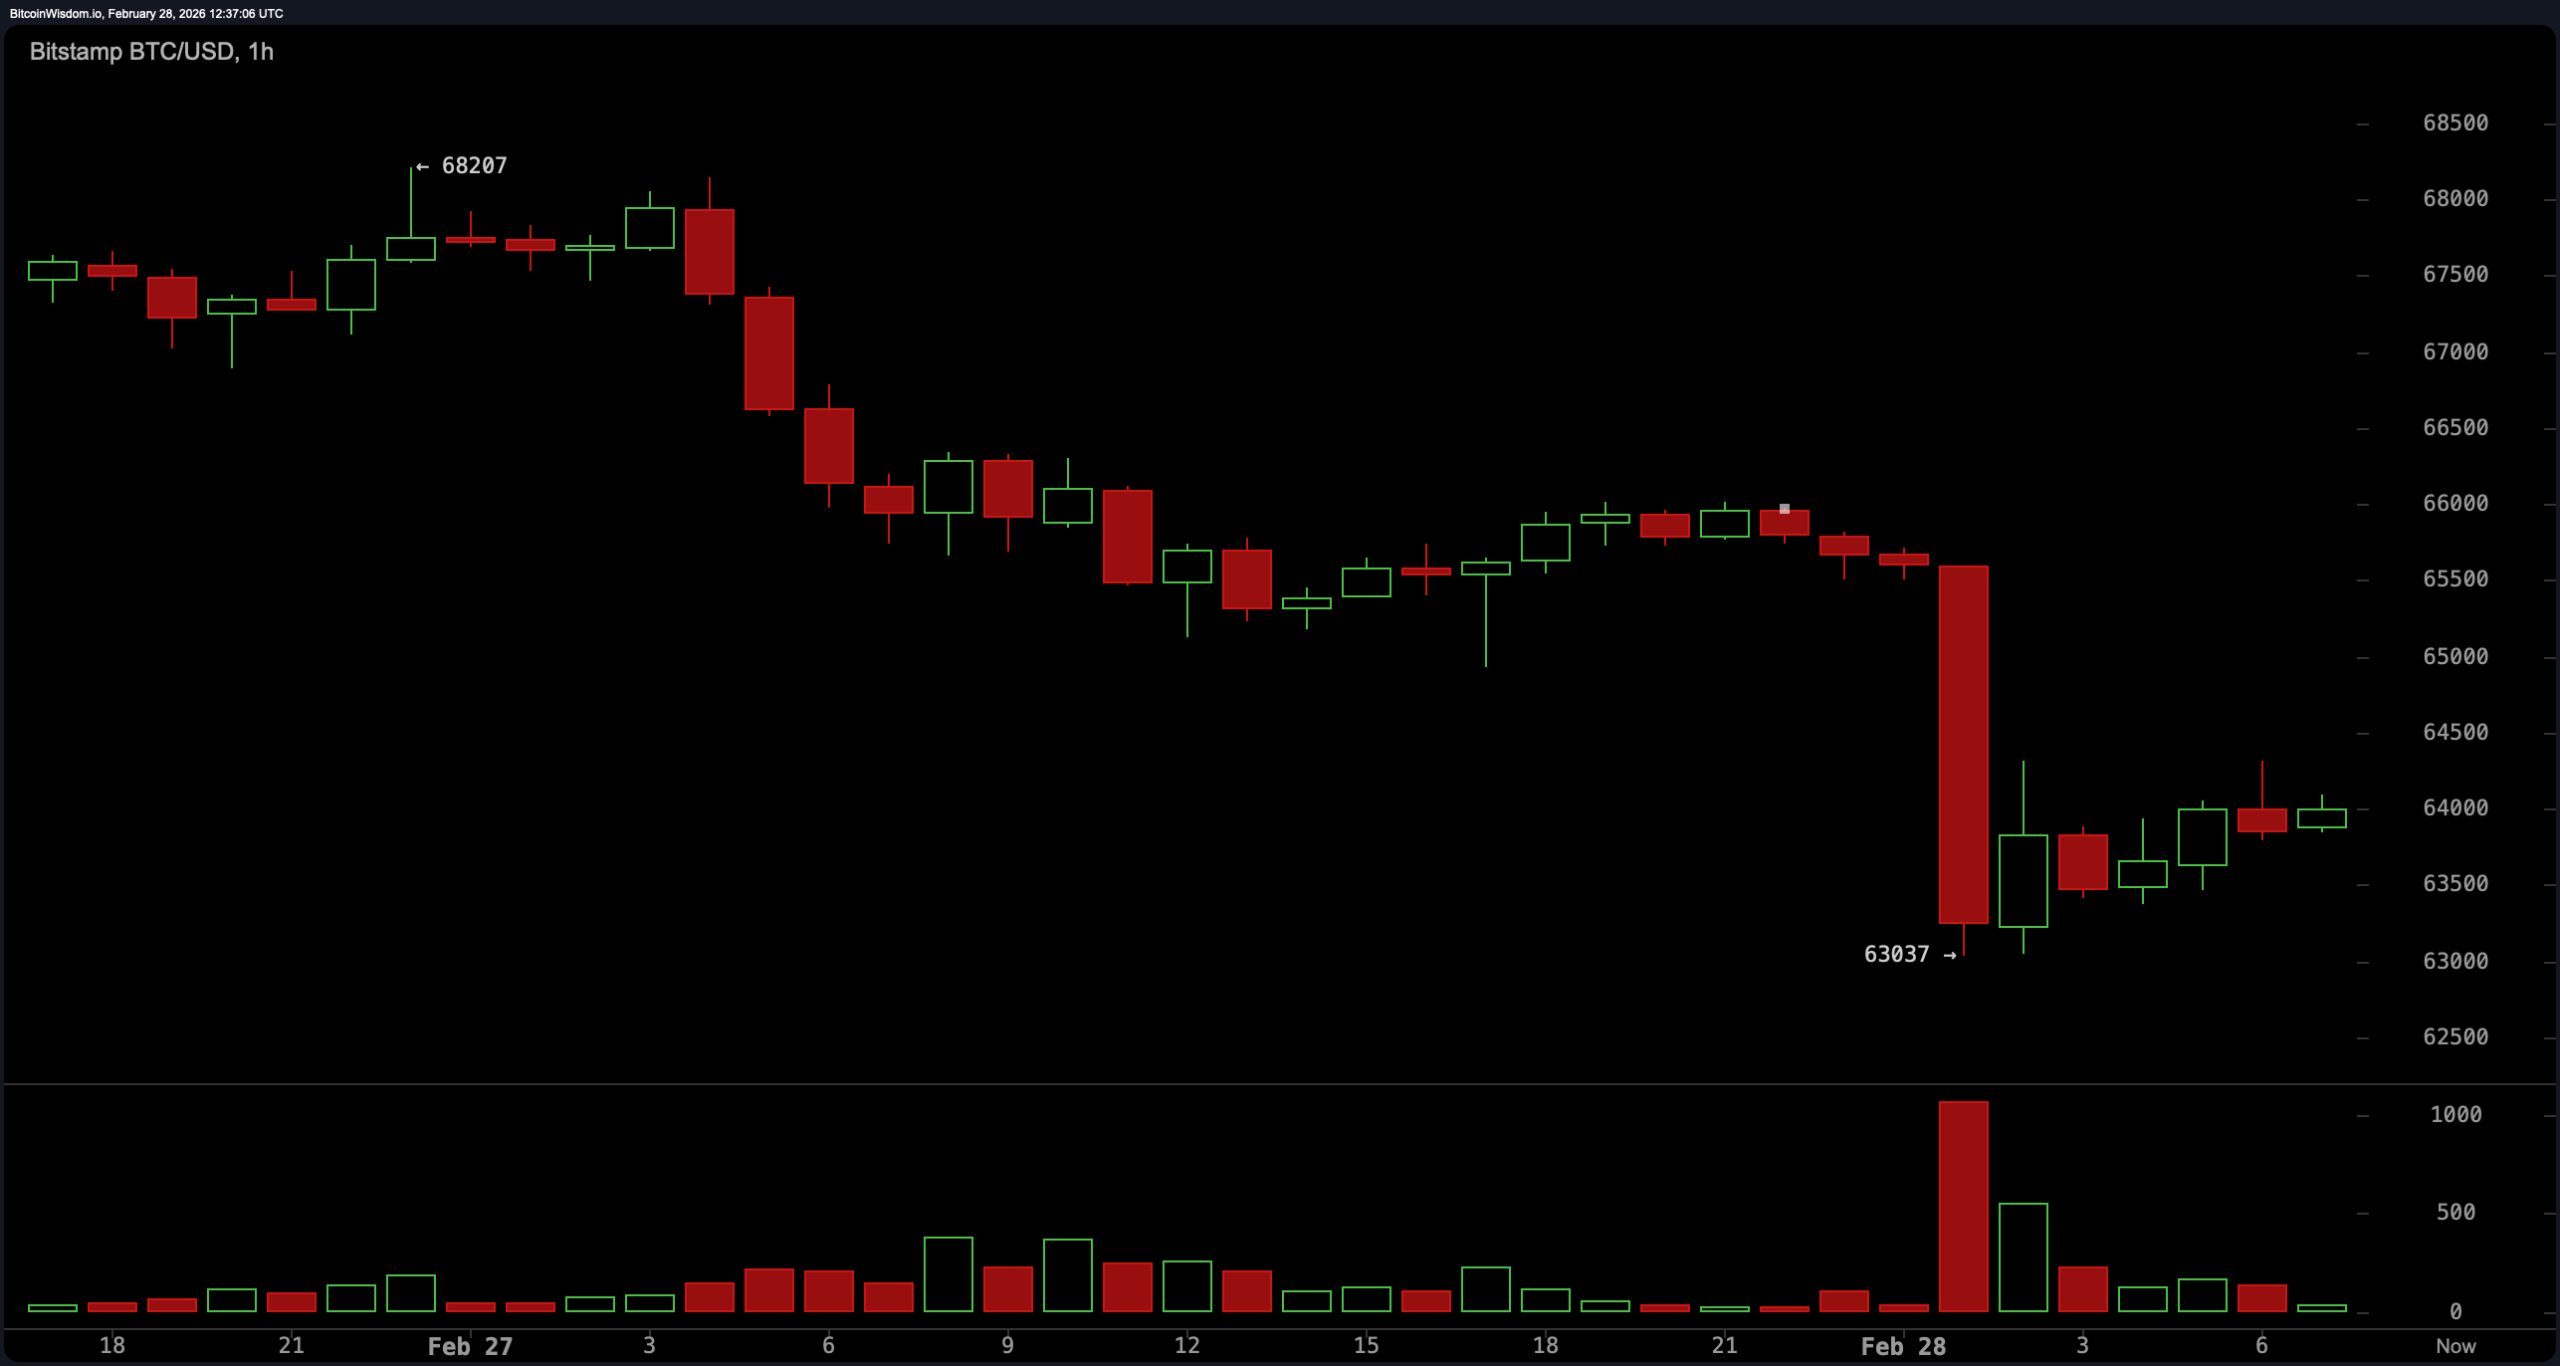
Zooming into the one-hour chart, bitcoin recorded a sharp intraday drop to $63,037, marked by a pronounced volume spike that signaled capitulation-style activity. Intraday resistance is clustered between $65,500 and $66,000, with support at $63,000 and a key trigger at $62,800. The pattern of lower highs persists on this timeframe as well, suggesting that relief rallies are encountering supply quickly. In other words, momentum remains fragile; every bounce must prove itself rather than being assumed durable.
Oscillators are mixed but lean cautious. The relative strength index ( RSI) prints 35, indicating neutral but near-oversold conditions. The Stochastic oscillator stands at 39, also neutral, while the commodity channel index (CCI) reads negative 170, still categorized as neutral in the data set. The average directional index (ADX) at 52 reflects a strong prevailing trend, and the Awesome oscillator shows a negative 5,892, signaling downside momentum.
Momentum registers negative 2,423 with a negative signal, whereas the moving average convergence divergence ( MACD) level sits at negative 3,164 with a positive signal. That divergence between momentum and MACD is noteworthy, but it does not yet override the broader structural weakness.
Moving averages reinforce the dominant downtrend. The exponential moving average (EMA) (10) is at $66,395, and the simple moving average (SMA) (10) at $66,457, both positioned above the current price. The EMA (20) at $68,391 and SMA (20) at $67,344 remain overhead, followed by the EMA (30) at $70,862 and SMA (30) at $69,557.
Higher-period readings show the EMA (50) at $75,234, SMA (50) at $78,145, EMA (100) at $82,969, SMA (100) at $83,710, EMA (200) at $90,766, and SMA (200) at $97,355. With price trading beneath every key EMA and SMA, the trend hierarchy is unmistakably tilted downward. Until bitcoin can reclaim multiple short- and medium-term averages, the burden of proof rests squarely on the bulls — and the charts, for now, are not feeling generous.
Bull Verdict:
Bitcoin must reclaim and sustain a daily close above $70,000, clearing layered resistance between $69,500 and $70,000 while invalidating the pattern of lower highs established throughout February. A decisive move through that ceiling — followed by follow-through beyond $75,000 — would begin to neutralize the broader corrective structure and shift momentum dynamics in favor of a more constructive medium-term trend.
Bear Verdict:
As long as bitcoin remains pinned below $70,000 and continues trading beneath all major exponential moving averages (EMA) and simple moving averages (SMA), the prevailing structure favors further downside pressure. A breakdown below $62,500 would expose $60,000 as the critical line in the sand, and a sustained loss of that level would open the path toward deeper retracement, reinforcing the dominant bearish trend hierarchy.
FAQ 🔎
- Why is bitcoin falling amid the U.S.–Iran conflict?Escalating U.S. and Iran military strikes triggered a global risk-off move, pressuring bitcoin below key resistance near $70,000.
- What are bitcoin’s key support levels right now?Immediate support sits near $63,000, with major structural support at $60,000.
- How did the U.S.–Iran strikes impact global markets?Airspace closures, missile exchanges, and geopolitical uncertainty drove volatility across equities, commodities and cryptocurrencies.
- What would signal stabilization in bitcoin’s price?A sustained daily close above $70,000 would indicate improving momentum despite ongoing Middle East tensions.