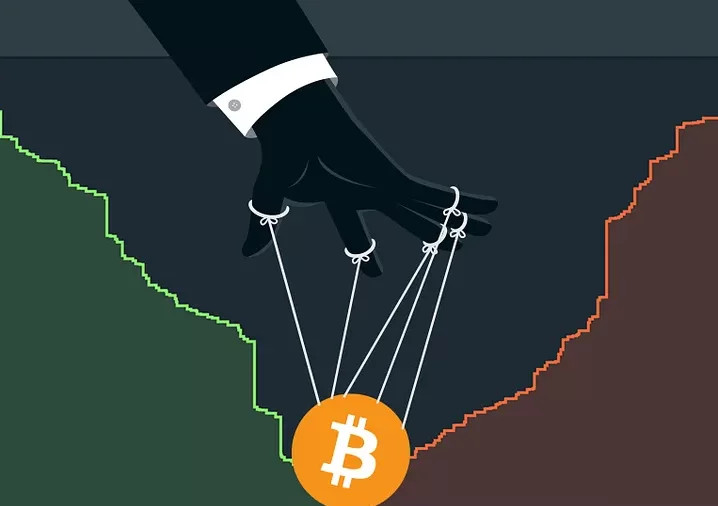
A double bottom is interpreted as a classic bullish chart pattern that signals a potential trend reversal after a downtrend. The first bottom is usually seen at the end of a downtrend, after which prices begin to rise. However, a second drop then occurs, forming a second bottom. The second bottom usually occurs near or slightly above the level of the first bottom.
A double bottom formation signals that prices are about to reverse from a downtrend to an uptrend.
At this point, the focus will be on whether Bitcoin can hold above $65,000 and form a double bottom pattern.
Alex Kuptsikevich said that Bitcoin could experience further declines if it fails to hold above $65,000.
“The inability of Bitcoin to maintain this level and for a recovery not to occur would signal the end of the small rebound and create the potential for a 25% drop.”
In conclusion, Kuptsikevich went beyond debating whether there would be an interim relief in Bitcoin, stating that Bitcoin and the market have not yet reached their bottom and that the real collapse is yet to come.
*This is not investment advice.

 en.bitcoinsistemi.com