
-
Bitcoin rises 3% to $64,892 ahead of key US jobless claims economic data release tomorrow.
-
Rising jobless claims could increase rate cut expectations, supporting Bitcoin’s bullish price momentum outlook.
-
Technical indicators show Bitcoin must break $70,500 resistance to confirm stronger bullish trend ahead.
Bitcoin price today has seen a strong recovery, climbing nearly 3% to around $65,106 after falling to $62,553. This recovery comes just ahead of the upcoming U.S. Initial Jobless Claims report, a key U.S economic indicator that has recently impacted crypto market momentum.
Previous data shows Bitcoin often rises after jobless claims, and now experts are watching the key $70,000 level.
Bitcoin Price Recovers Ahead of Jobless Claims Data
The latest recovery in bitcoin price suggests traders are positioning ahead of the next U.S. labor market report, which could shape expectations around Federal Reserve interest rate policy.
Last week on 19th Feb, Initial Jobless Claims came in at 206,000, lower than market expectations. Following the release, Bitcoin surged nearly 2.7%, reaching a high of $67,518, showing a clear connection between labor data and crypto market sentiment.
This pattern has repeated several times this month, where Bitcoin has reacted positively after jobless claims releases.
The recent bounce shows growing optimism before the February 26 jobless claims report, which is expected to come in around 216,000.
Why US Jobless Claims Could Trigger Bitcoin’s Next Rally
Jobless claims are a key indicator of economic strength. Rising jobless claims suggest weakening labor market conditions, which could increase the chance of Federal Reserve interest rate cuts.
Lower interest rates generally improve liquidity across financial markets, making risk assets like Bitcoin more attractive to investors.
As a result, weaker jobless data often supports Bitcoin’s price, while stronger labor data can reduce expectations of rate cuts and limit upside momentum.
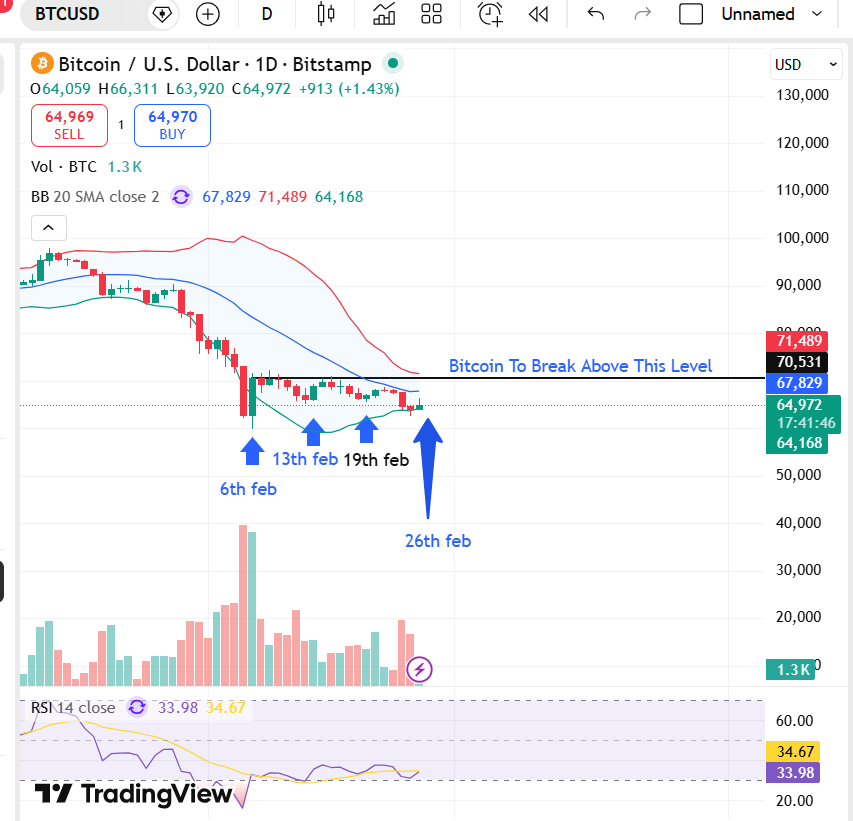
Bitcoin Faces Critical Resistance Near $70K
Looking at the daily Bitcoin price chart, BTC has tested the support many times this month in the $62,000–$64,000 range, including on February 6, 13, and 19. Each time, buyers stepped in, showing strong interest at lower prices.
But it has always failed to break above the $67,875 resistance level so far.
If Bitcoin breaks above this level, it could move up to test the next resistance near $70,531. A clear breakout above $70,500 may lead to a stronger upward move toward higher price levels.
Meanwhile, the RSI is near 34, which shows Bitcoin is slowly recovering from oversold levels.