
- The Bitcoin price correction is less than 4% away from retesting the $62,200 support for bearish breakdown.
- Binance’s 90-day Buying Power Ratio has dropped to -0.086, marking its lowest level in over a year.
- With today sell-off, the crypto market witnessed total liquidations of $620.55 million
The Bitcoin price plunged over 5.3% during Monday’s market hours to trade around the $64,000 mark. A primary reason for this sell-off was macro uncertainty as the U.S. president Donald Trump announced a global tariff increase from 10% to 15%. The falling $BTC price has now reached lower bounds to its recent trading range, signalling another breakdown ahead. However, the latest on-chain data signals a compressed buying power window that suggests an exhausted trend, which could lead to potential sideways or upswing drive.
Bitcoin Liquidity on Binance Drops to Extreme Levels
On Binance, the world’s top crypto trading platform, one of the key on-chain liquidity gauges has hit an unusual level. The 90-day Buying Power Ratio — the ratio of the net flow of stablecoins available for purchase to the amount of Bitcoin withdrawn from the exchange — now reads at -0.086.
This negative number means that over the last three months, more capital has been leaving $BTC than fresh deposits of the stablecoin, leaving less of this immediate capital available to support buying activity. The reading is the weakest in more than a year’s time.
A similar dynamic was to be seen between July and August 2024. Back in this period, the ratio was -0.094 as Bitcoin was fluctuating around the $54,000 – $68,000 range during a period of fluctuating confidence. In the following months, there were significant price moves upwards with a price of $102,000 in December.
The shorter timeframes show the recent turbulence. Around mid February, the 7-day ratio took a plunge to -0.90 exhibiting sharp concentrated selling and withdrawal pressure. Yet the 30-day version bounced back quickly from -0.164 to near zero in just days.
This rapid recovery in the intermediate window, against a backdrop of a persistently low 90-day figure, is consistent with patterns that we frequently observe at points of selling exhaustion, rather than fresh downward movement.
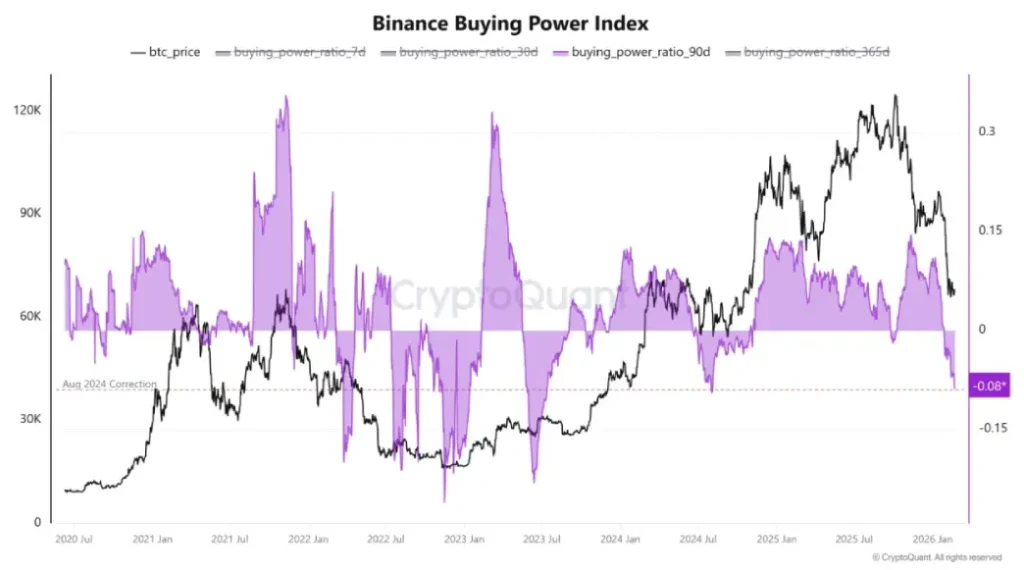
Looking even further out, the 365-day ratio is still slightly positive at +0.038. That longer-term balance suggests that the overall relationship between stablecoin arrivals and $BTC movements on the platform have remained structurally intact, which in turn suggests that the current dip is the result of temporary conditions, not some fundamental change in participant behavior or permanent capital exit.
Bitcoin Price Correction May Hit $50,000 If Buyers Lose This Support
Over the past two weeks, the Bitcoin price has been wavering around the $68,000 mark, with no stability for either direction. These swings with low trading volume reflected uncertainty among traders, but created a firm range formation between the $73,000 and $62,200.
With today’s sell-off, the coin price is accelerating towards the asset’s bottom support, signaling a potential breakdown ahead. The momentum indicator ADX at 57% accentuates the intense selling pressure but also the over extended downtrend in price that also signals exhaustion.
If the buyers lose this support, $BTC could plunge to $55,000 cushion, followed by an extended dip to $50,000 floor.
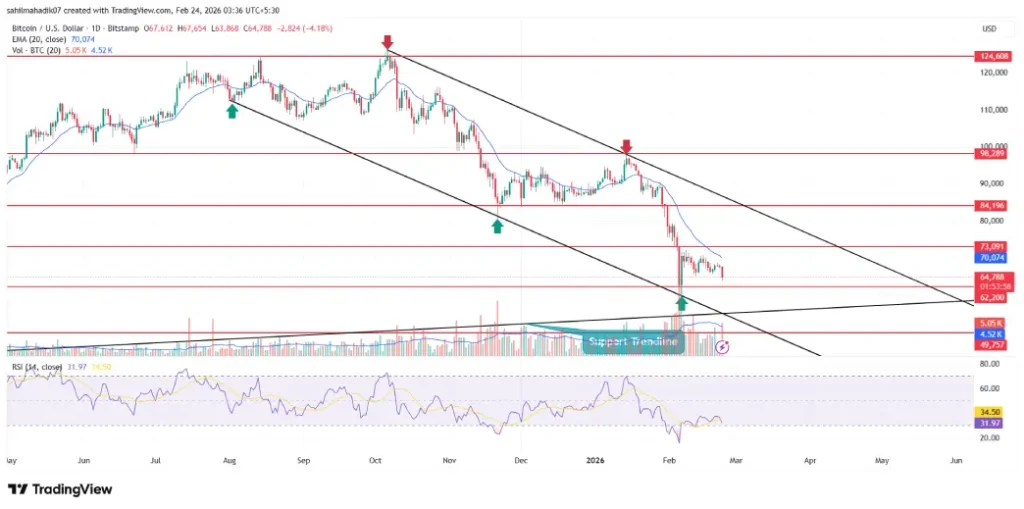
The daily chart analysis highlights the current downtrend in Bitcoin price is carried by a falling channel pattern as shown in above chart.