
Bitcoin price today trades near $63,191, down another 0.08% as sellers push the token toward its fifth consecutive monthly decline. The move places Bitcoin on track for its worst month since June 2022, when the collapse of TerraUSD triggered failures across Three Arrows Capital and BlockFi.
ETF Outflows Hit $203M As Institutions Reduce Exposure
Bitcoin spot ETFs recorded $203.82 million in net outflows on February 23, according to SoSoValue data. The exodus marks one of the largest single-session redemptions in weeks and extends a pattern of sustained institutional selling that has defined February.
Fidelity’s FBTC led the exit with $27.93 million in redemptions, while Grayscale’s GBTC shed another $13 million. Only VanEck’s HODL managed to post inflows, adding $6.35 million, but that capital was overwhelmed by selling from larger funds.
Tariff Uncertainty Drives Broader Risk-Off Sentiment
The selloff accelerated after President Trump announced plans to raise global tariffs to 15%, unsettling investors and triggering a rotation out of risk assets. Bitcoin moved in lockstep with equities, confirming it continues to trade as a risk asset rather than a safe haven during macro uncertainty.
Bloomberg reported that Bitcoin is now down more than 19% in February, set for its worst monthly performance since June 2022. The current losing streak also marks the fifth straight month of declines, the longest such stretch since 2018.
Supertrend Confirms Bearish Structure Below $65,500
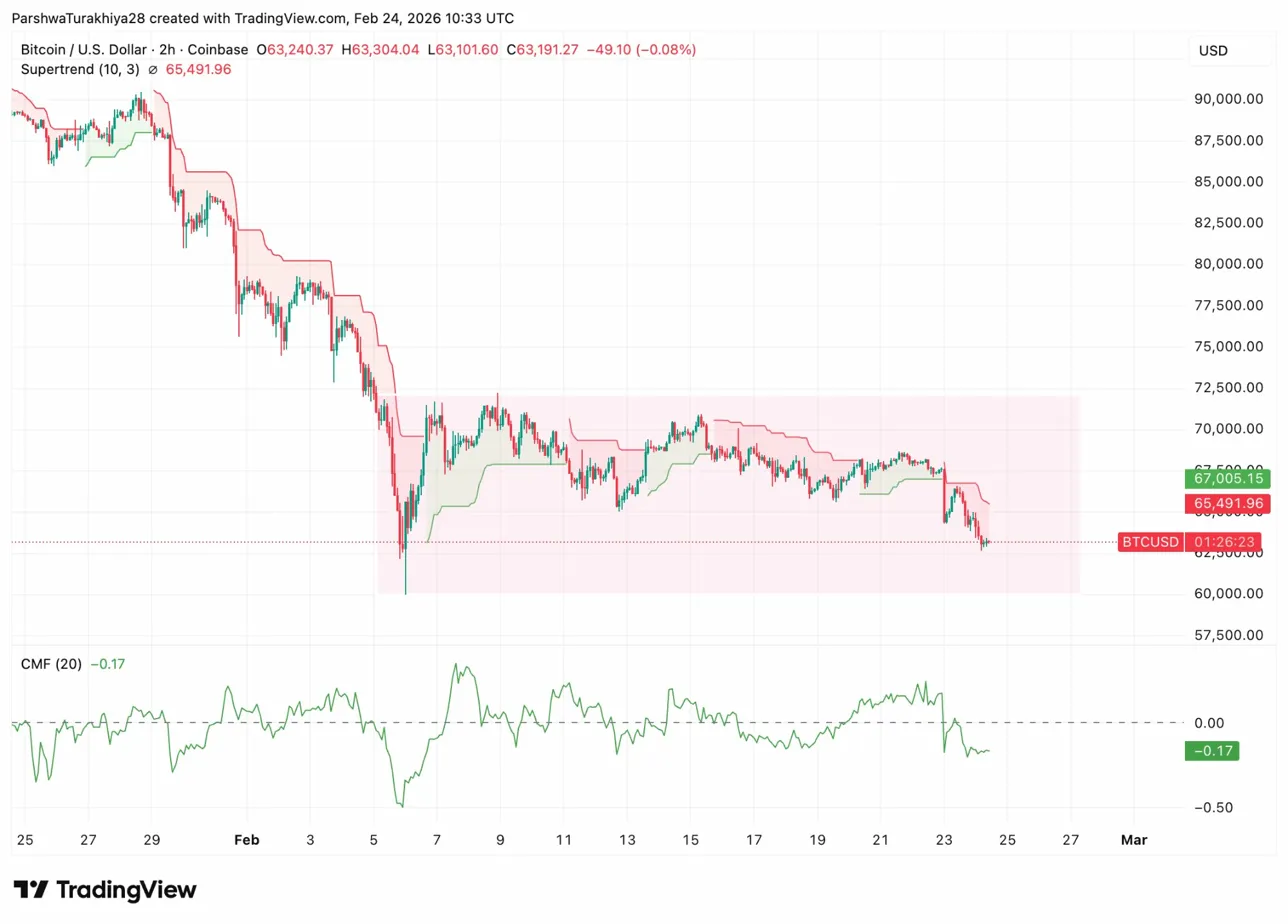
Bitcoin price today sits below the Supertrend level at $65,491, a line that has acted as resistance since the most recent flip. The 2-hour chart shows Bitcoin trapped in a descending range, with sellers defending every attempt to reclaim higher ground.
The token broke below the $67,000 to $68,000 support shelf that held for nearly two weeks, opening the door to the current leg lower. Price is now testing the $63,000 to $62,000 demand zone, a level that has historically acted as a pivot during corrections.
Key levels now:
- Immediate support: $63,000 to $62,000
- Critical floor: $60,000 psychological level
- Major demand zone: $58,500 (200-week moving average)
- First resistance: $65,491 (Supertrend)
- Major resistance: $67,000 to $68,000
The Chaikin Money Flow indicator on the 2-hour chart sits at negative 0.17, confirming distribution as selling pressure outweighs buying interest. When CMF stays negative during breakdowns, it signals that capital is leaving the asset rather than accumulating on dips.
According to analysts at IG Australia, Bitcoin is edging closer to its 200-week moving average at $58,503. Whether the token holds above that level could determine whether prices stabilize or enter a deeper correction phase.
Outlook: Will Bitcoin Go Up?
The next move depends on whether Bitcoin can hold the $60,000 to $62,000 zone and prevent a test of the 200-week moving average.
- Bullish case: Bitcoin defends $60,000 and closes above $65,500 with rising volume. That flips the Supertrend and signals the first step toward reversing the five-month decline.
- Bearish case: A daily close below $60,000 exposes the 200-week moving average at $58,500. Losing that level opens the door to $55,000 and potentially $50,000.
Disclaimer: The information presented in this article is for informational and educational purposes only. The article does not constitute financial advice or advice of any kind. Coin Edition is not responsible for any losses incurred as a result of the utilization of content, products, or services mentioned. Readers are advised to exercise caution before taking any action related to the company.