
- The Bitcoin price exits the short term consolidation trend with a bearish breakdown from the inverted pennant pattern.
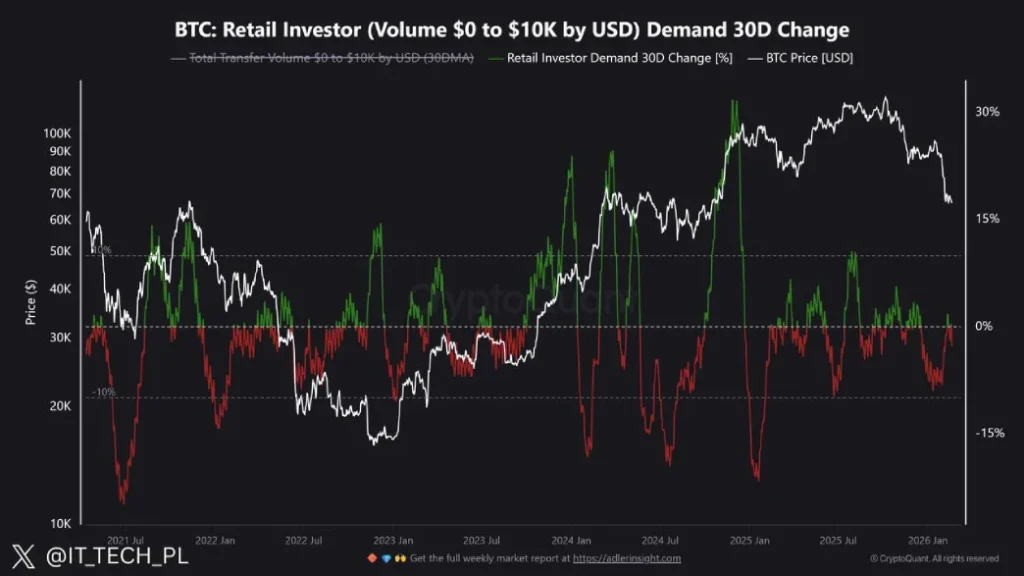
- The 30-day change in retail demand has fallen to levels last seen during the 2022 bear market and the mid-2024 correction.
- The momentum indicator RSI at 48% hints the short-term trend remains neutral amid current market uncertainty.
Bitcoin, the largest cryptocurrency by market capitalization witnessed a slight uptick of 0.82% to reclaim position above $67,000. The uptick came as a relief rally after a notable correction earlier this week, triggered due to geopolitical tension and macroeconomic uncertainty. While the broader trend remains bearish, the on-chain data shows a sharp decline in retail investor activity and widespread capitulation.
$BTC Sees Weak Retail Flows While Institutional ETF Capital Remains Strong
Recent on-chain metrics suggest there has been a large pullout from Bitcoin by participants of smaller scales, that is, the participants who usually execute Bitcoin transfers valued between $0 and $10,000. Activity within this bracket has shrunk considerably, with the 30-day change in retail-oriented demand eyeing the same depths as the 2022 downturn and the significant pullback observed in mid-2024.
Over the past four months, the Bitcoin price witnessed a significant correction from $126,272 to current trading value of $67,217., registering a loss of 46%. Volume linked this correction witnessed a continuation decline, suggesting a minimal fresh capital or position building from everyday users. Similar stretches of low involvement in the past were associated with Bitcoin hanging around $15,000-$20,000 in the long-running bear phase of 2022 and $25,000 in the correction.
This continuous disconnection with retail flows continues in the face of wider market volatility, as there is no apparent immediate return to small wallet participation in the data. Such patterns have historically served longer consolidation phases before any appreciable change in general sentiment takes place.
Similarly, Bitcoin exchange traded funds (ETFs) record a substantial drop in overall capital commitment, as the aggregate net additions dropped to $53 billion today, from the October 2025 peak of $63 billion. This adjustment represents an erosion of about $8 billion during a roughly 45% loss in the value of the asset from its record above $126,000.
Over the course of about two years since their introduction, however, these vehicles have managed to rack up an impressive $53 billion in sustained net entries, well above initial projections that ran in the ranges of $5 billion to $15 billion for the debut year alone – even those seen as optimistic given industry consensus.
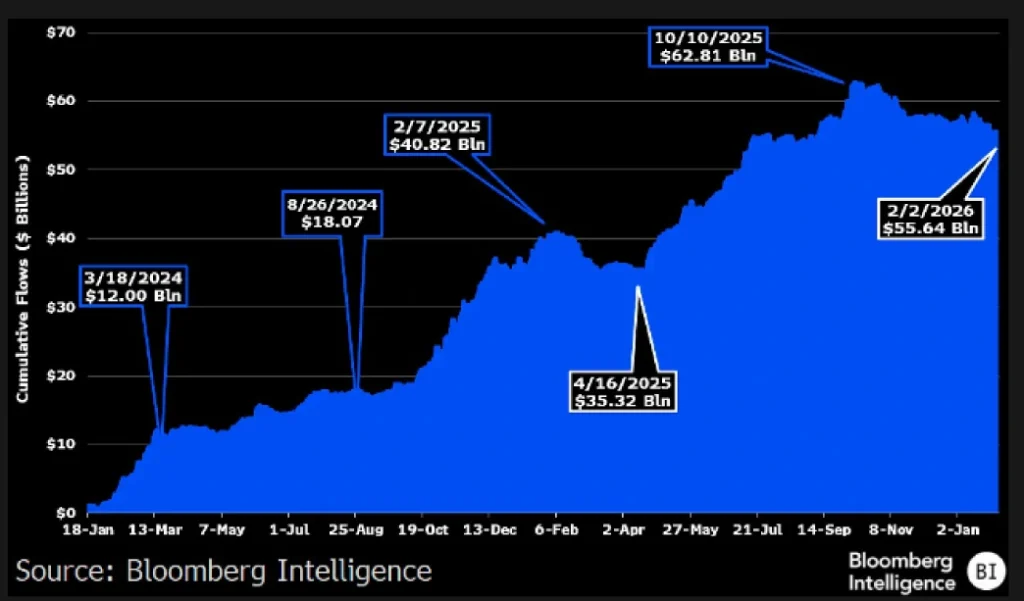
Amidst the ongoing fluctuation of the market, Bitcoin hovers near $67,000, highlighting a generally positive connection of traditional financial channels despite the latest dip in the movement of funds. Such patterns reflect wider trends of institutional engagement where there are periodic removals that don’t fully compensate for past buildups.
Bitcoin Price Breakdown From Pennant Pattern Signals a Drop to $55k
Since last week, the Bitcoin price has witnessed a notable correction from $70,939 to $67,370 amid the broader market uncertainty. Amid this downswing, the coin price gave a bearish breakdown from the support trendline of inverted pennant pattern from 4-hours time frame chart.
Typically, this chart pattern displays a long downsloping slope denoting the dominating downtrend, followed by a short consolidation within two converging trendlines to recuperate the exhausted bearish momentum.
The recent breakdown signals the renewed selling pressure in the market, positioning the asset for prolonged downfall. If the breakdown sustains, $BTC could plunge 8% down to $62,000, followed by $55,000.
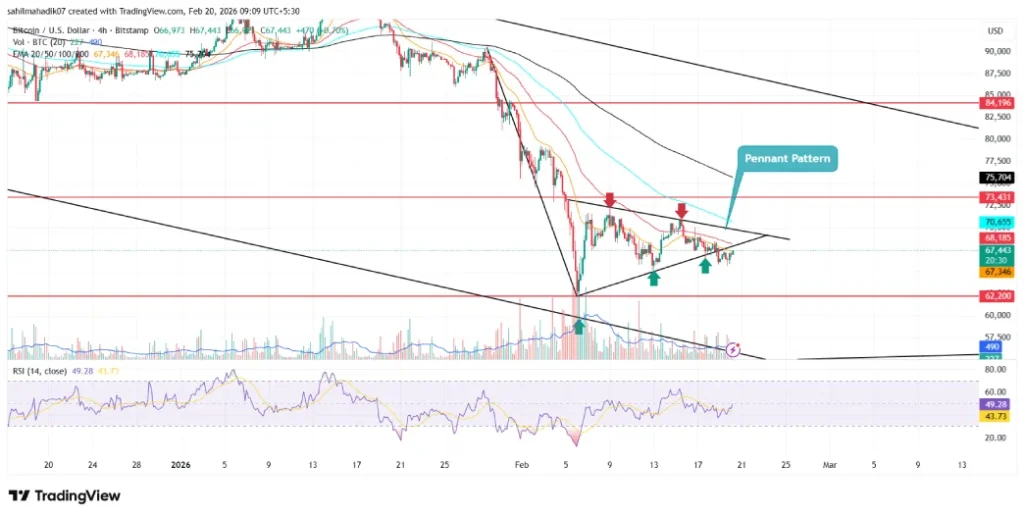
However, the coin price shows a short retest to the breached trendline and validates its sustainability for a lower price. If buyers reenter the pennant triangle, the previous breakdown would fail and drive a recovery attempt above $70,000.
Also Read: Robinhood Chain Logs 4M Testnet Transactions in First Week, CEO Confirms