
Bitcoin is treading water near $66,604, caught between recovery attempts and structural hesitation. The market is stabilizing, not surging, and the charts across every major timeframe are signaling patience over bravado.
Bitcoin Chart Outlook
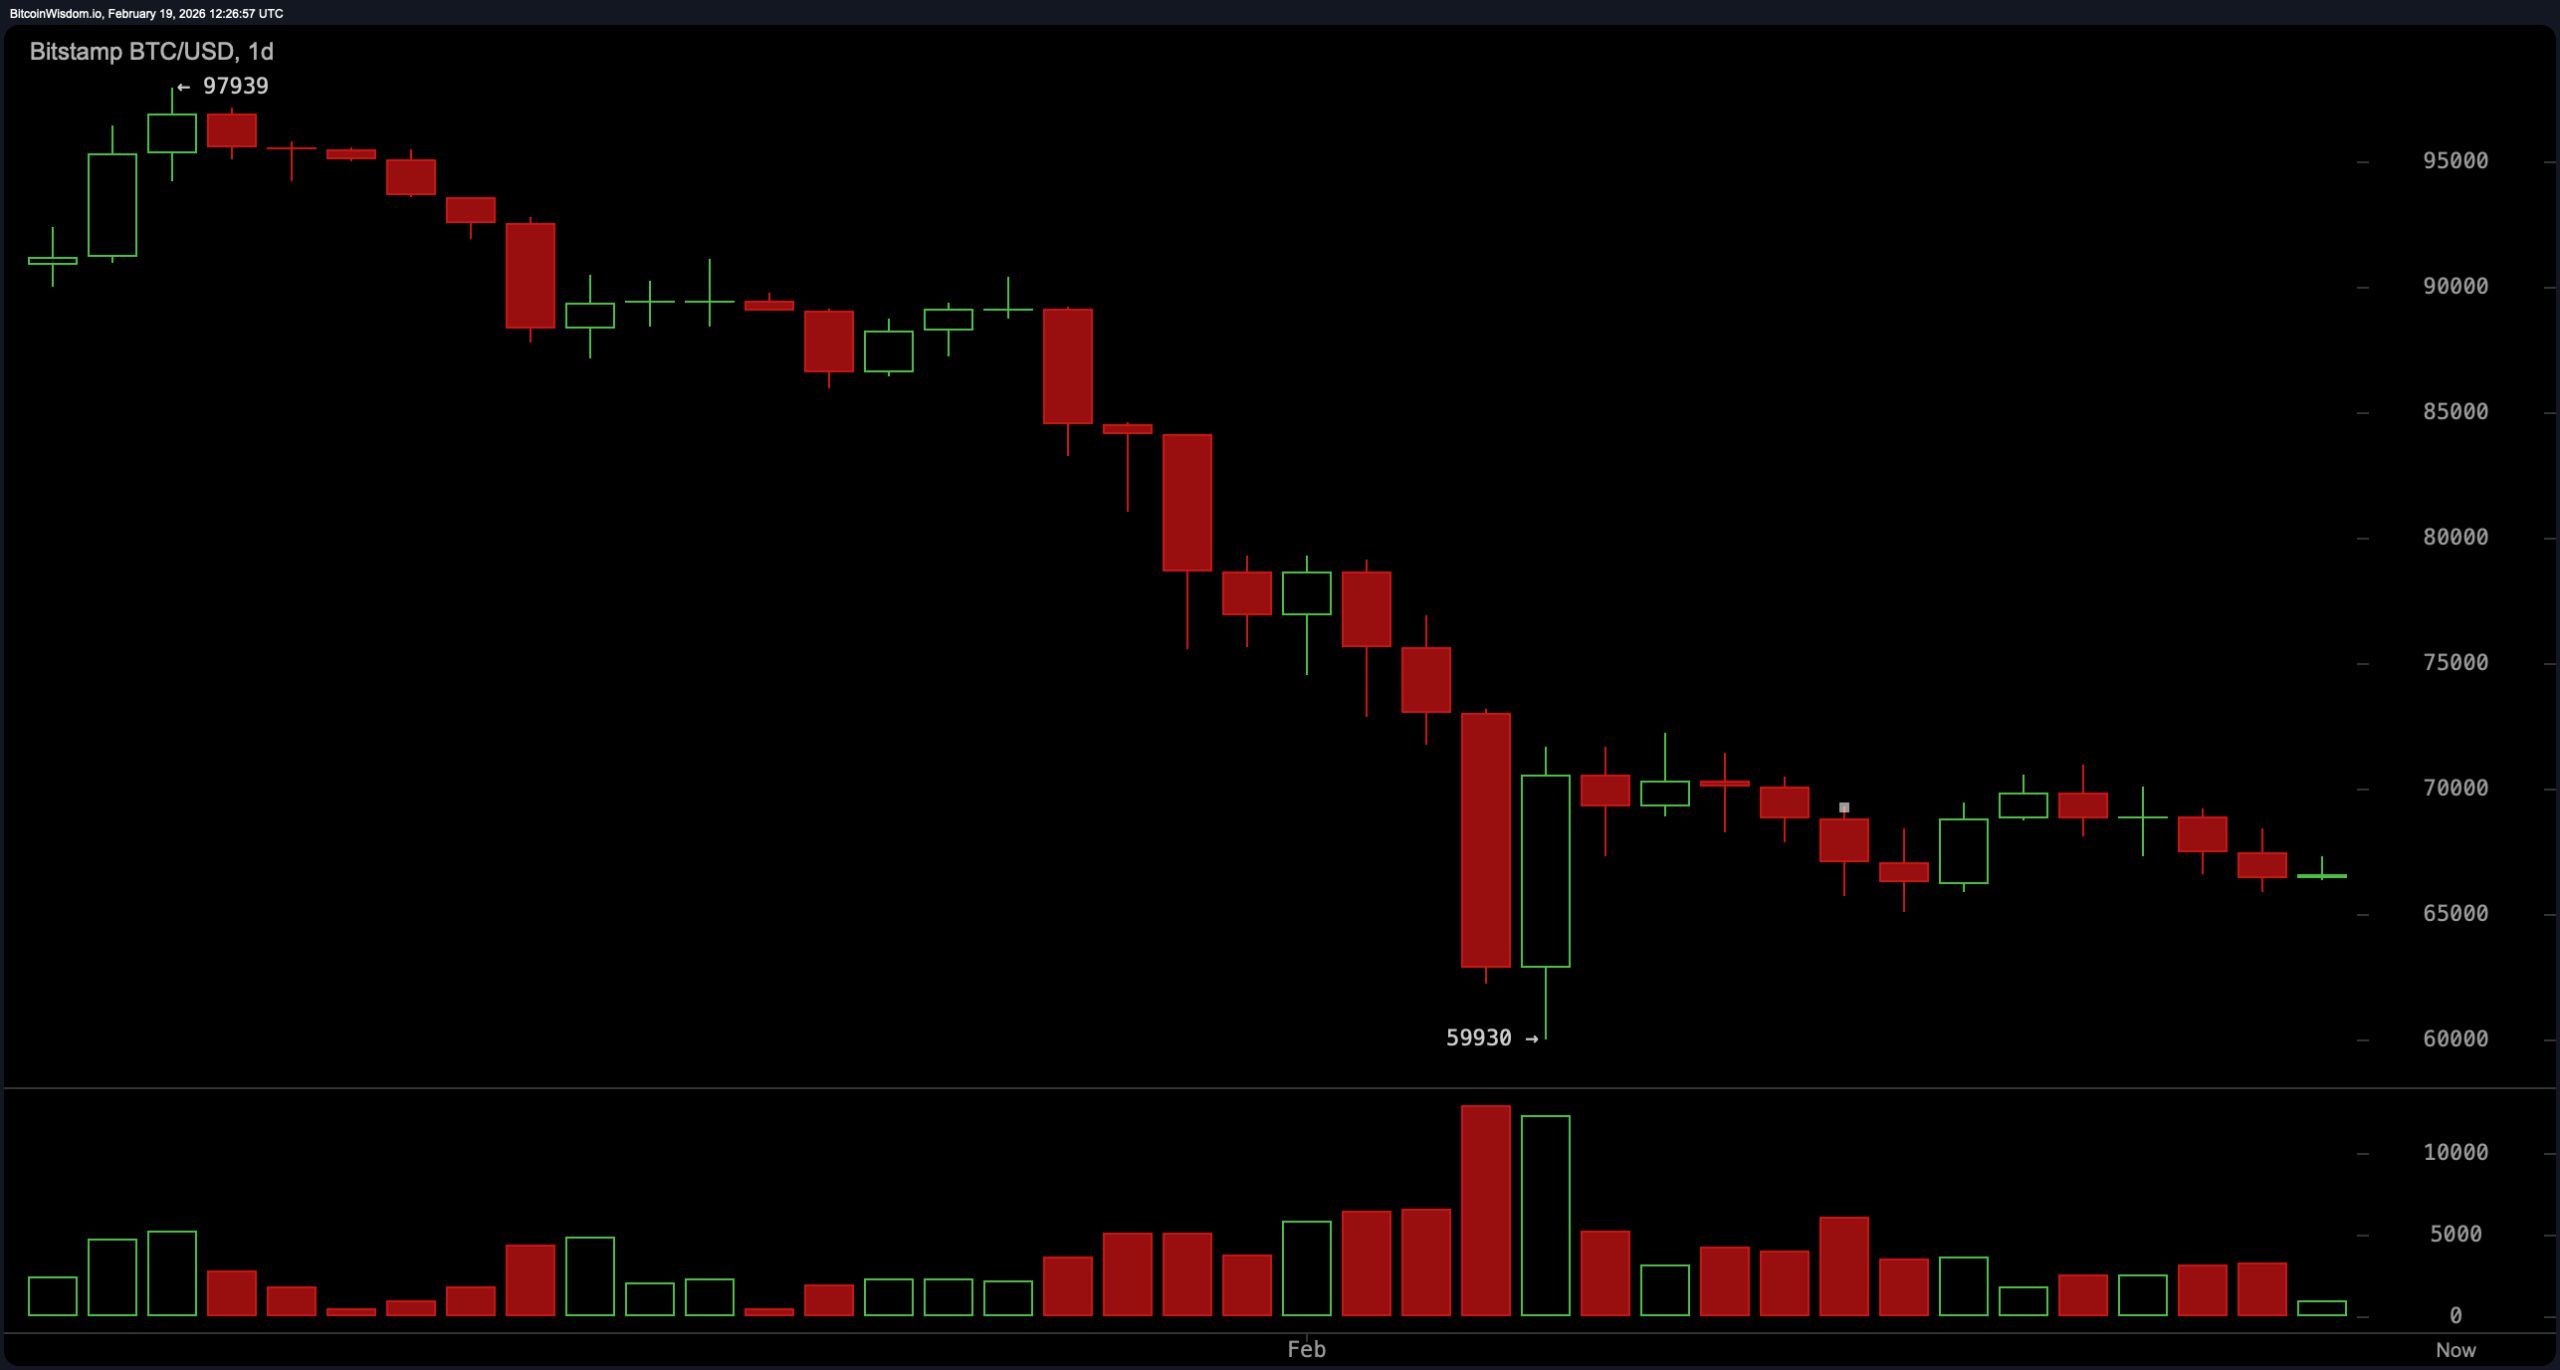
On the daily chart, bitcoin remains confined beneath the prior peak near $97,900 and continues to trade within a descending formation. Price is compressing between $65,840 and $70,000, reflecting equilibrium rather than directional conviction. Major support still stands at $60,000 to $62,000, with intermediate support at $65,900 to $68,000. Overhead, major resistance is layered between $72,000 and $75,000, and a decisive daily close above $75,000 would invalidate the broader bearish structure. Until then, the prevailing trajectory remains cautious as the market digests prior volatility instead of initiating a new macro trend.
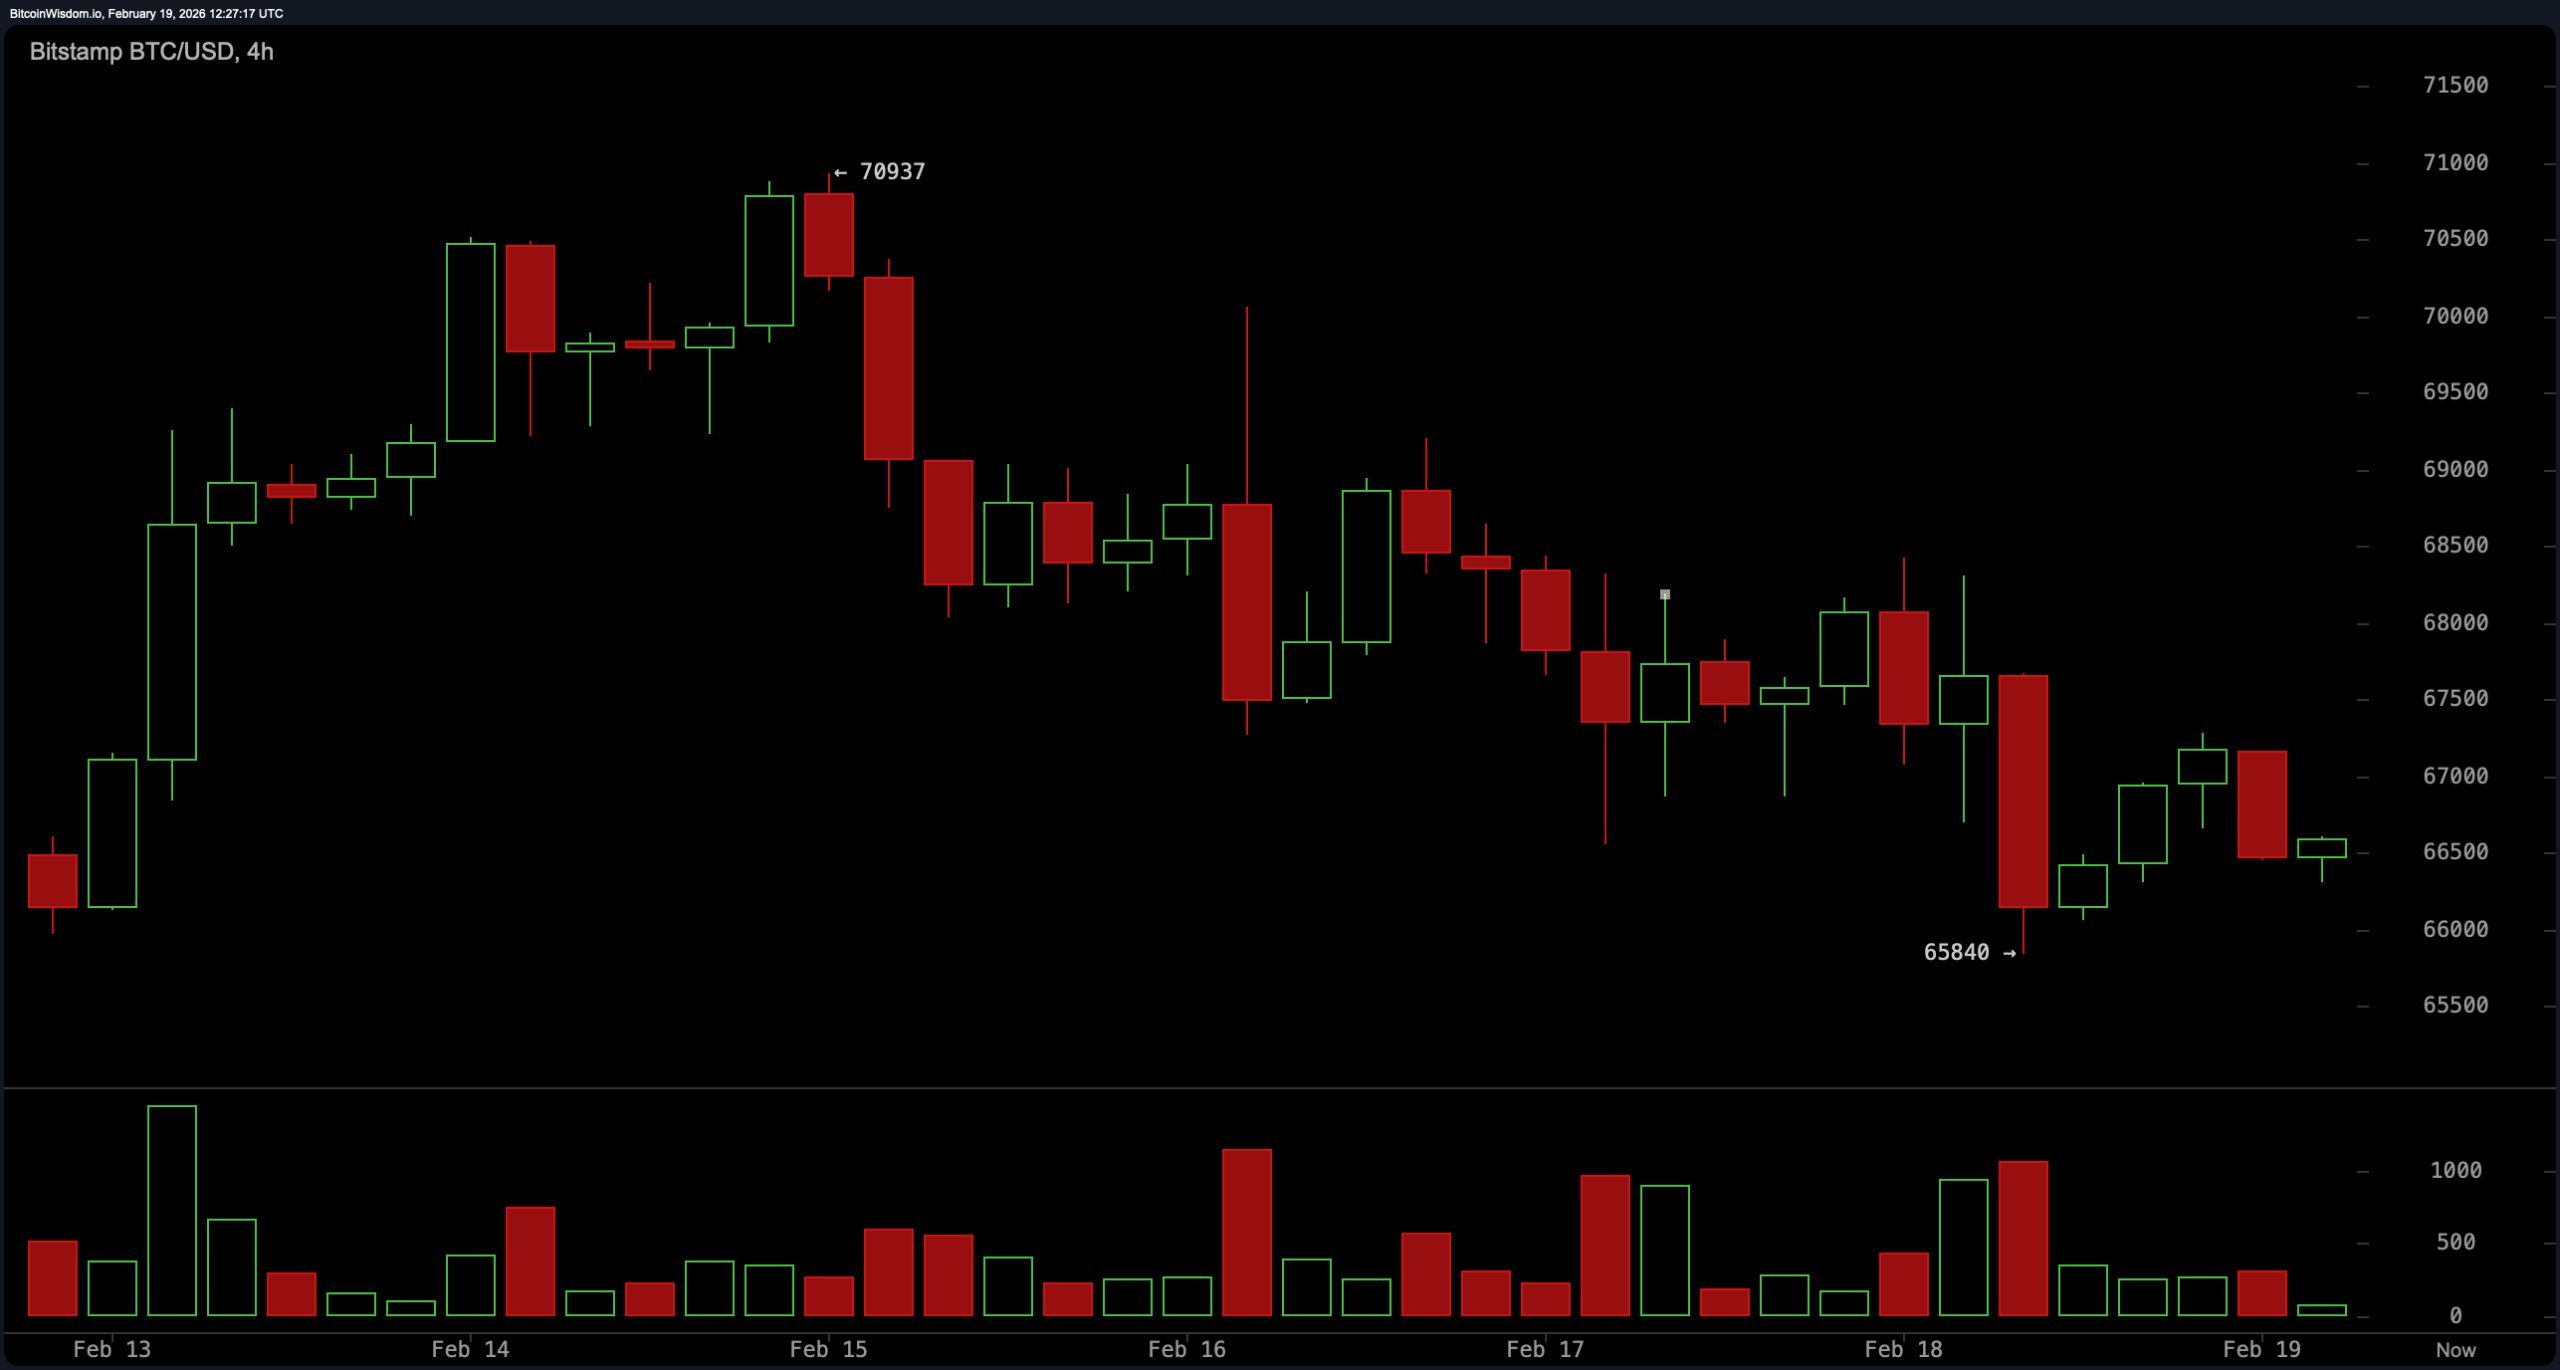
The four-hour chart reinforces the range-bound thesis. Following the vigorous recovery from the $60,000 threshold, price action has transitioned into lateral consolidation marked by a sequence of descending peaks. Participation is diminishing during upward attempts, signaling limited conviction behind rallies.
The defined trade zones are clear: support between $66,500 and $68,000 and resistance between $72,000 and $73,000. A decisive four-hour close above $72,500 with expanding participation would alter the tone, while a breach below $66,000 opens the corridor back toward $60,000 to $62,000. For now, mean-reversion dynamics dominate.
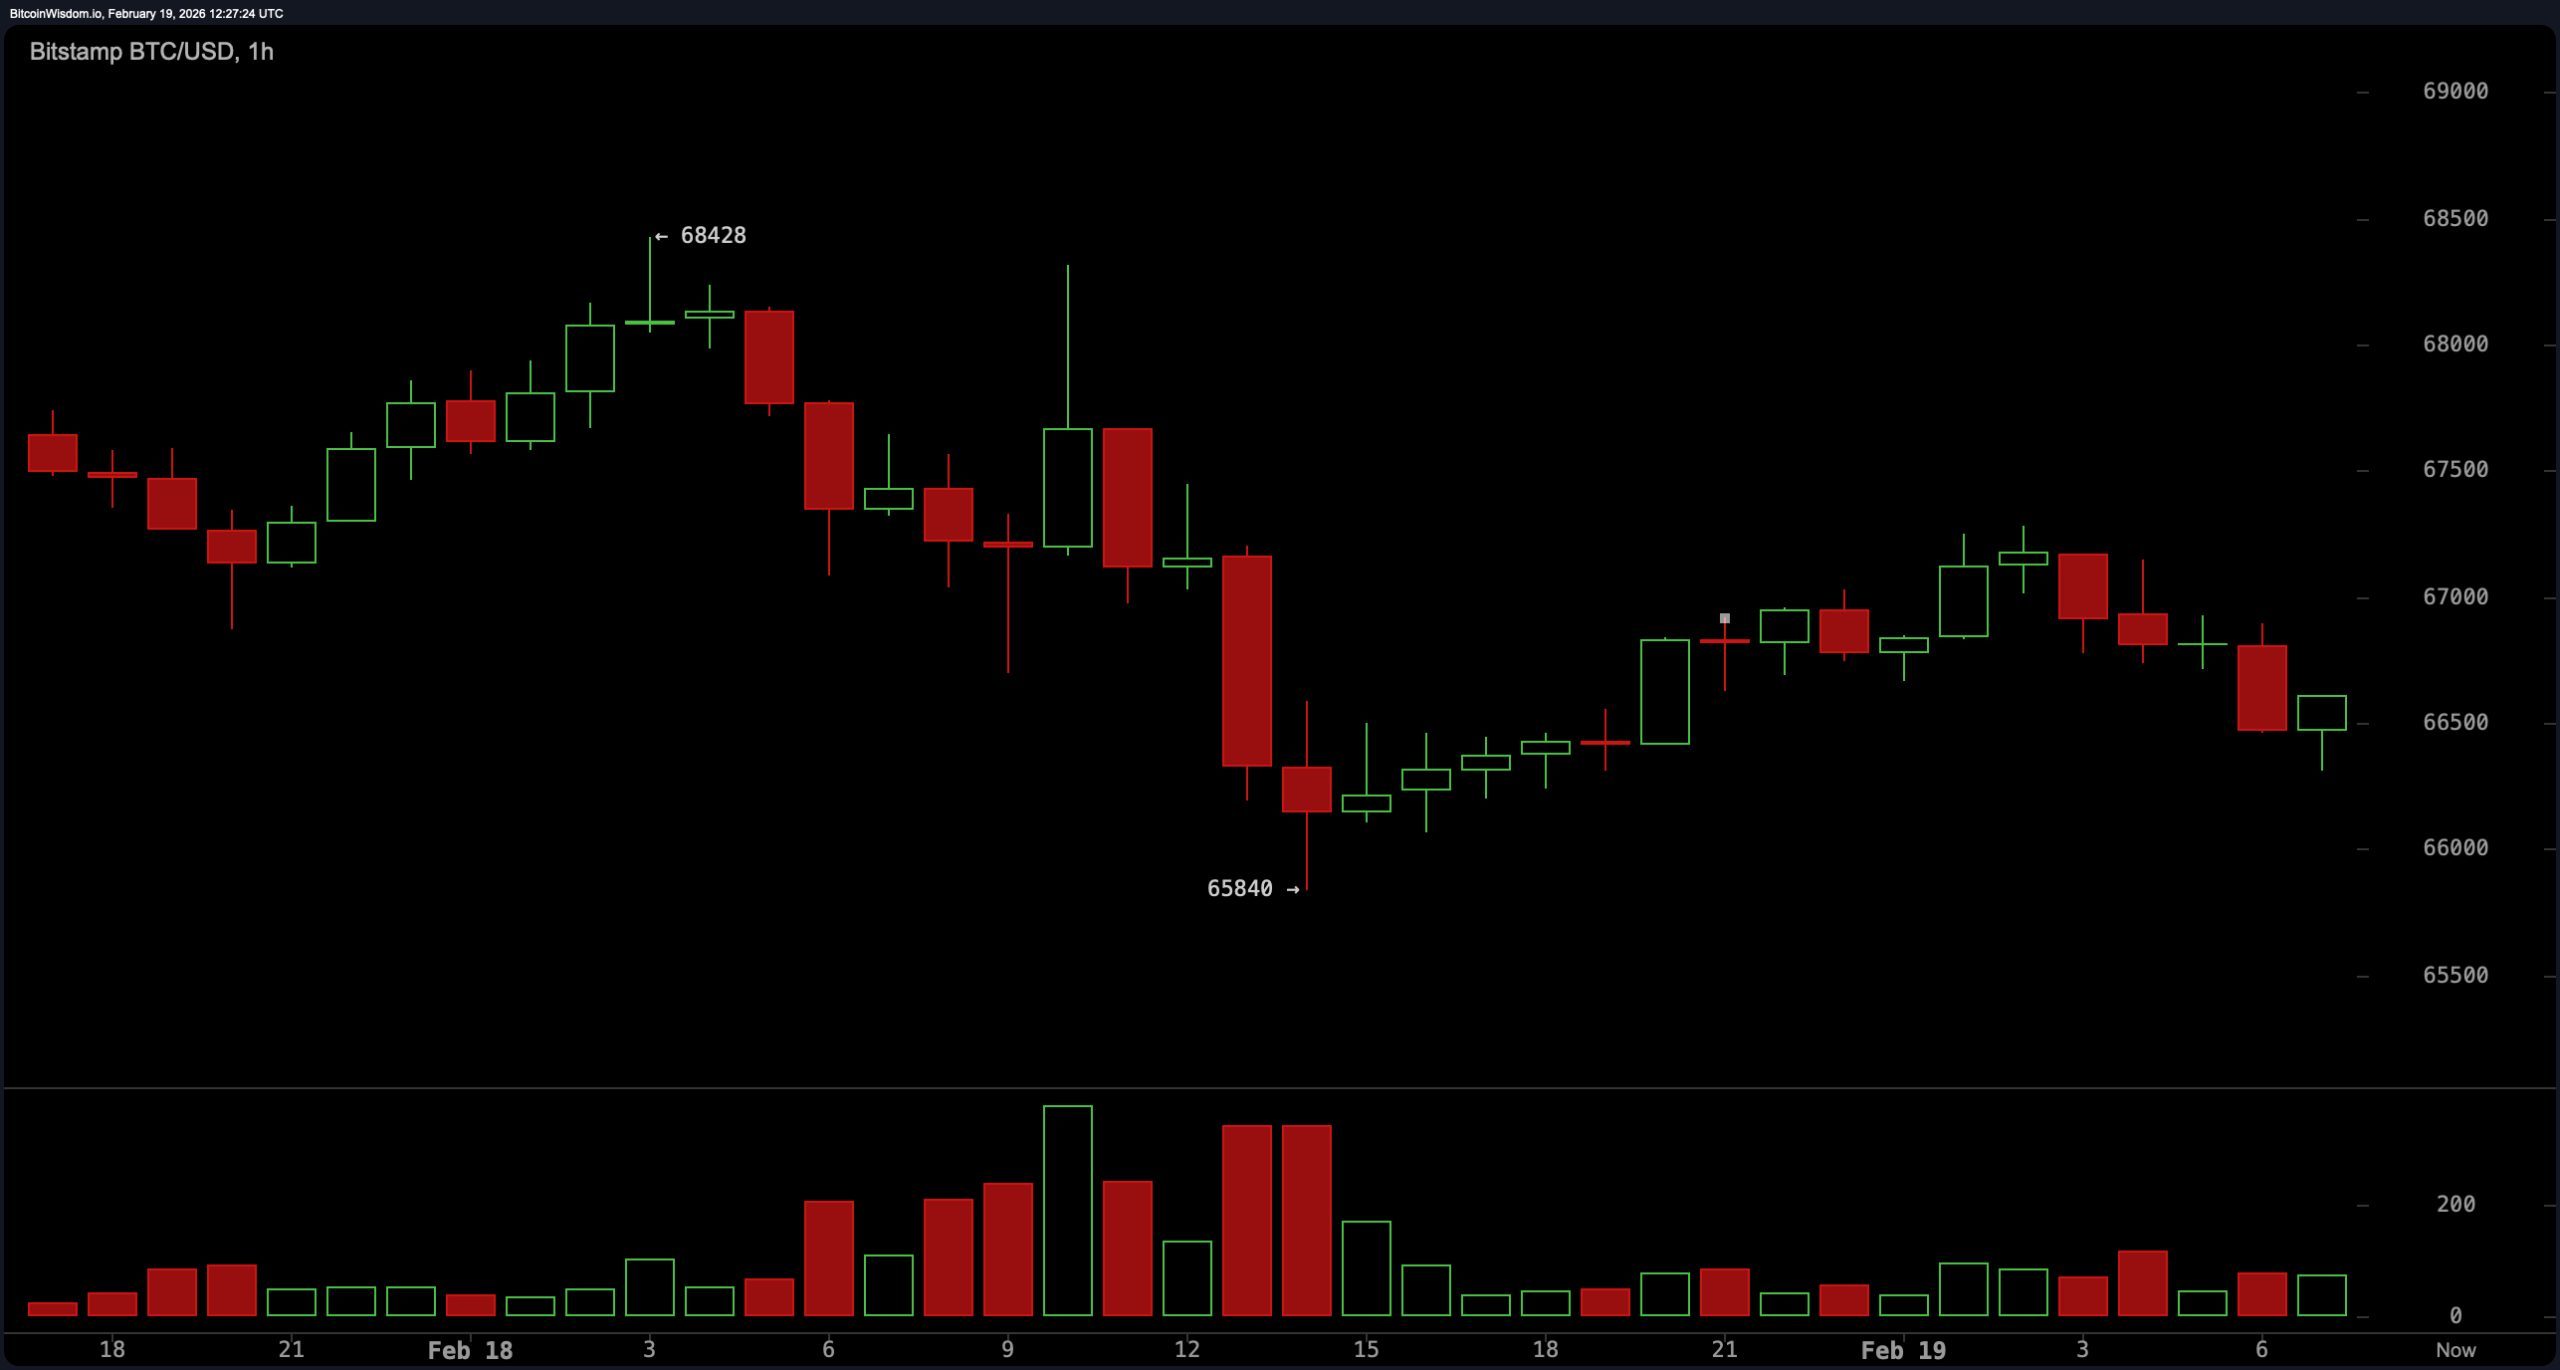
On the one-hour chart, the structure tilts modestly downward. Descending peaks and marginal new lows illustrate that intraday control remains with sellers, while rebounds appear corrective rather than impulsive. The bounce zone between $68,000 and $68,500 has produced short-lived recoveries targeting $69,500 to $70,000, yet unsuccessful attempts near $70,500 to $71,000 have reinforced near-term resistance. Momentum remains subdued, and the gradual decline underscores that this is compression, not expansion. In short, volatility is coiling, and the market is waiting for a catalyst rather than telegraphing one.
Oscillators present a mixed but measured profile. The relative strength index ( RSI) at 36 reflects neutral-to-soft conditions without reaching oversold extremes. The Stochastic at 48 and the commodity channel index (CCI) at negative 47 both register neutral readings, reinforcing equilibrium. The average directional index (ADX) at 57 indicates strong trend strength, though directionally unresolved.
The Awesome oscillator at negative 11,127 remains neutral, while the momentum reading of negative 453 and the moving average convergence divergence ( MACD) level at negative 4,643 both register constructive signals despite negative territory, suggesting waning downside pressure rather than confirmed upside acceleration.
Moving averages (MAs) paint a heavier picture. Bitcoin trades below the exponential moving average (EMA) (10) at $69,519, the exponential moving average (EMA) (20) at $72,810, the exponential moving average (EMA) (30) at $75,861, the exponential moving average (EMA) (50) at $80,180, the exponential moving average (EMA) (100) at $87,067 and the exponential moving average (EMA) (200) at $93,608.
It is likewise positioned beneath the simple moving average (SMA) (20) at $72,074, the simple moving average (SMA) (30) at $77,763, the simple moving average (SMA) (50) at $83,491, the simple moving average (SMA) (100) at $86,987 and the simple moving average (SMA) (200) at $100,105, while only marginally interacting with the simple moving average (SMA) (10) at $68,739.
Bull Verdict:
A decisive daily close above $75,000, reinforced by a four-hour close above $72,500 with expanding participation, would signal that bitcoin has transitioned from compression to expansion. Such a move would invalidate the descending structure, shift momentum dynamics, and place the $72,000 to $75,000 resistance band in the rearview mirror, opening the door for broader structural recovery.
Bear Verdict:
A confirmed breach of $66,000 would disrupt the current stabilization phase and likely reintroduce downside pressure toward the $60,000 to $62,000 major support corridor. Failure to defend that intermediate shelf would reinforce the prevailing descending formation and confirm that consolidation was distribution, not accumulation, extending the corrective cycle.
FAQ ❓
-
What is the bitcoin price outlook for Feb. 19, 2026?
Bitcoin is consolidating between $65,900 and $72,000, with $75,000 acting as major resistance and $60,000 to $62,000 as key macro support. -
What do bitcoin moving averages signal right now?
Bitcoin is trading below all major exponential moving averages (EMA) and simple moving averages (SMA), indicating persistent overhead technical pressure. -
Are bitcoin oscillators showing oversold conditions?
The relative strength index ( RSI), Stochastic oscillator, and commodity channel index (CCI) are neutral, signaling stabilization rather than extreme conditions. -
What price levels could trigger the next major bitcoin move?
A break above $72,500 on the four-hour chart or below $66,000 would likely determine the next directional expansion.