
After four straight weekly losses, market focus is on Bitcoin price today as it trades just below key short-term averages and near a fragile support area.
Summary
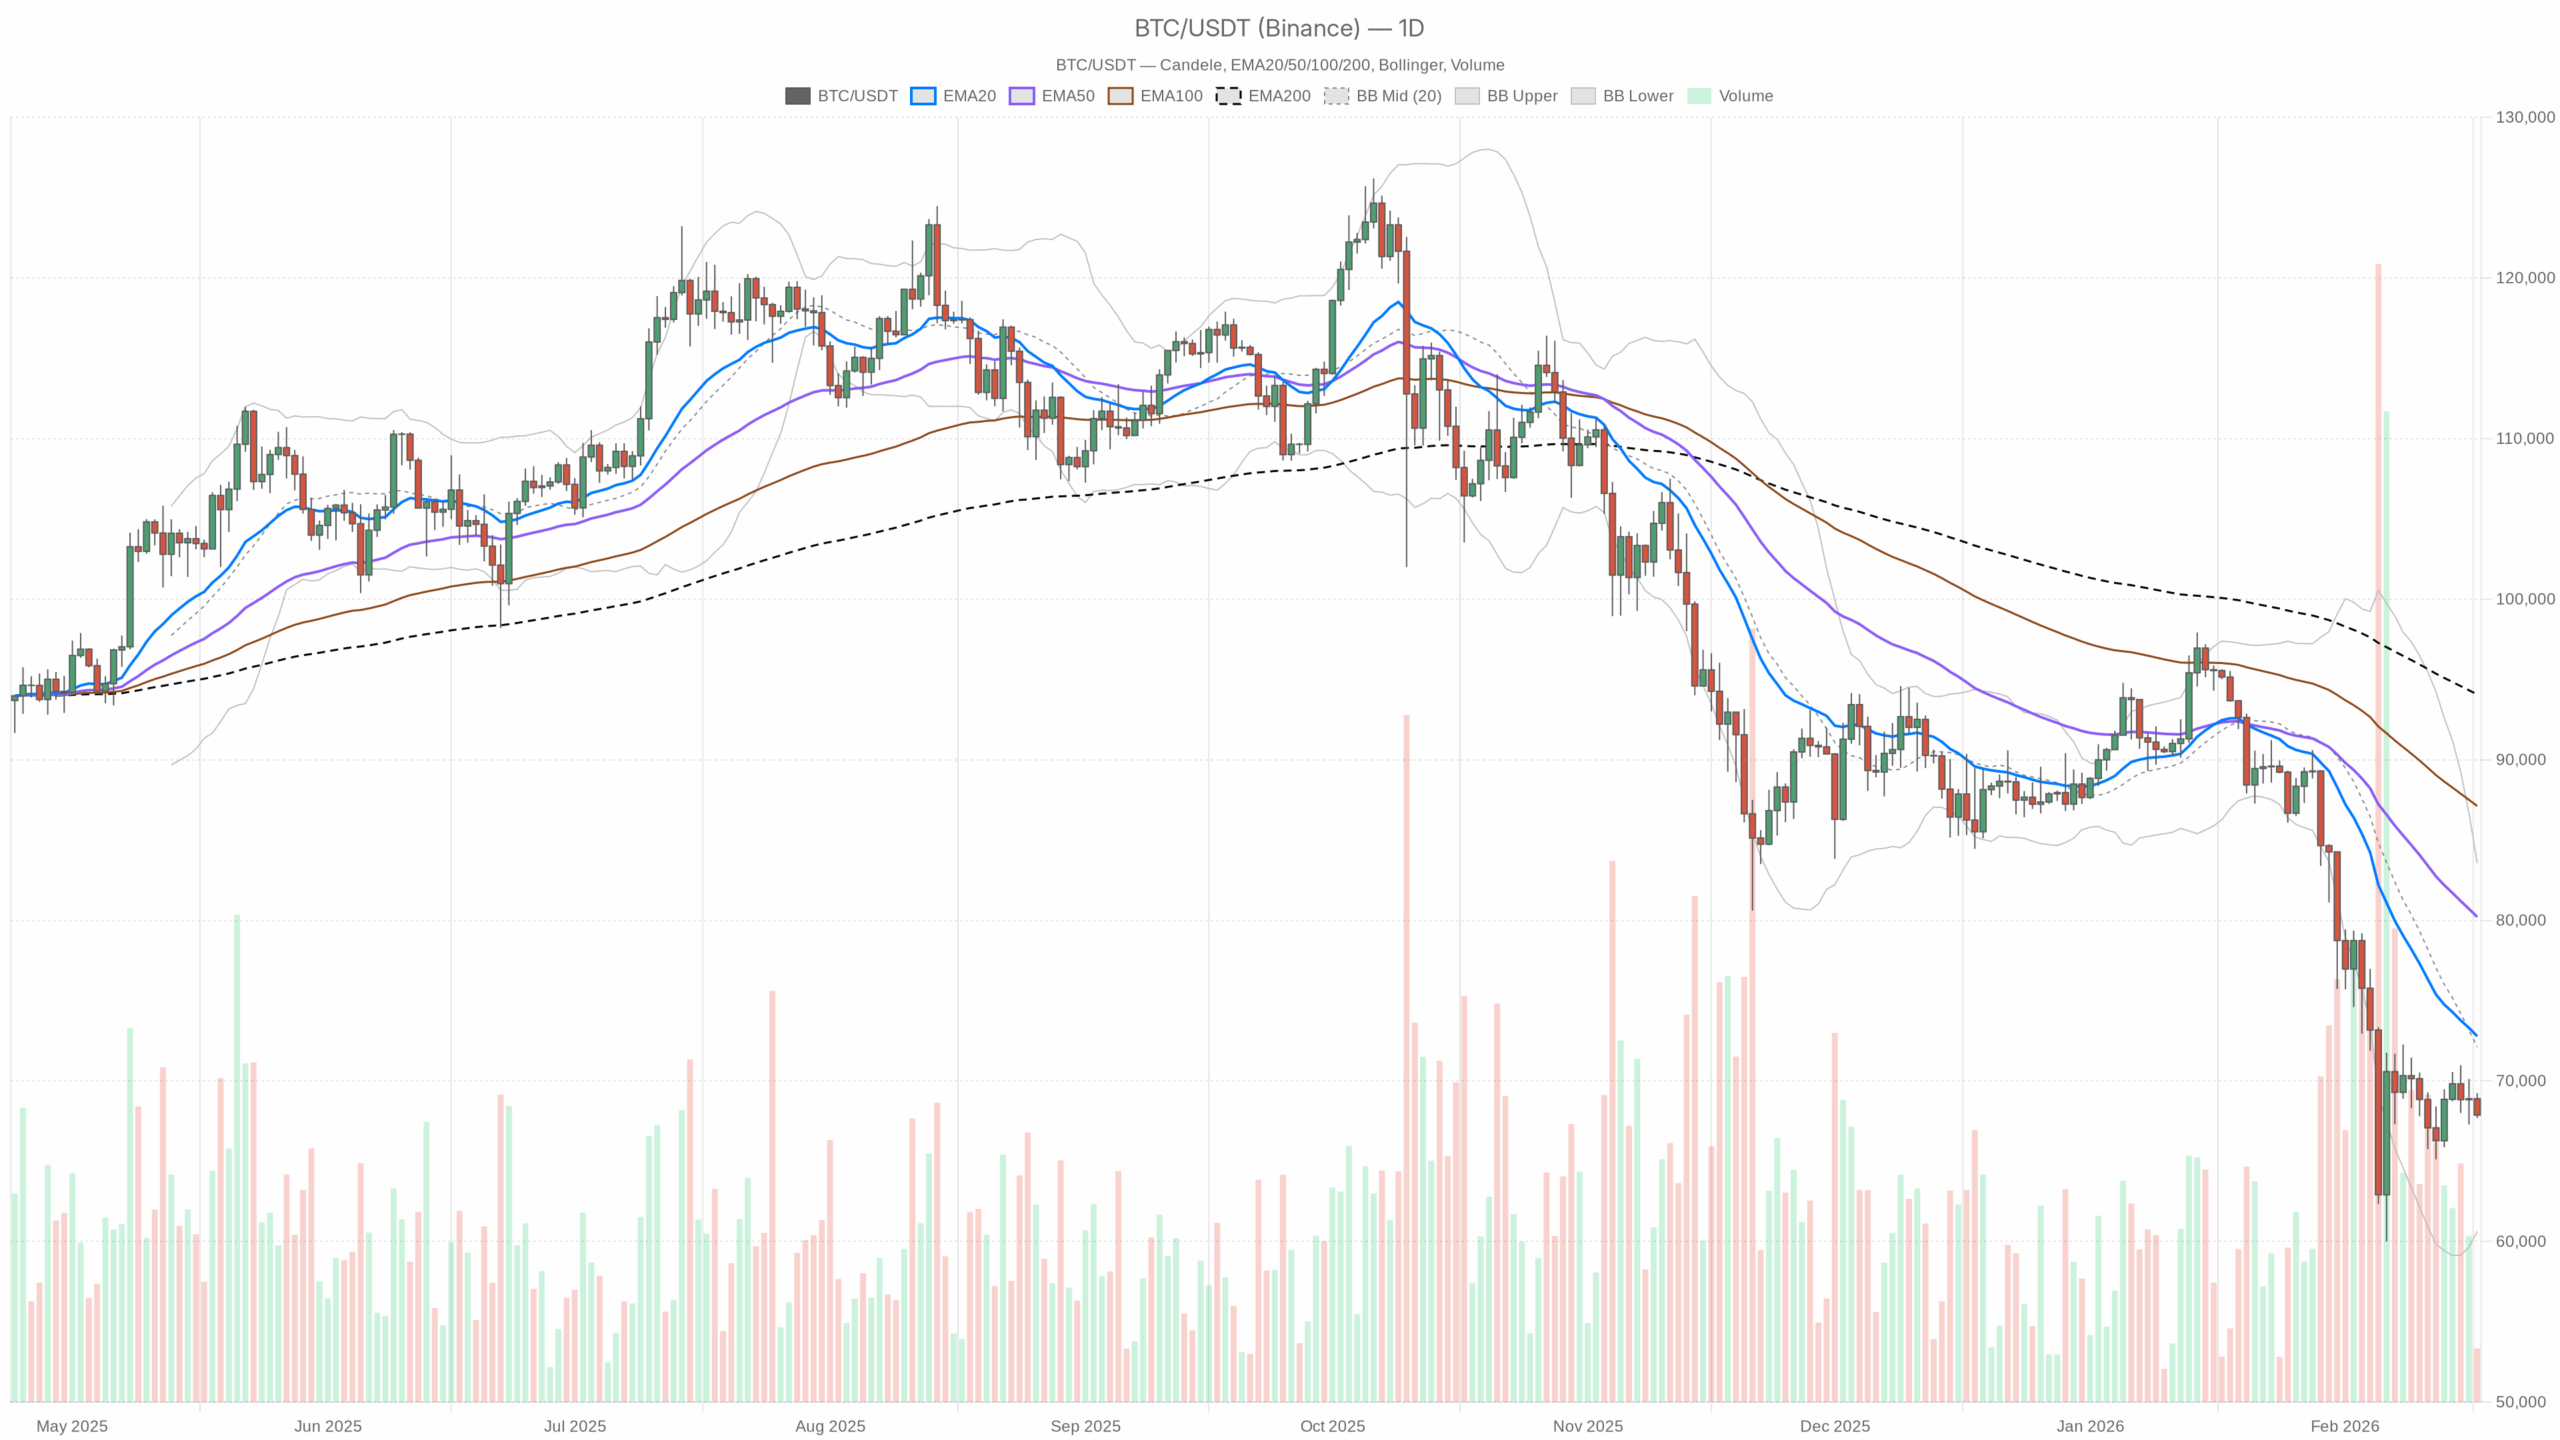
Daily Chart (D1): Primary Bias – Bearish, but Late in the Move
Trend Structure: EMAs
Data:
– Price (close): $67,874
– EMA 20: $72,785
– EMA 50: $80,211
– EMA 200: $94,063
– Regime flag: bearish
All the key EMAs are stacked above spot price and fanned out bearishly (20 < 50 < 200, with price below all of them). That is a classic, established downtrend structure, not the beginning of one. The gap between spot and the short EMA (about $5k under the 20-day) also shows we are stretched from mean reversion already.
Translation: The trend is down, but we are not early shorts anymore. This is the middle-to-late stage of a corrective leg where chasing fresh downside gets progressively riskier unless momentum re-accelerates.
Momentum and Exhaustion: RSI (14)
Data: RSI 14 on D1: 34.8
Daily RSI has pushed into the low 30s but has not hit textbook oversold yet. It is clearly below the midline, so bears still control momentum. However, the indicator is now in the zone where prior selloffs have often started to lose steam or at least move into choppy consolidation.
Translation: Sellers still have the upper hand, but the risk/reward of new aggressive shorts on the daily is getting worse. This is where trend followers are usually patient and wait for either a bounce to sell or a capitulation flush to fade, rather than selling blindly.
Trend Momentum: MACD
Data:
– MACD line: -4,729.8
– Signal: -5,084.3
– Histogram: +354.5
MACD is deep in negative territory, which is what you expect after a large drawdown, but the histogram has turned positive as the MACD line starts to curl back toward the signal line. That does not mean the trend is bullish. Instead, it means the rate of downside is slowing and the downtrend is aging.
Translation: The dominant trend is still down, but the selling wave is no longer accelerating. Bears are in control, but they are not hitting with the same intensity. This opens the door to a relief rally or sideways base if buyers show up.
Volatility and Range: Bollinger Bands & ATR
Bollinger Bands (20):
– Mid band: $72,101
– Upper band: $83,571
– Lower band: $60,631
– Price: near the lower half of the band set
Price is trading well below the mid-band and in the lower half of the Bollinger range, but not hugging the lower band itself. That is consistent with a downtrend that has already made a significant move and is now oscillating near the lower side rather than freshly breaking.
Translation: The market is still priced pessimistically but not in outright panic at this moment. There is room both to tag the lower band closer to $60.6k in a final flush or to mean-revert toward the mid-band around $72k if fear cools off.
ATR (14): $4,365 on the daily chart.
Daily ATR north of $4k signals elevated realized volatility. This is not the quiet, grinding bull market type of tape. Instead, it is a heavier, two-sided arena where intraday swings of several thousand dollars are normal.
Translation: Position sizing and leverage matter a lot here. Even if you are directionally right, being oversized into a $4k daily trading range can knock you out before the move plays out.
Daily Pivots: Near-Term Battle Lines
Data:
– Pivot point (PP): $68,269
– Resistance 1 (R1): $68,847
– Support 1 (S1): $67,296
– Price: $67,874
Bitcoin is trading just beneath the daily pivot, sandwiched between PP and S1. That pins us in a delicate balance area: slightly below the center of gravity for the session, but not yet at the first support.
Translation: Bears have a marginal intraday edge on the daily map, but we are not in breakdown territory. A push back above the PP and then R1 would be the first sign that buyers are willing to contest this downtrend, at least in the short run.
Hourly Chart (H1): Short-Term Flow – Bearish but Tightening
Trend and Structure: EMAs on H1
Data:
– Price: $67,872
– EMA 20: $68,344
– EMA 50: $68,588
– EMA 200: $68,849
– Regime flag: bearish
On the 1-hour, price is trading just below all three EMAs, and those averages are tightly clustered. The regime flag is bearish, but with EMAs so compressed, it looks more like a short-term downtrend that is entering a consolidation band than an explosive new leg lower.
Translation: Momentum sellers still control the intraday direction, but the market is starting to move sideways under resistance rather than cascading lower. That is usually a prelude to either a breakdown continuation or a squeeze higher. The EMAs themselves are not telling us which yet, only that the tape is coiling.
H1 Momentum: RSI & MACD
RSI 14 (H1): 40.3
RSI on the hourly is below the midline but not oversold. Selling pressure exists, but it is controlled, not panicky. There is room for one more push lower before we hit levels where intraday dip buyers tend to show up.
MACD (H1):
– MACD line: -171.97
– Signal: -118.25
– Histogram: -53.72
MACD is negative and the histogram is also mildly negative, pointing to ongoing bearish intraday momentum. However, the magnitude here is modest. We are not seeing the kind of large, expanding negative bars that accompany liquidation-style moves.
Translation: Intraday, bears are in charge but they are walking, not sprinting. This is the kind of environment where trend-following shorts still work, but they are more vulnerable to sudden squeezes if news or flows flip.
H1 Volatility and Levels: Bollinger Bands, ATR, Pivots
Bollinger Bands (H1):
– Mid: $68,342
– Upper: $69,070
– Lower: $67,614
– Price: just above the lower band
Price is skimming the lower band on the hourly, but not in a sustained band-walk. That often aligns with a controlled drift lower rather than capitulation.
ATR 14 (H1): $419
Hourly ATR around $400 points to decent intraday trading ranges, but not chaos. That lines up with the picture of a steady grind down rather than a vertical crash.
Pivots (H1):
– PP: $67,832
– R1: $67,975
– S1: $67,729
– Price: $67,872
On the 1-hour grid, $BTC is sitting almost exactly at the pivot, slightly above it. R1 and S1 are tight, reflecting a compressed intraday range.
Translation: The market is in a short-term decision zone. If price holds above the H1 pivot and pushes through R1, we can easily see a squeeze back toward the compressed EMAs around $68.3–68.8k. Lose S1, and the drift lower likely resumes toward the lower Bollinger band region.
Translation: The market is in a short-term decision zone. If price holds above the H1 pivot and pushes through R1, we can easily see a squeeze back toward the compressed EMAs around $68.3–68.8k. Lose S1, and the drift lower likely resumes toward the lower Bollinger band region.
15-Minute Chart (M15): Execution Context – Micro Bear Bias, Very Close to Levels
Short-Term Trend: EMAs and Regime
Data:
– Price: $67,872
– EMA 20: $68,087
– EMA 50: $68,283
– EMA 200: $68,692
– Regime: bearish
On 15 minutes, the EMAs are again stacked above price and aligned bearishly, but distances are tight. This is a local downtrend grinding just under short-term resistance, not a freefall.
Translation: For active traders, rallies back into the 20/50 EMA band on M15 are still getting sold, but we are close enough that a minor push can flip the very short term from clean trend to chop.
Micro Momentum: RSI & MACD
RSI 14 (M15): 35.6
RSI on the 15-minute sits in the mid-30s: weak but not fully washed out. It confirms that the very short-term tape favors the downside, yet still has room for a brief spike lower before intraday exhaustion kicks in.
MACD (M15):
– MACD line: -155.21
– Signal: -138.15
– Histogram: -17.06
MACD remains negative with a small negative histogram: the micro-trend is still down, but there is no strong acceleration.
Translation: On the execution layer, bears still have the initiative, but they are not pressing hard. That typically favors tactical fades at resistance rather than momentum breakout trades unless something external changes.
Short-Term Volatility and Levels: Bands, ATR, Pivots
Bollinger Bands (M15):
– Mid: $68,125
– Upper: $68,526
– Lower: $67,725
– Price: between lower band and mid-band
Price is leaning to the lower half of the band set on 15m, consistent with a gentle, ongoing sell bias.
ATR 14 (M15): $169
Around $170 of expected 15-minute range keeps things tradable intraday but not frantic. You can be wrong by a few dozen dollars without instantly getting stopped out, but tight stops will still be vulnerable.
Pivots (M15):
– PP: $67,886
– R1: $67,902
– S1: $67,855
– Price: $67,872
We are essentially sitting right at the 15-minute pivot, inside a very narrow intraday band.
Translation: Very short term, $BTC is coiling. The next $100 move will likely decide whether we get a local pop toward the short EMAs or another leg down toward the lower Bollinger band.
Macro Context: Dominance, Market Breadth, and Sentiment
Bitcoin dominance stands at ~56.4%, elevated by recent standards. When $BTC dominance climbs while total crypto market cap falls (~-0.8% over 24h and volumes down ~12%), it usually means capital is hiding in Bitcoin relative to alts, even as it exits the space overall. This is classic defensive rotation.
The Fear & Greed Index reading of 10 (Extreme Fear) captures the mood: the market is scared, positioning is cautious, and narratives are focused on downside risk. For example, we see headlines about $60k liquidation triggers and historical drawdowns possibly extending. Historically, extreme fear levels often coincide with late-stage down moves or consolidation zones, but they do not guarantee an immediate reversal, because fear can persist.
DeFi fee revenue dropping sharply across major DEXs confirms that on-chain speculative activity is cooling. Fewer trades, smaller bets, and lower leverage appetite typically weigh on altcoins more than $BTC, which fits with the rising dominance story.
Putting It Together: Conflicting Signals and Core Scenarios
Timeframes are broadly aligned: daily, hourly, and 15-minute all show a bearish regime. The conflict is not between timeframes, it is between trend vs. exhaustion:
- The trend is clearly down: price below all key EMAs on all frames, negative MACD across the board, RSI below 50 everywhere.
- Exhaustion signs are emerging: daily RSI in the mid-30s, MACD histogram improving on D1, price not hugging lower Bollinger bands, and sentiment deeply fearful.
So the main scenario right now is still bearish on the daily, but it is not a fresh, high-conviction short environment. It is a market where the downside thesis is increasingly dependent on either a new catalyst or a break of well-known support levels, notably the widely watched $60k zone.
Clear Bullish Scenario
For a proper bullish case to develop from here, we would need to see trend repair rather than just a dead-cat bounce.
Key steps for the bull side:
- Hold above the lower Bollinger band on D1 (roughly >$60.6k) and avoid a panic wick that closes deep below it. That would confirm that the current leg lower is losing energy.
- Reclaim and hold above the daily pivot (>$68.3k) and then flip the $72k mid-Bollinger/EMA-20 zone from resistance into support. A daily close above ~$72k would be the first serious sign of a shift from pure trend-following sell pressure to mean-reversion buyers taking control.
- On intraday frames, price must reclaim and ride above the 20/50 EMAs on H1 and M15, turning those from capping resistance into dynamic support.
- RSI on D1 pushing back above 50 and MACD closing in on a bullish crossover would confirm not just a bounce, but a transition toward a neutral-to-bullish momentum regime.
If this plays out: A constructive upside path would be a move from todays ~$68k toward the $72–75k band, which is the daily mid-band and short EMA cluster, followed by a battle there. If bulls manage to establish a base above that zone, a medium-term target toward the upper Bollinger band (~$83k) comes back into view.
What invalidates the bullish scenario?
A decisive break and daily close below ~$60k, especially if it comes with a spike in ATR and 15m/1h candles hugging or piercing the lower Bollinger bands. That would signal renewed, aggressive liquidation and reset the bullish timeline entirely, opening the door to a deeper corrective phase.
Clear Bearish Scenario
The bearish scenario is an extension of the current downtrend, with the market shifting from controlled grind to renewed acceleration.
What bears want to see:
- Failure at or below the daily pivot and EMA-20 zone. If price repeatedly gets rejected in the $68–72k band and cannot close above it, that keeps the trend structure firmly bearish.
- On H1 and M15, retests of the 20/50 EMAs that roll over, with local highs making lower highs, reinforcing that every bounce is being sold.
- Daily RSI staying pinned below 40 and turning back down, while the MACD histogram stalls in its recovery and starts expanding negative again. That would show that the slowdown in selling was just a pause.
- A break below the lower Bollinger band zone toward $60–61k, ideally accompanied by a spike in ATR (volatility expansion), marking a capitulation-like extension of the downtrend.
If this plays out: The first obvious downside magnet is the $60k region, which news flow is already framing as a key liquidation trigger. A clean break there risks a liquidation cascade that could easily push price into the mid-to-high $50ks, where longer-term participants would have to reassess their risk.
What invalidates the bearish scenario?
A sustained reclaim of $72k+ on a daily closing basis, with price holding above the daily 20 EMA and turning it into support. If that is accompanied by daily RSI back above 50 and H1 EMAs flipping into a bullish alignment (price > 20 > 50 > 200), the current bearish thesis starts to break down.
Positioning, Risk, and How to Think About This Tape
Bitcoin price today is in a late-stage downtrend with extreme fear and rising, but not frantic, volatility. Trend followers are still in control of the higher timeframe, but they are no longer early. The easy part of the move is likely behind us. Mean-reversion traders, on the other hand, are starting to watch closely for signs of seller exhaustion, but they have not been fully rewarded yet.
If you are thinking about positioning, the key is recognizing that uncertainty is high on both sides:
- Chasing downside here relies on a bet that the $60k area will fail and unleash fresh liquidations, despite already stretched sentiment and distance from long-term averages.
- Fading the trend relies on a bet that fear has overshot and that buyers will defend the current zone, even though the daily structure is still unambiguously bearish.
Whichever side you lean toward, the combination of a daily ATR around $4,365 and intraday ATRs of several hundred dollars demands tighter risk controls, smaller sizing, and a willingness to accept being early or wrong. The market can stay fearful longer than most traders can stay solvent, and strong trends do not reverse cleanly on the first attempt.
For now, the scoreboard is simple: bears still lead on structure, bulls are only just starting to show up on exhaustion signals. Until one side pushes price decisively out of this $60–72k band, expect volatility, noise, and plenty of trap potential for anyone overconfident in a single outcome.