
Bitcoin’s price this morning at 8:15 a.m. Eastern time stands at $69,393 per coin, with a market cap of $1.38 trillion and 24-hour trading volume of $39.29 billion, as price action fluctuated within an intraday range of $68,095 to $70,220. The leading digital asset is hovering just below a critical inflection point, compressing beneath $71,000 as momentum signals diverge across multiple time frames, with tightening volatility and rising short-term volume suggesting the market is coiled ahead of a decisive move.
Bitcoin Chart Outlook
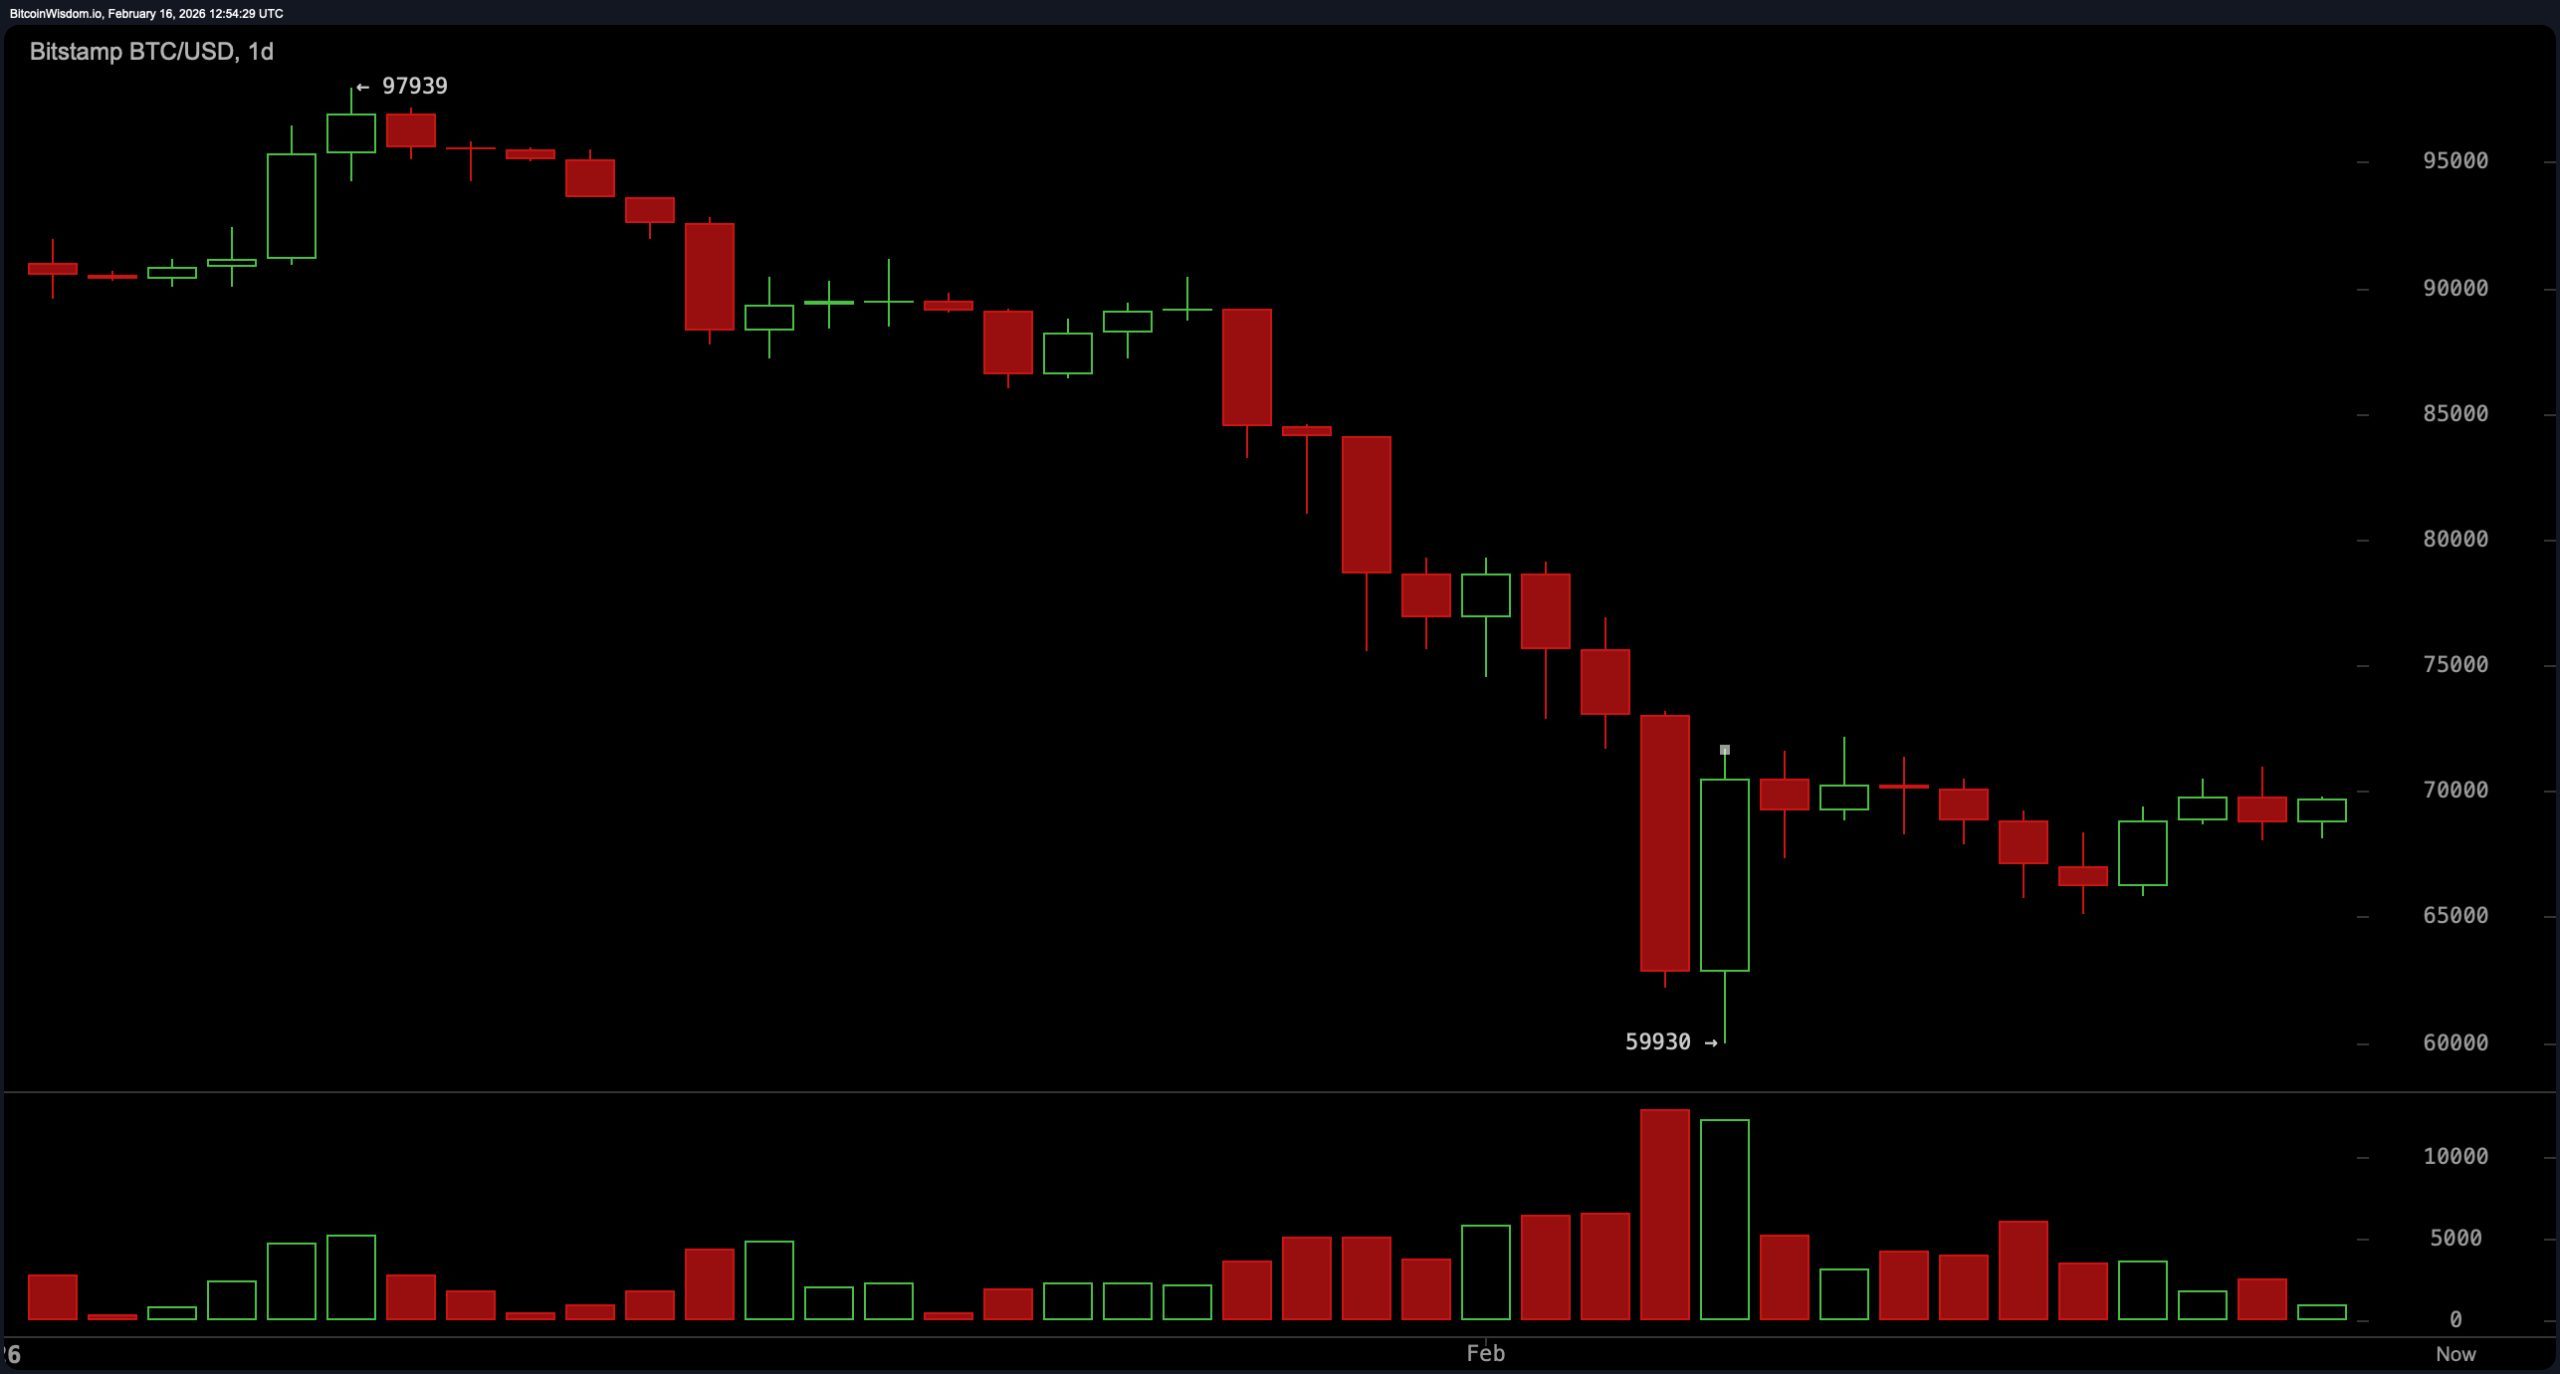
The daily chart continues to reflect a broader downtrend structure, defined by lower highs and lower lows following a rejection near $97,900 and a sharp decline to approximately $59,900. Price is now consolidating between $65,000 and $70,000, with $70,000 to $71,000 acting as immediate resistance and $75,000 as major resistance.
Support stands at $65,000, with critical structural support between $59,900 and $60,000. The prevailing daily bias remains negative unless price reclaims and sustains acceptance above $71,000 to $75,000. Until that occurs, this remains a relief rally within a larger corrective phase — not a confirmed reversal.
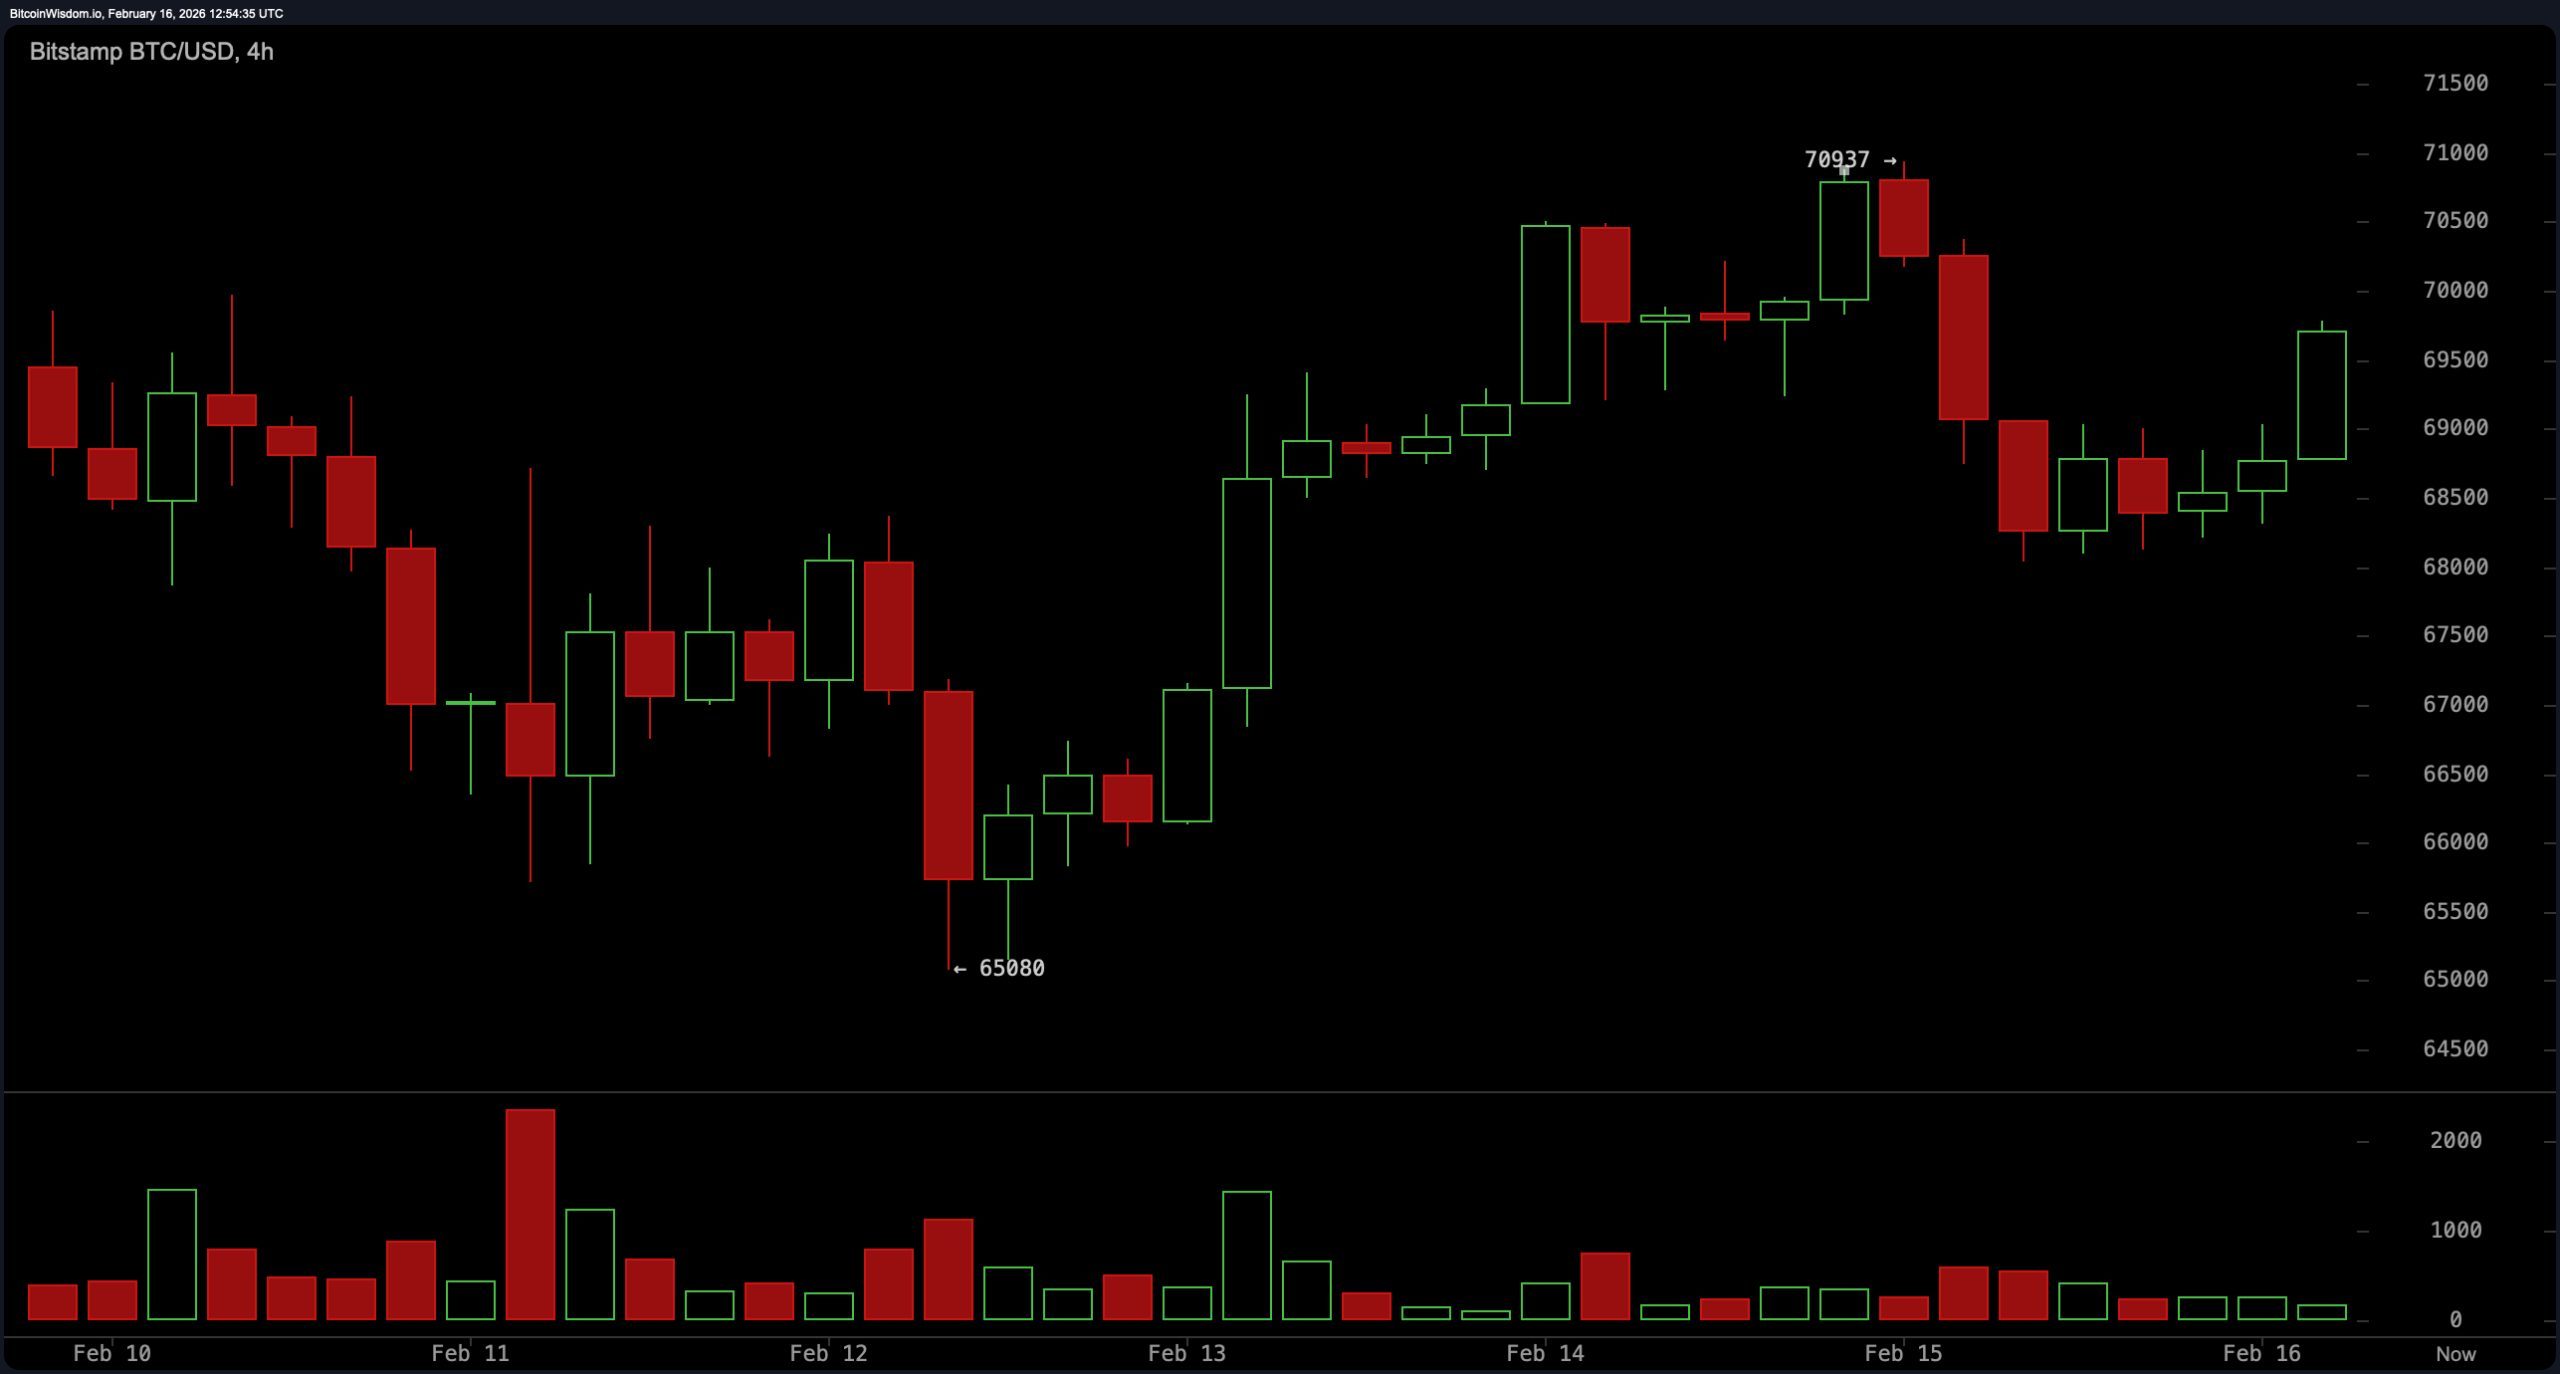
On the four-hour chart, however, the tone shifts. A local low near $65,080 produced a strong rebound to approximately $70,937, followed by a pullback that held a higher low around $68,000. That sequence has created a short-term ascending structure, with price now attempting another push toward $71,000. The $70,500 to $71,000 zone remains tactical resistance. A four-hour close below $67,800 would weaken this constructive momentum, while sustained acceptance above $71,000 would open the door toward $72,500 to $75,000. For now, structure favors continuation attempts — but only just.
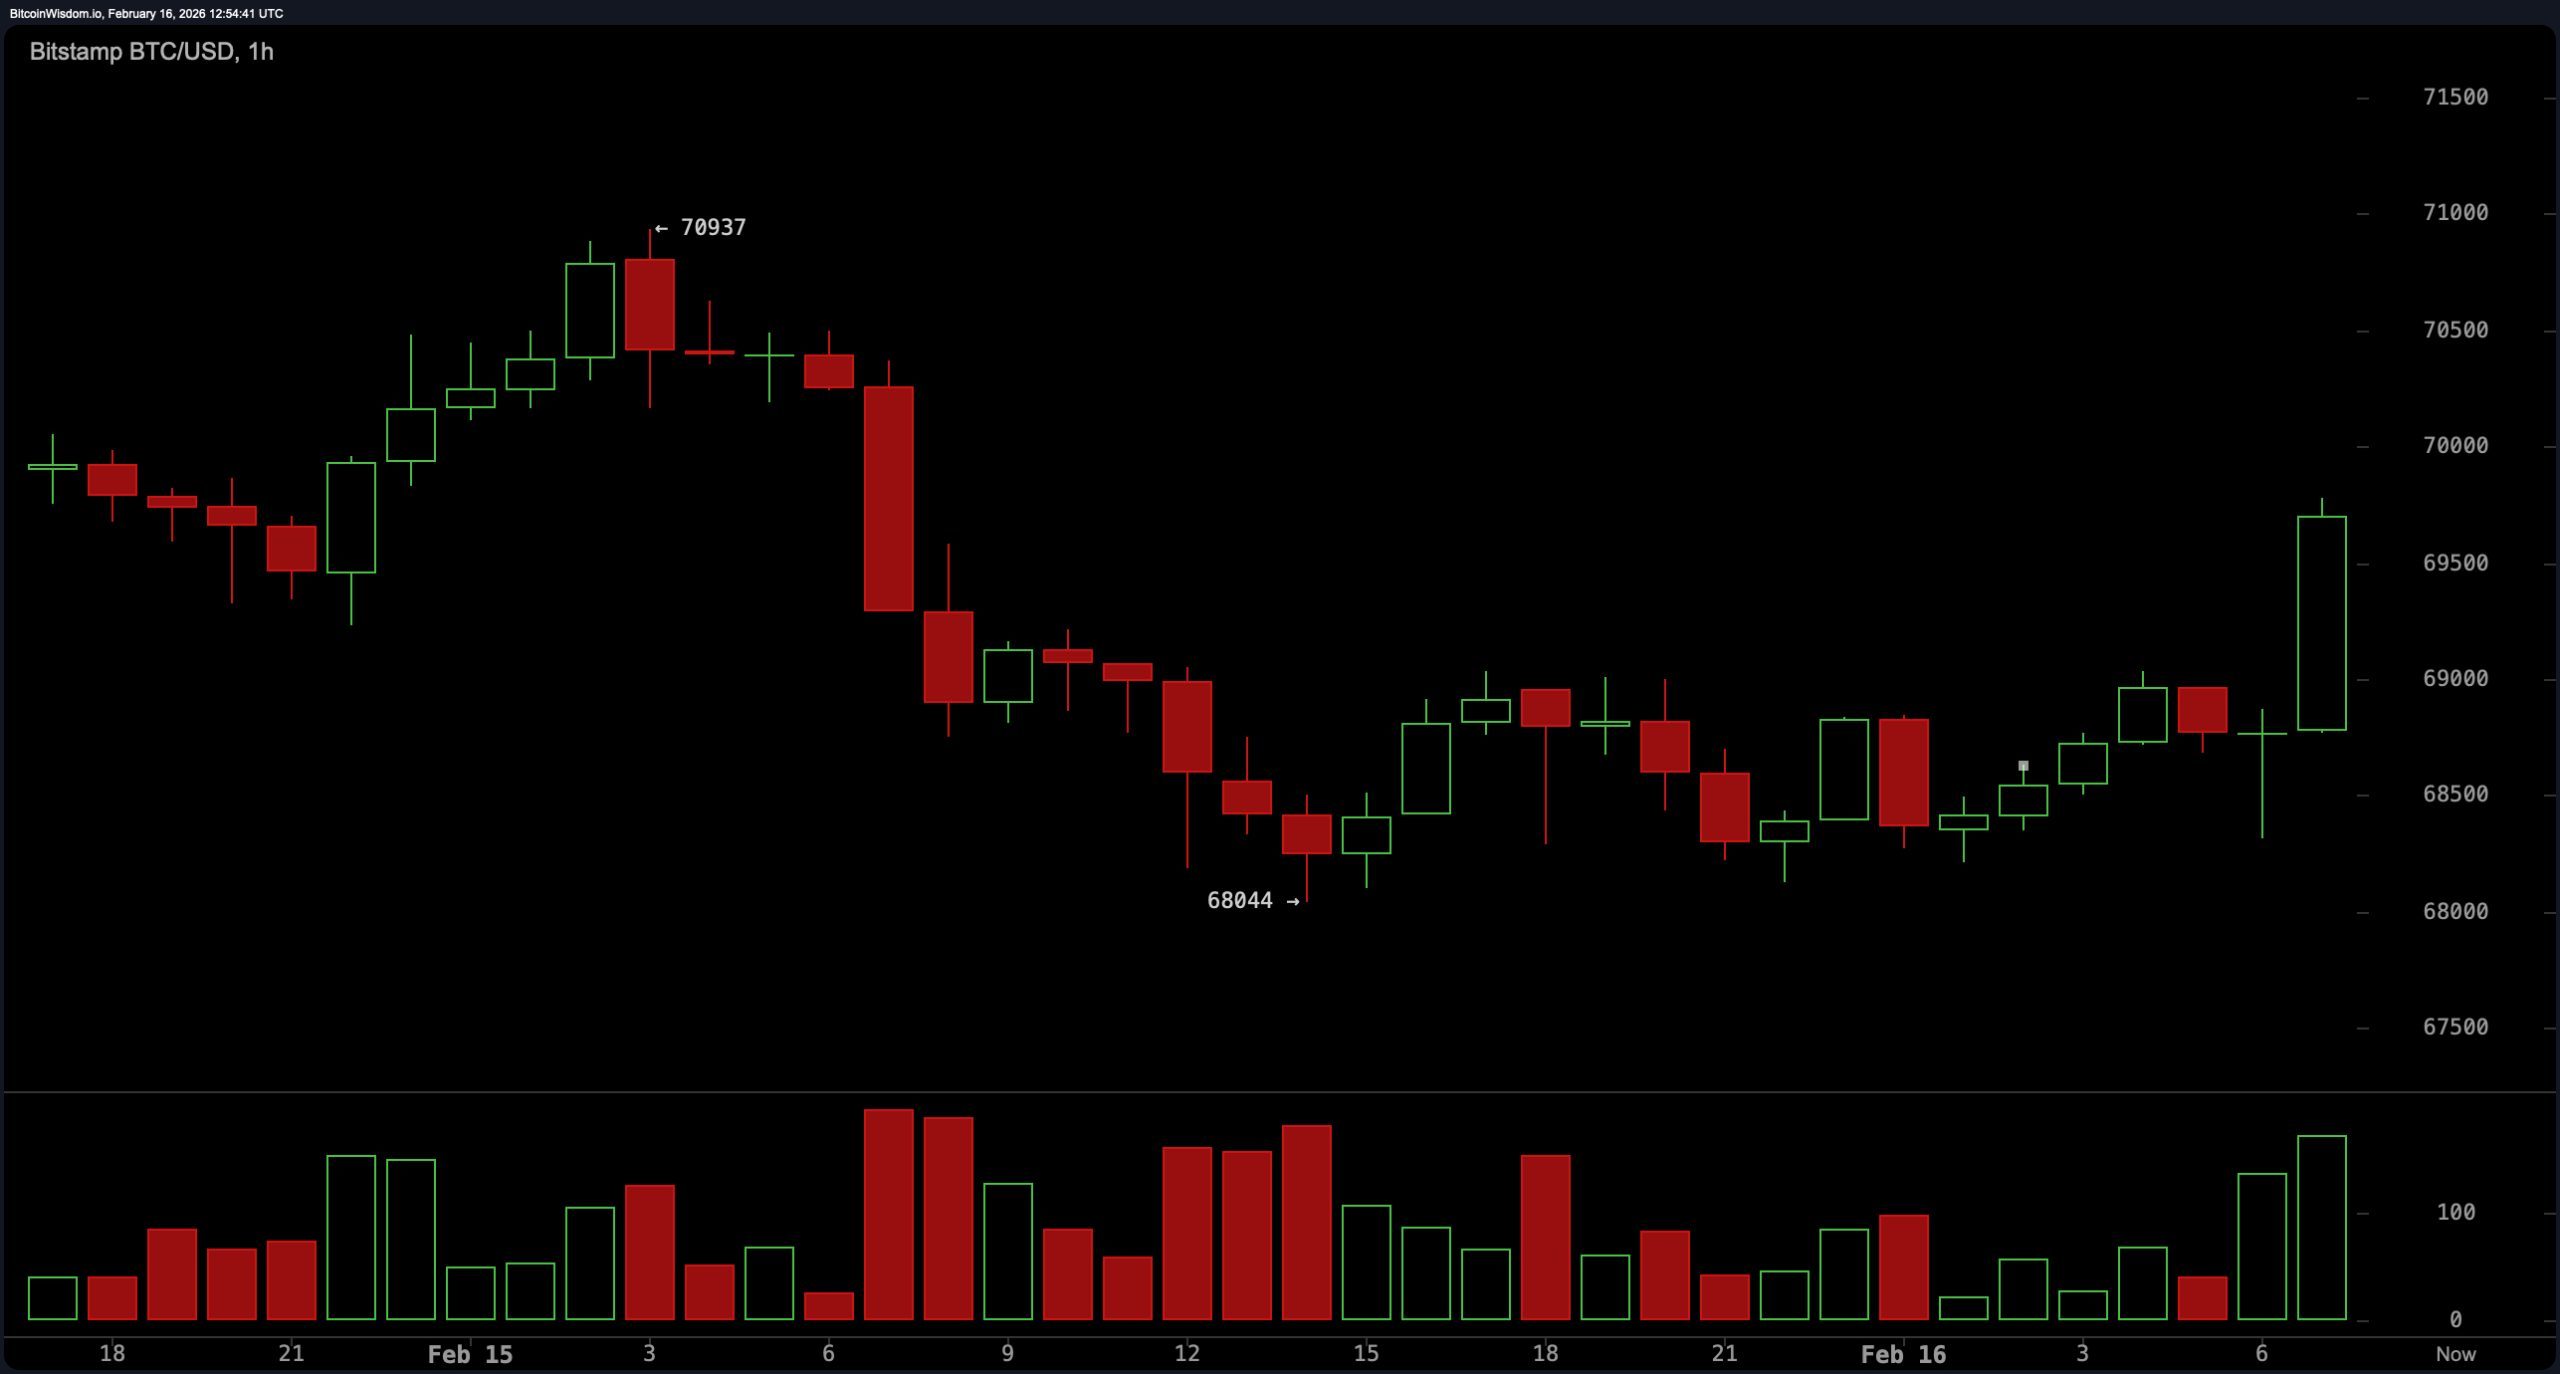
Drilling down to the one-hour chart, execution dynamics are constructive. A local low near $68,044 has been followed by gradually higher lows, with the current impulse candle pressing toward $70,000 on increasing volume. Immediate resistance rests at $70,900 to $71,000. Minor support sits at $68,800, with stronger structural support near $68,000. The price action suggests accumulation attempts, but the market is approaching a decision point. Bitcoin is knocking — whether the door opens or slams shut depends on follow-through.
Oscillators present a mixed, almost theatrical backdrop. The relative strength index ( RSI) reads 38, the stochastic oscillator prints 49, and the commodity channel index (CCI) stands at negative 48 — all categorized as neutral. The average directional index (ADX) at 56 signals trend strength, though without directional bias. The awesome oscillator prints negative 12,308, also neutral, while momentum shows negative 871. The moving average convergence divergence ( MACD) level sits at negative 4,816. In short: momentum remains fragile, and conviction is not exactly bursting at the seams.
Moving averages (MAs) remain decisively skewed to the downside on the daily chart. The exponential moving average (EMA) (10) is $69,831, and the simple moving average (SMA) (10) is $68,868; the EMA (20) is $73,312, and the SMA (20) is $73,134; the EMA (30) is $76,402, and the SMA (30) is $78,619. Higher time-frame pressure persists with the EMA (50) at $80,678, SMA (50) at $83,874, EMA (100) at $87,453, SMA (100) at $87,355, EMA (200) at $93,865, and SMA (200) at $100,331 — with price trading below most of these levels, reinforcing the broader corrective structure.
Market psychology reinforces the technical landscape. The $60,000 zone likely marked a panic-driven liquidity sweep, followed by a relief rally that is now confronting structural resistance near $71,000. Reclaiming that level would signal a potential trend-shift attempt. Rejection would reinforce continuation risk toward $69,000, $65,000, and potentially the $60,000 region. For now, bitcoin sits at the crossroads — and as always, it will not ask for permission before making its next move.
Bull Verdict:
If bitcoin secures a confirmed four-hour close above $71,000 and sustains acceptance above that level, the technical structure shifts materially. Such a move would validate the ascending formation on the four-hour chart, challenge the daily lower-high sequence and open a measured path toward $72,500 to $75,000. With the average directional index (ADX) at 56 signaling strong trend conditions and short-term higher lows forming, sustained strength above resistance would suggest momentum expansion rather than mere relief.
Bear Verdict:
Failure to reclaim $71,000 — particularly if accompanied by rejection near $70,900 to $71,000 — keeps the broader daily downtrend intact. A break below $68,800 weakens short-term structure, while a four-hour close under $67,800 increases downside risk toward $65,000 and potentially the $59,900 to $60,000 region. With price trading below the majority of exponential moving averages and simple moving averages across key periods, the larger corrective framework remains structurally dominant unless proven otherwise.
FAQ ❓
- What is the bitcoin price on Feb. 16, 2026? bitcoin is trading at $69,393 with a 24-hour range between $68,095 and $70,220.
- What are bitcoin’s key resistance levels right now? Immediate resistance sits at $70,900 to $71,000, with major resistance near $75,000.
- What are the most important bitcoin support levels? Key support levels are $68,800, $68,000 and $65,000, with major support at $59,900 to $60,000.
- Is bitcoin in an uptrend or downtrend? The daily chart structure remains in a broader downtrend unless price reclaims and holds above $71,000 to $75,000.