
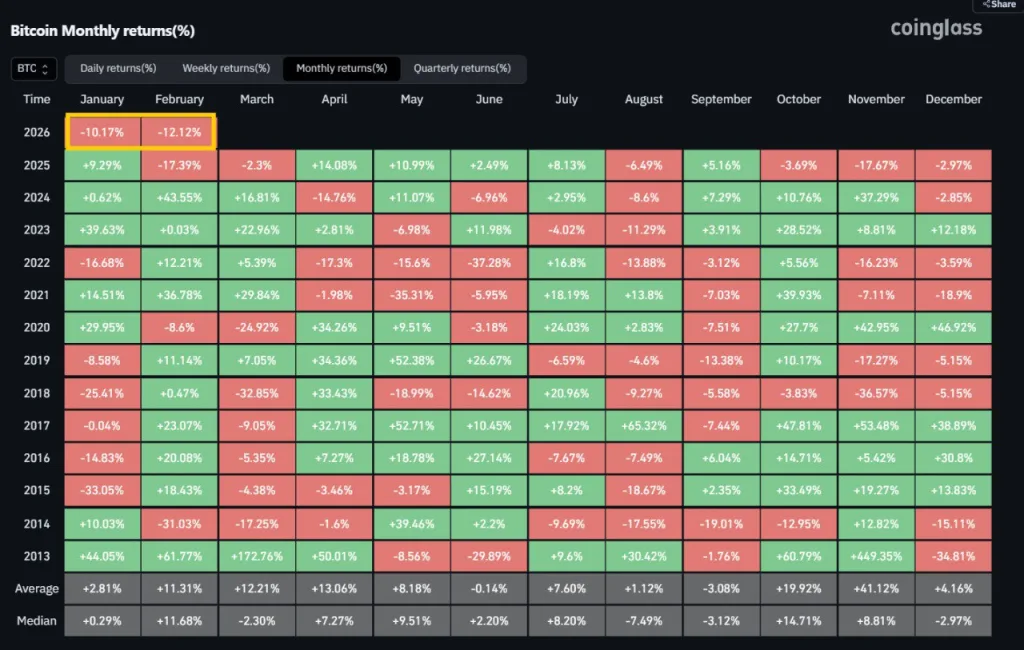
- Bitcoin logs its first-ever January and February losses together in a single calendar year.
- Institutional caution grows as U.S. spot Bitcoin ETFs record over $410M in net outflows.
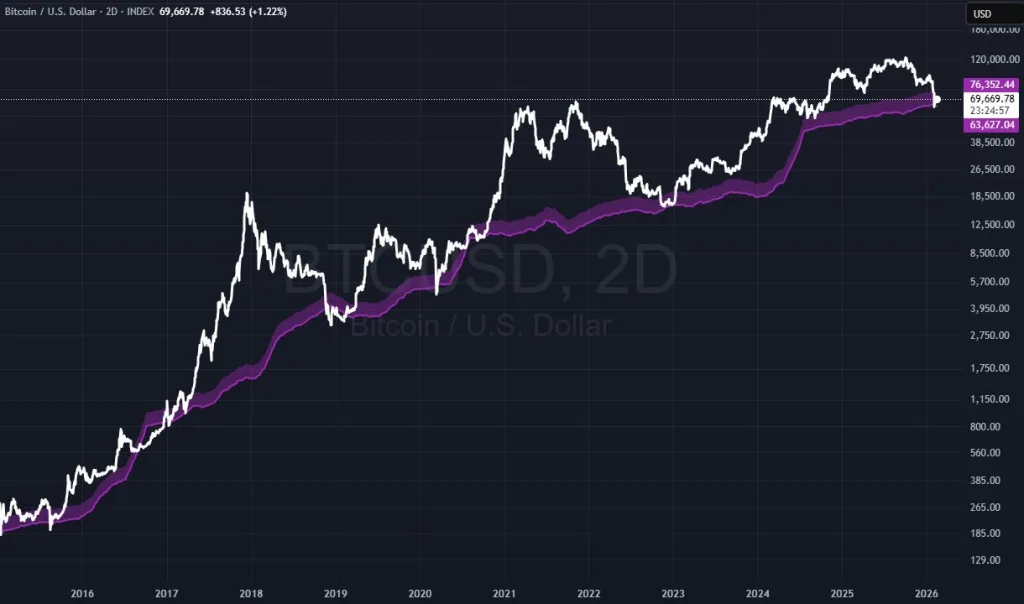
- Long-term trend markers reappear as Bitcoin retests levels tied to past market turning points.
Bitcoin has opened 2026 with a statistical first. For the first time on record, the asset closed both January and February in the red within the same calendar year. Market data from CoinGlass shows January ended down 10.17%, followed by a 12.12% decline in February.
The back-to-back losses stand out against more than a decade of monthly return data. Since 2013, early-year performance has often set the tone for broader cycles. This time, however, the pattern has shifted, with the price now trading below $70,000 and institutional flows turning negative.
Current Price Structure and ETF Flows
January has always been an uneven month for Bitcoin, sometimes up, often down, but usually tame when averaged out over time. Per records, long-term numbers hover at a modest +2.81% on average, with a median near break-even.
Even years that opened in the red typically recovered by February. Historically, this month has been far more supportive. Across more than a decade of tracked returns, the month posts an average gain of +11.31% and a median of +11.68%.
Source: X
Several cycles recorded standout performances, including 2013’s +61.77%, 2017’s +23.07%, 2021’s +36.78%, and the sharp rebound in 2024 at +43.55%. Downside Februaries, however, have also appeared in 2014, 2020, and 2025, among them, but not in tandem with a January decline of this scale.
The 2026 combination has no prior match in the monthly heatmap. Seasonal data usually shows a lift as spring approaches. March and April tend to rank among stronger stretches, averaging +12.21% and +13.06%.
Later in the year, October and November frequently deliver outsized returns. September, nonetheless, remains the historical drag, averaging -3.08%, which makes the early-year slump stand out even more.
Price Action and ETF Pressure
At press time, Bitcoin trades around $68,278, down roughly 3% on the day, with volume slipping to $37.58 billion. Besides, the price sits below short- and medium-range moving averages: $68,677 over seven days and $78,588 over 30. These levels are not rigid signals on their own, yet together they show a market losing momentum rather than building it.
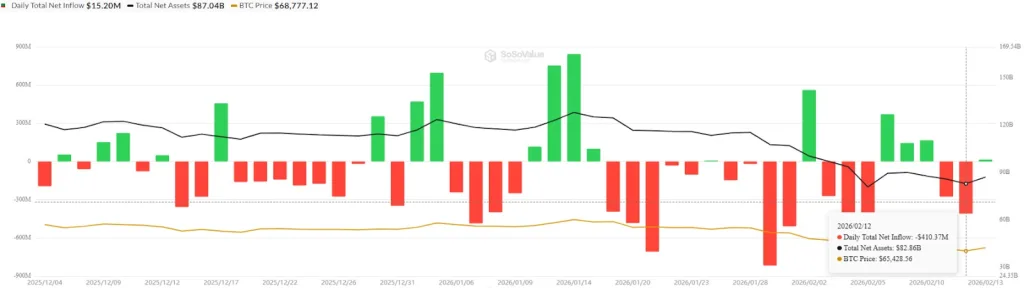
Source: SoSoValue
A second day of heavy withdrawals from U.S. spot Bitcoin ETFs has added strain. SoSoValue recorded $410.37 million in net outflows on Feb. 12, underscoring a risk-off tilt among institutional desks. ETF inflows helped drive prior rallies; outflows now serve as the opposite force, draining support during a delicate stretch.
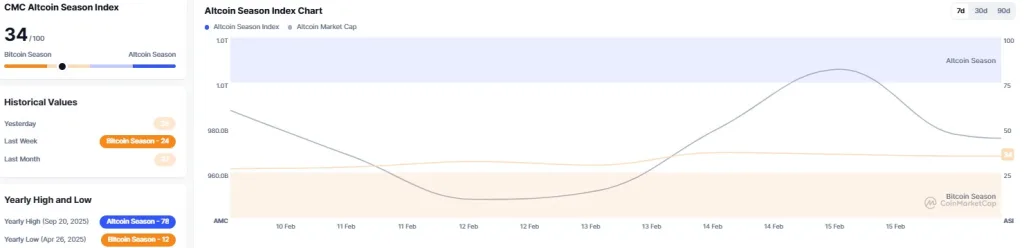
Source: CoinMarketCap
Meanwhile, the CMC Altcoin Season Index has dropped to 34 after a sharp slide, suggesting a pullback into liquidity over speculation. Traders appear more focused on capital preservation than rotation into smaller assets.
Related: PIPPIN Price Soars 50% to $0.28: Can the Bull Run Break Higher?
Long-Term Indicators Reenter View
Analysts watching broader cycle markers are revisiting levels that previously aligned with turning points. According to market researcher Master of Crypto, Bitcoin spent about 270 days under its 200-week moving average before climbing back above it.
Bitcoin spent ~270 days below the 200W MA before reclaiming it.
— Master of Crypto (@MasterCryptoHq) February 16, 2026
Then another ~220 days of sideways chop before the real breakout.
Nearly 500 days of testing one key level.
Now price is pulling back toward the 200W MA again.
If history repeats, this zone is not the end – it’s… pic.twitter.com/xEsqu9v4tU
Once reclaimed, it drifted sideways for nearly 220 days. In total, the interaction with that long-term trend stretched across roughly 500 days before the next expansion phase. That historical pattern matters again as price leans back toward the same multi-year average.
Another indicator gaining attention is the estimated production cost. Analyst Michael Van De Poppe notes that the spot price is approaching the lower boundary of miners’ expense models. Similar compressions appeared near major cycle lows in 2015, 2018, and 2022. Each time, the price hovered near production cost before broader market conditions shifted.
Source: X
With Bitcoin still under $70,000, ETFs shedding capital, and historical baselines reappearing in analysis, the early months of 2026 are shaping up as an unusually heavy start to the year, one without a clear historical parallel.
Disclaimer: The information provided by CryptoTale is for educational and informational purposes only and should not be considered financial advice. Always conduct your own research and consult with a professional before making any investment decisions. CryptoTale is not liable for any financial losses resulting from the use of the content.