
Bitcoin shows signs of weakening bearish pressure and key support levels, with a potential shift toward a significant upward movement.
Bitcoin ($BTC) is priced at $68,385.76, with the price action showing a sharp retracement from a daily high of $70,897.84. This kind of volatility, with a range of $68,095 to $70,897 in just 24 hours, points to ongoing market uncertainty.
Looking at Bitcoin’s performance metrics over various timeframes, the 1-hour chart shows a mild 0.4% decline, while the past 24 hours show a more significant 2.7% drop, compounded by a 3.9% loss over the past 7 days. Even more concerning is the 28.1% drop over the last 30 days.
Despite the retracement, Bitcoin remains above the $68K level, a critical zone that traders will be closely watching for support. If Bitcoin fails to hold these levels, the next major support might be closer to $65K.
Bitcoin Price Analysis
On the technical side, Bitcoin’s 1-day Relative Strength Index shows a reading of 35.54, indicating that Bitcoin is in oversold territory, though still above the critical threshold of 30. Historically, a dip below the 30 level would signal strong oversold conditions, but the current RSI suggests that Bitcoin could be nearing a short-term bottom or at least a brief consolidation phase.
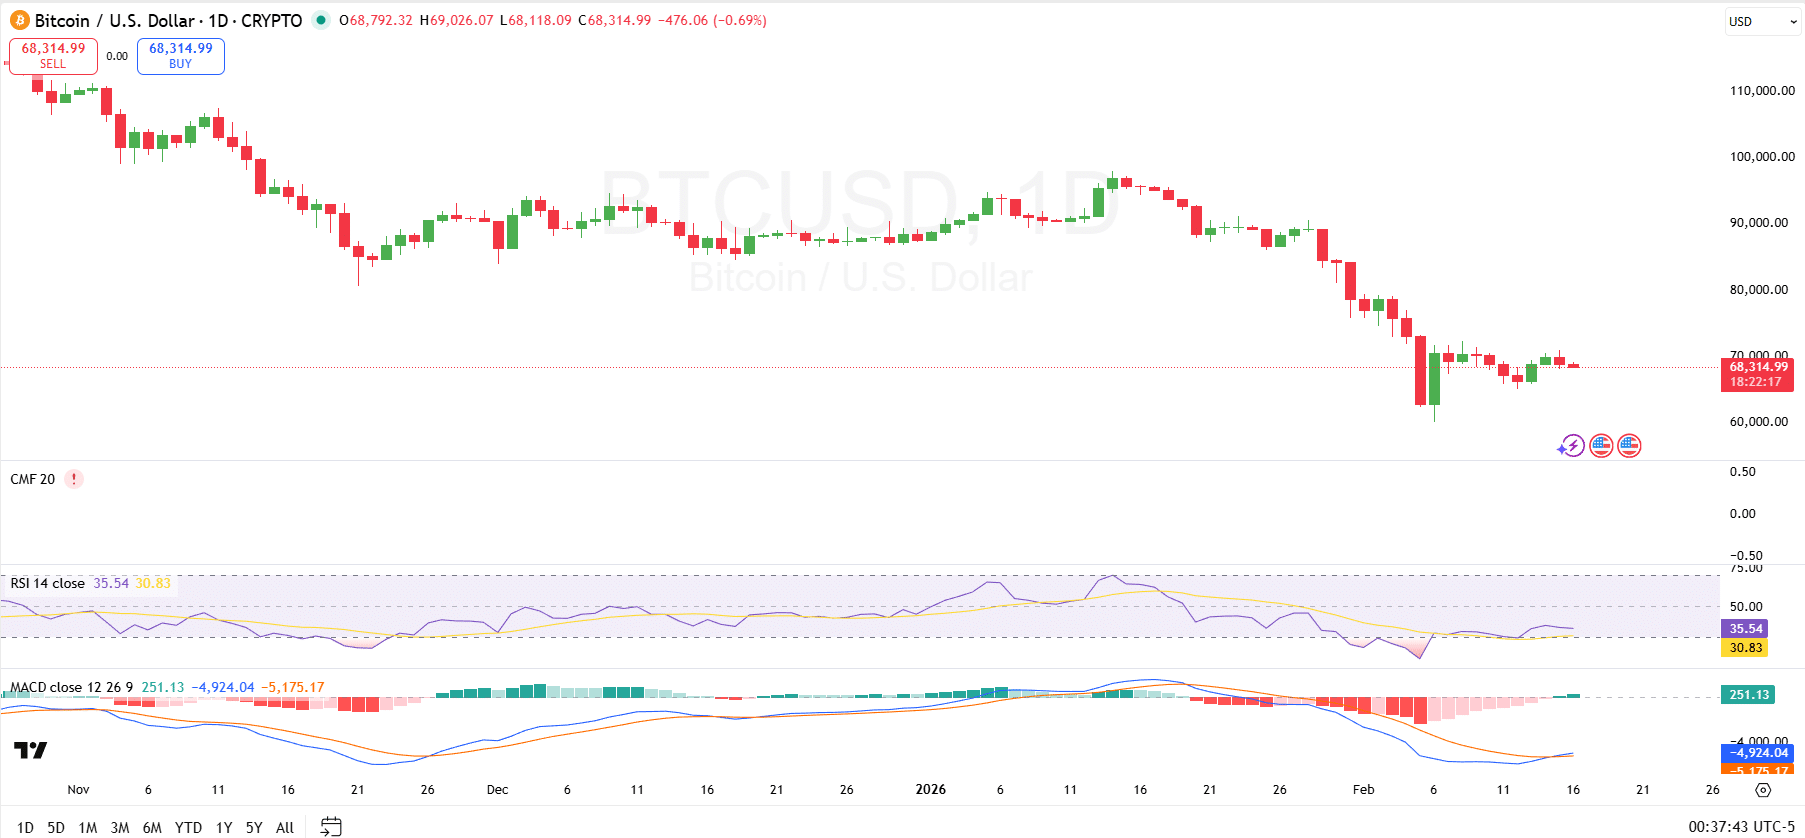
In terms of support and resistance, Bitcoin has held steady above the $68,000 mark, which now acts as key support. A breakdown below this level could lead to further declines, with further potential support levels near $65,000 or $60,000.
On the upside, $70,000 represents the immediate resistance, followed by the more significant $72,000 level, where Bitcoin previously encountered selling pressure. If Bitcoin manages to reclaim and hold above $70,000, it may open the door to a more sustained rally.
Looking at the Moving Average Convergence Divergence, the histogram bars are shrinking, indicating a potential loss of momentum in the recent bearish move. The MACD line is currently crossing below the signal line, which is a bearish crossover and suggests that the downward trend could continue unless there is a quick recovery. The histogram is also showing green bars, which indicate that the current downtrend is weakening.
Here’s Bitcoin’s Execution Plan
Elsewhere, Whale Factor on X has shared a detailed $BTC execution plan. According to the plan, after peaking at an all-time high of $126,000 in October 2025, Bitcoin entered a correction phase around $70,000, which is a 44%+ drawdown from the ATH.

The next phase, Spring, is expected to bring Bitcoin down to $37,000 to reset the RSI before the next bull run. The following run could then launch Bitcoin to levels like $260,000.
Whale Factor advises not to fight the historical trend, suggesting a 70-80% correction before the next major move. From the current price of $68,385.76, the projected target of $260,000 represents a 280.3% potential surge in Bitcoin’s price.