
Bitcoin’s price is $67,925 this morning at 8 a.m. EST, giving the asset a market capitalization of $1.35 trillion, with $51.15 billion in 24-hour trading volume and an intraday range between $65,932 and $68,371. The leading crypto asset is consolidating beneath a heavy resistance band as a relief rally collides with a structurally bearish higher-timeframe trend, with momentum attempting to stabilize even as the broader technical posture suggests the market still has something to prove.
Bitcoin Chart Outlook
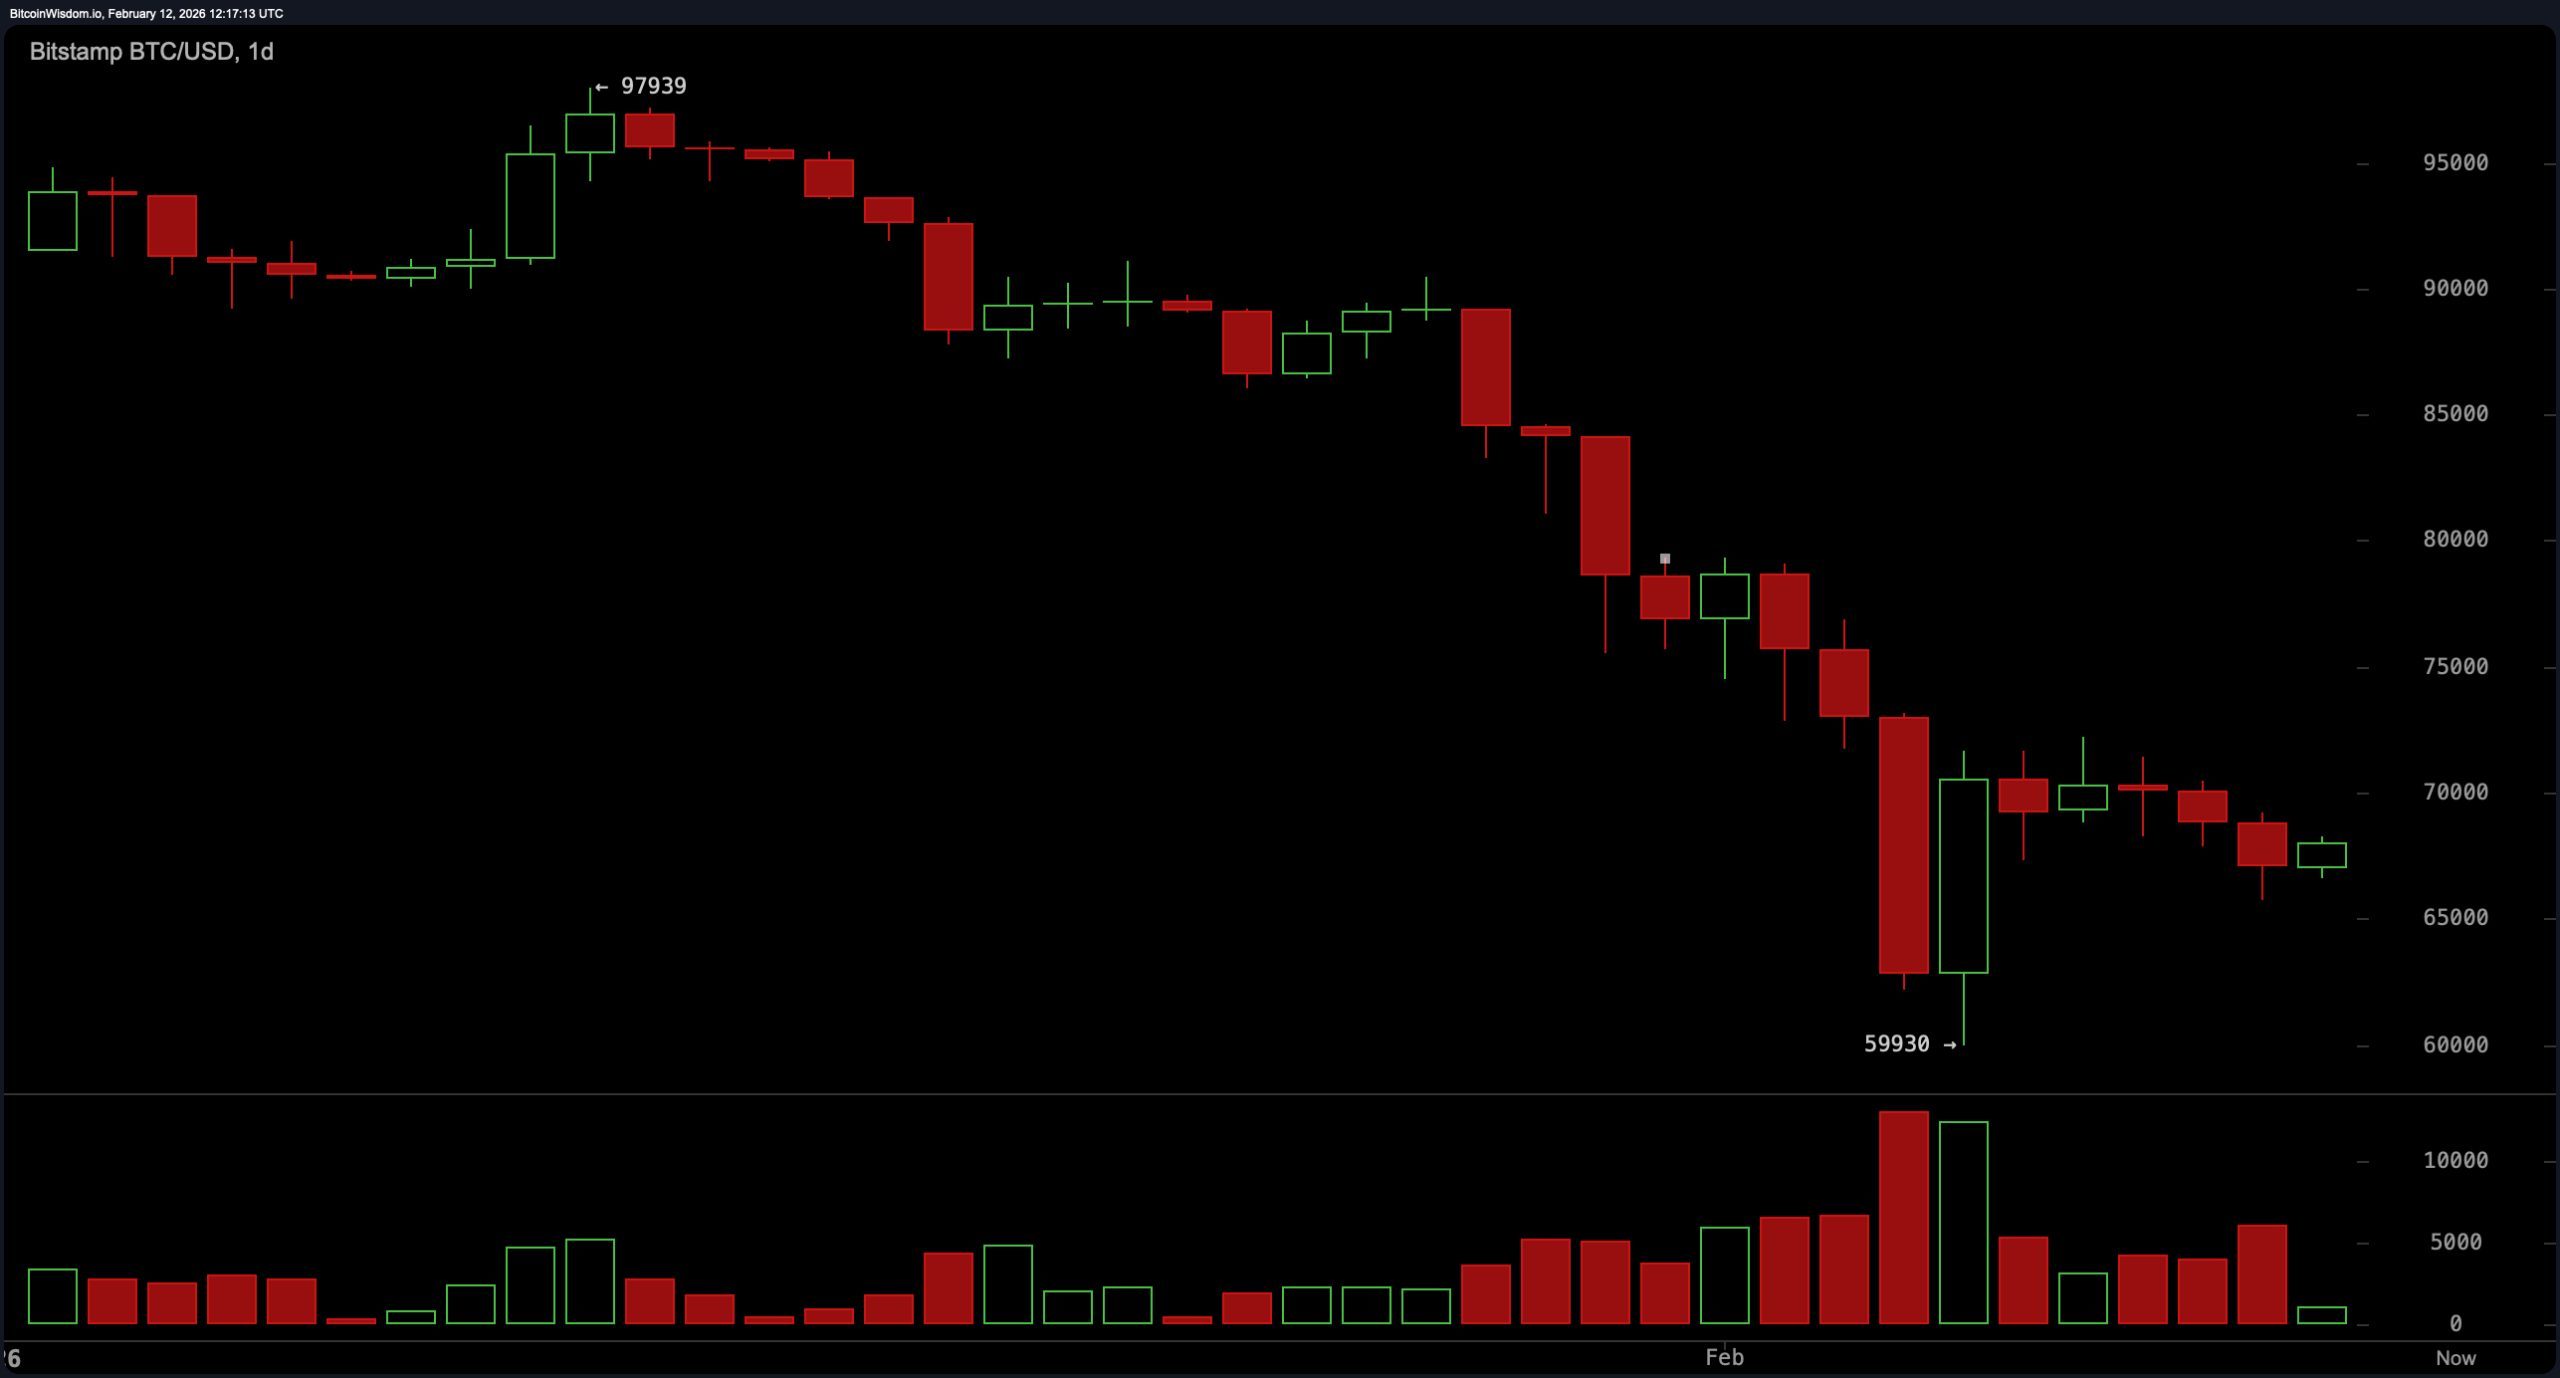
The daily chart continues to reflect a bearish macro structure, defined by a series of lower highs and lower lows following a sharp rejection near $97,900. A capitulation wick toward approximately $59,930 marked an exhaustion event, followed by a rebound into the $68,000 to $70,000 region, where price is now compressing. Major resistance remains between $70,000 and $72,000, with a broader supply zone extending from $75,000 to $80,000. Support is established at $60,000, and a breakdown below $59,000 exposes the $52,000 to $54,000 range. Until bitcoin reclaims $72,000 with strong volume, the daily bias remains tilted to the downside.
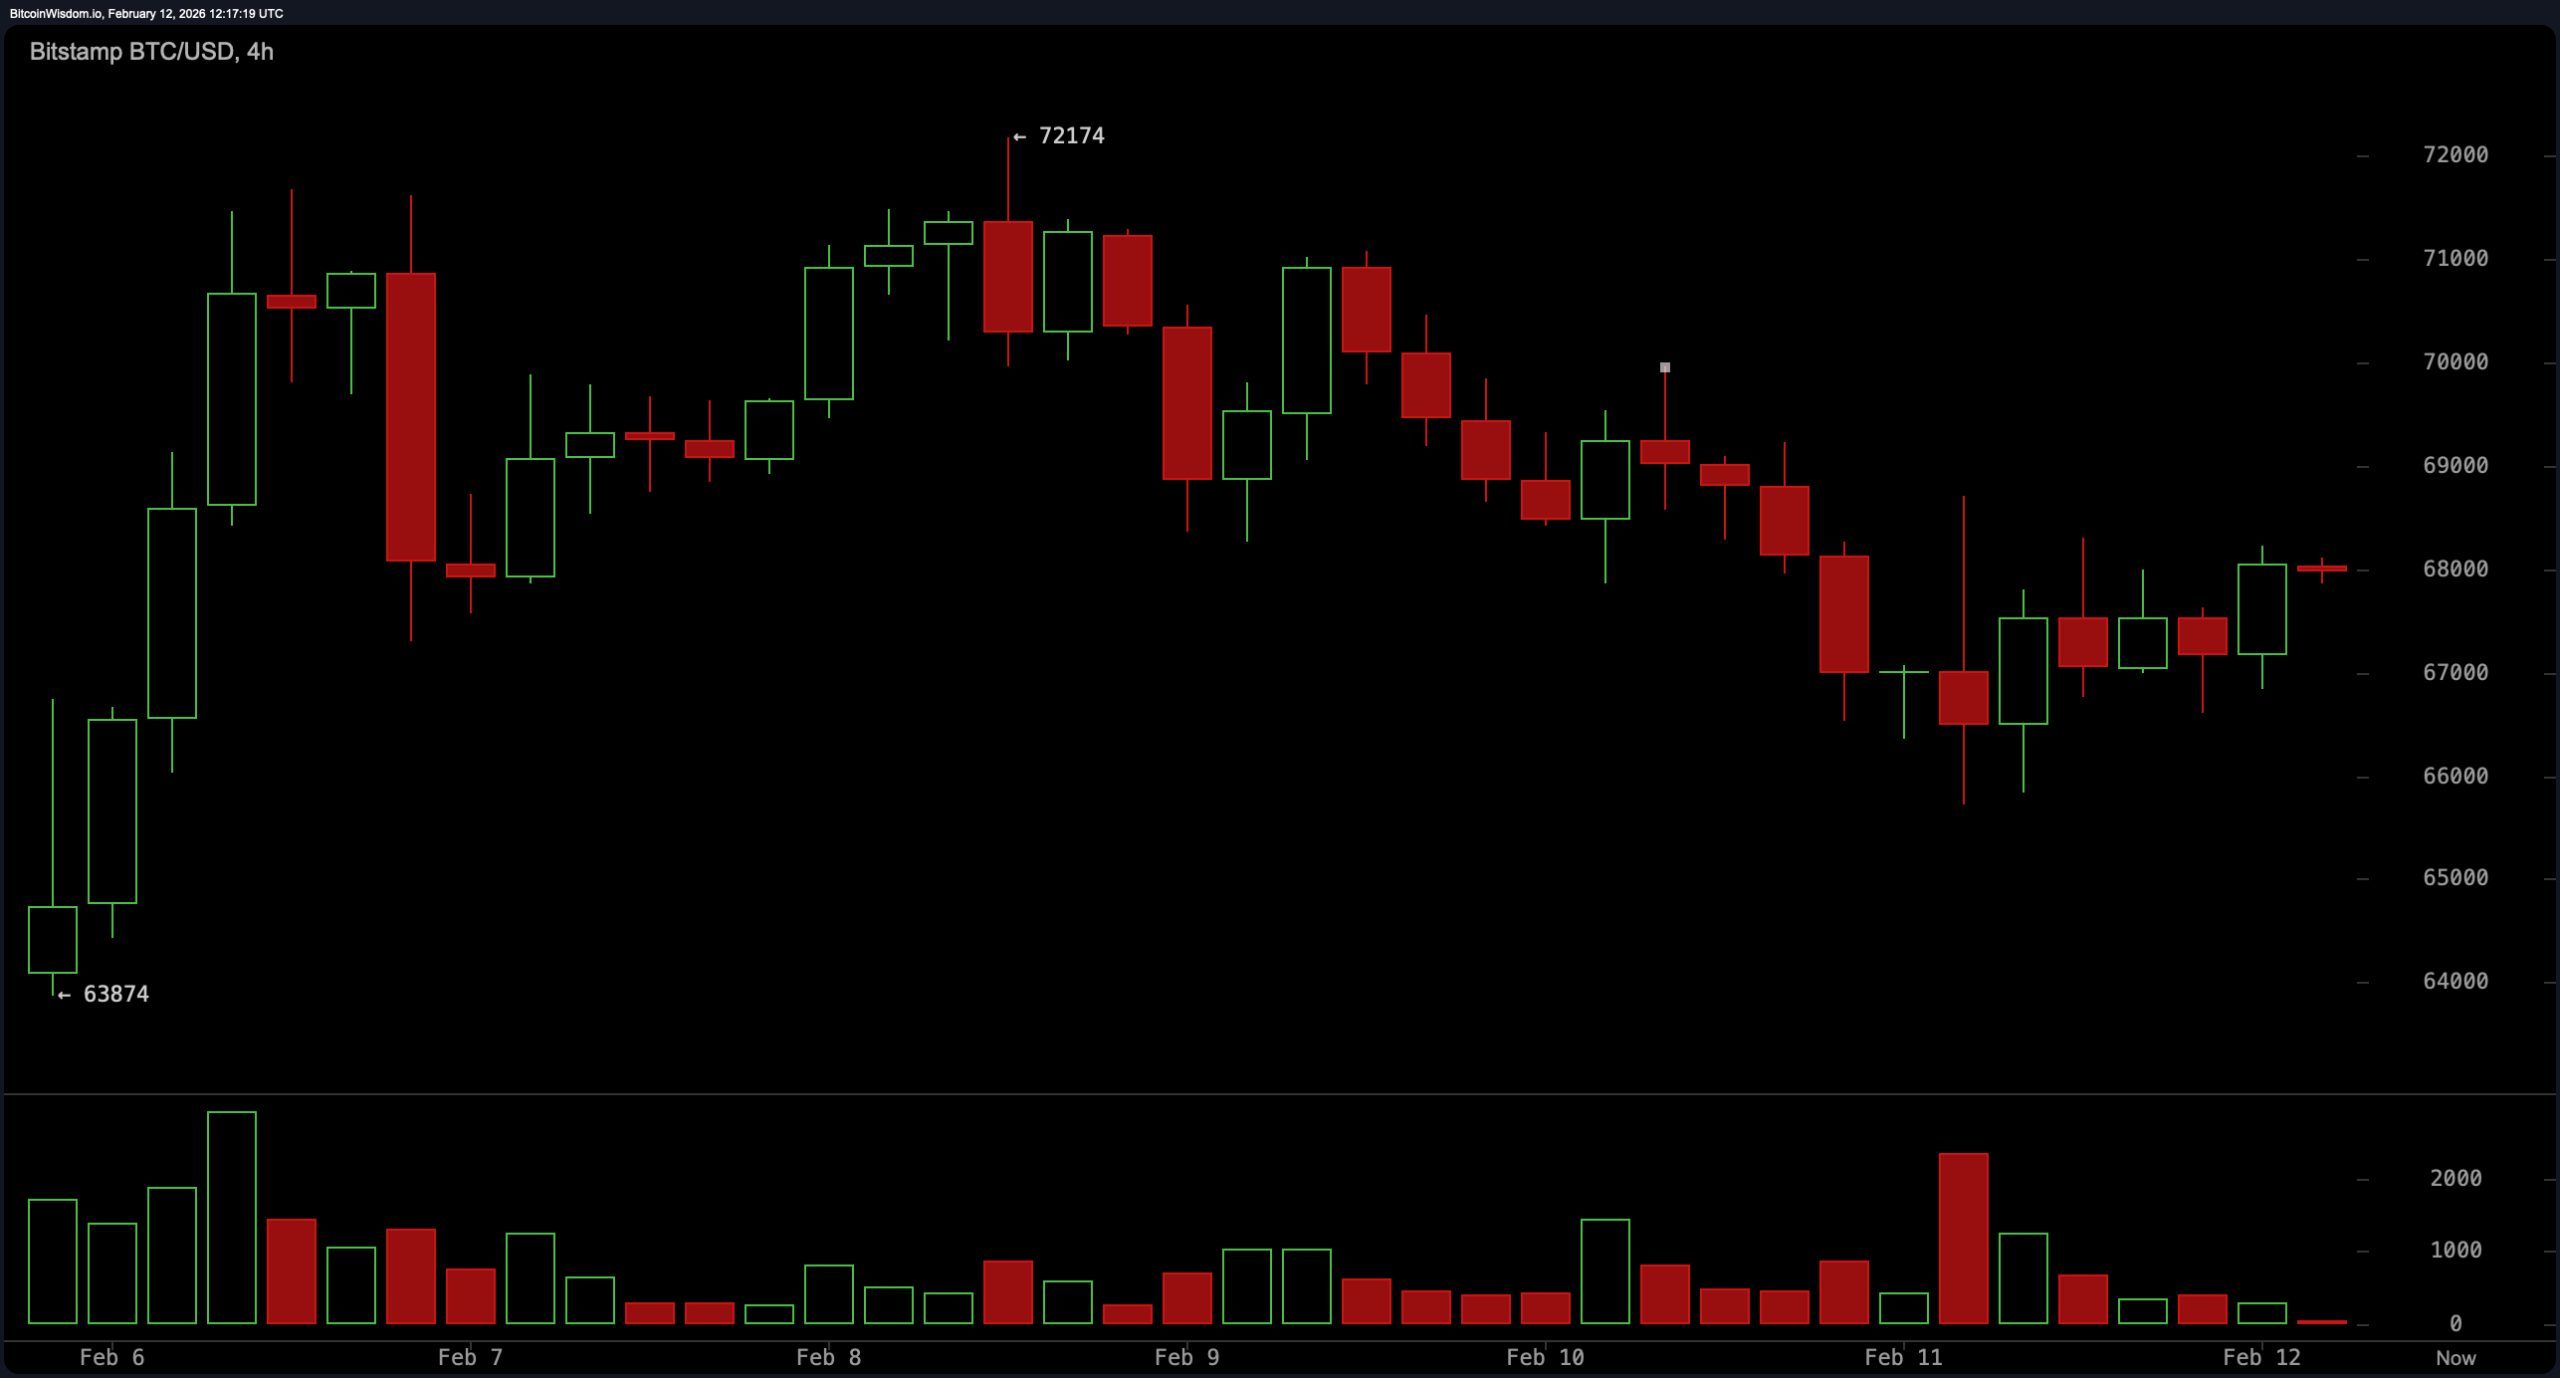
On the four-hour timeframe, price action shows a corrective bounce forming within that broader downtrend. A recent low around $66,000 has given way to a grind higher toward $68,000 and $69,000, but volume is declining on the advance, signaling weak conviction. Resistance is concentrated between $69,500 and $71,000, while intraday support sits at $66,000 with a key breakdown level at $64,000. Structurally, this resembles a textbook corrective move rather than a decisive trend shift — the kind of bounce that looks optimistic until it meets overhead supply.
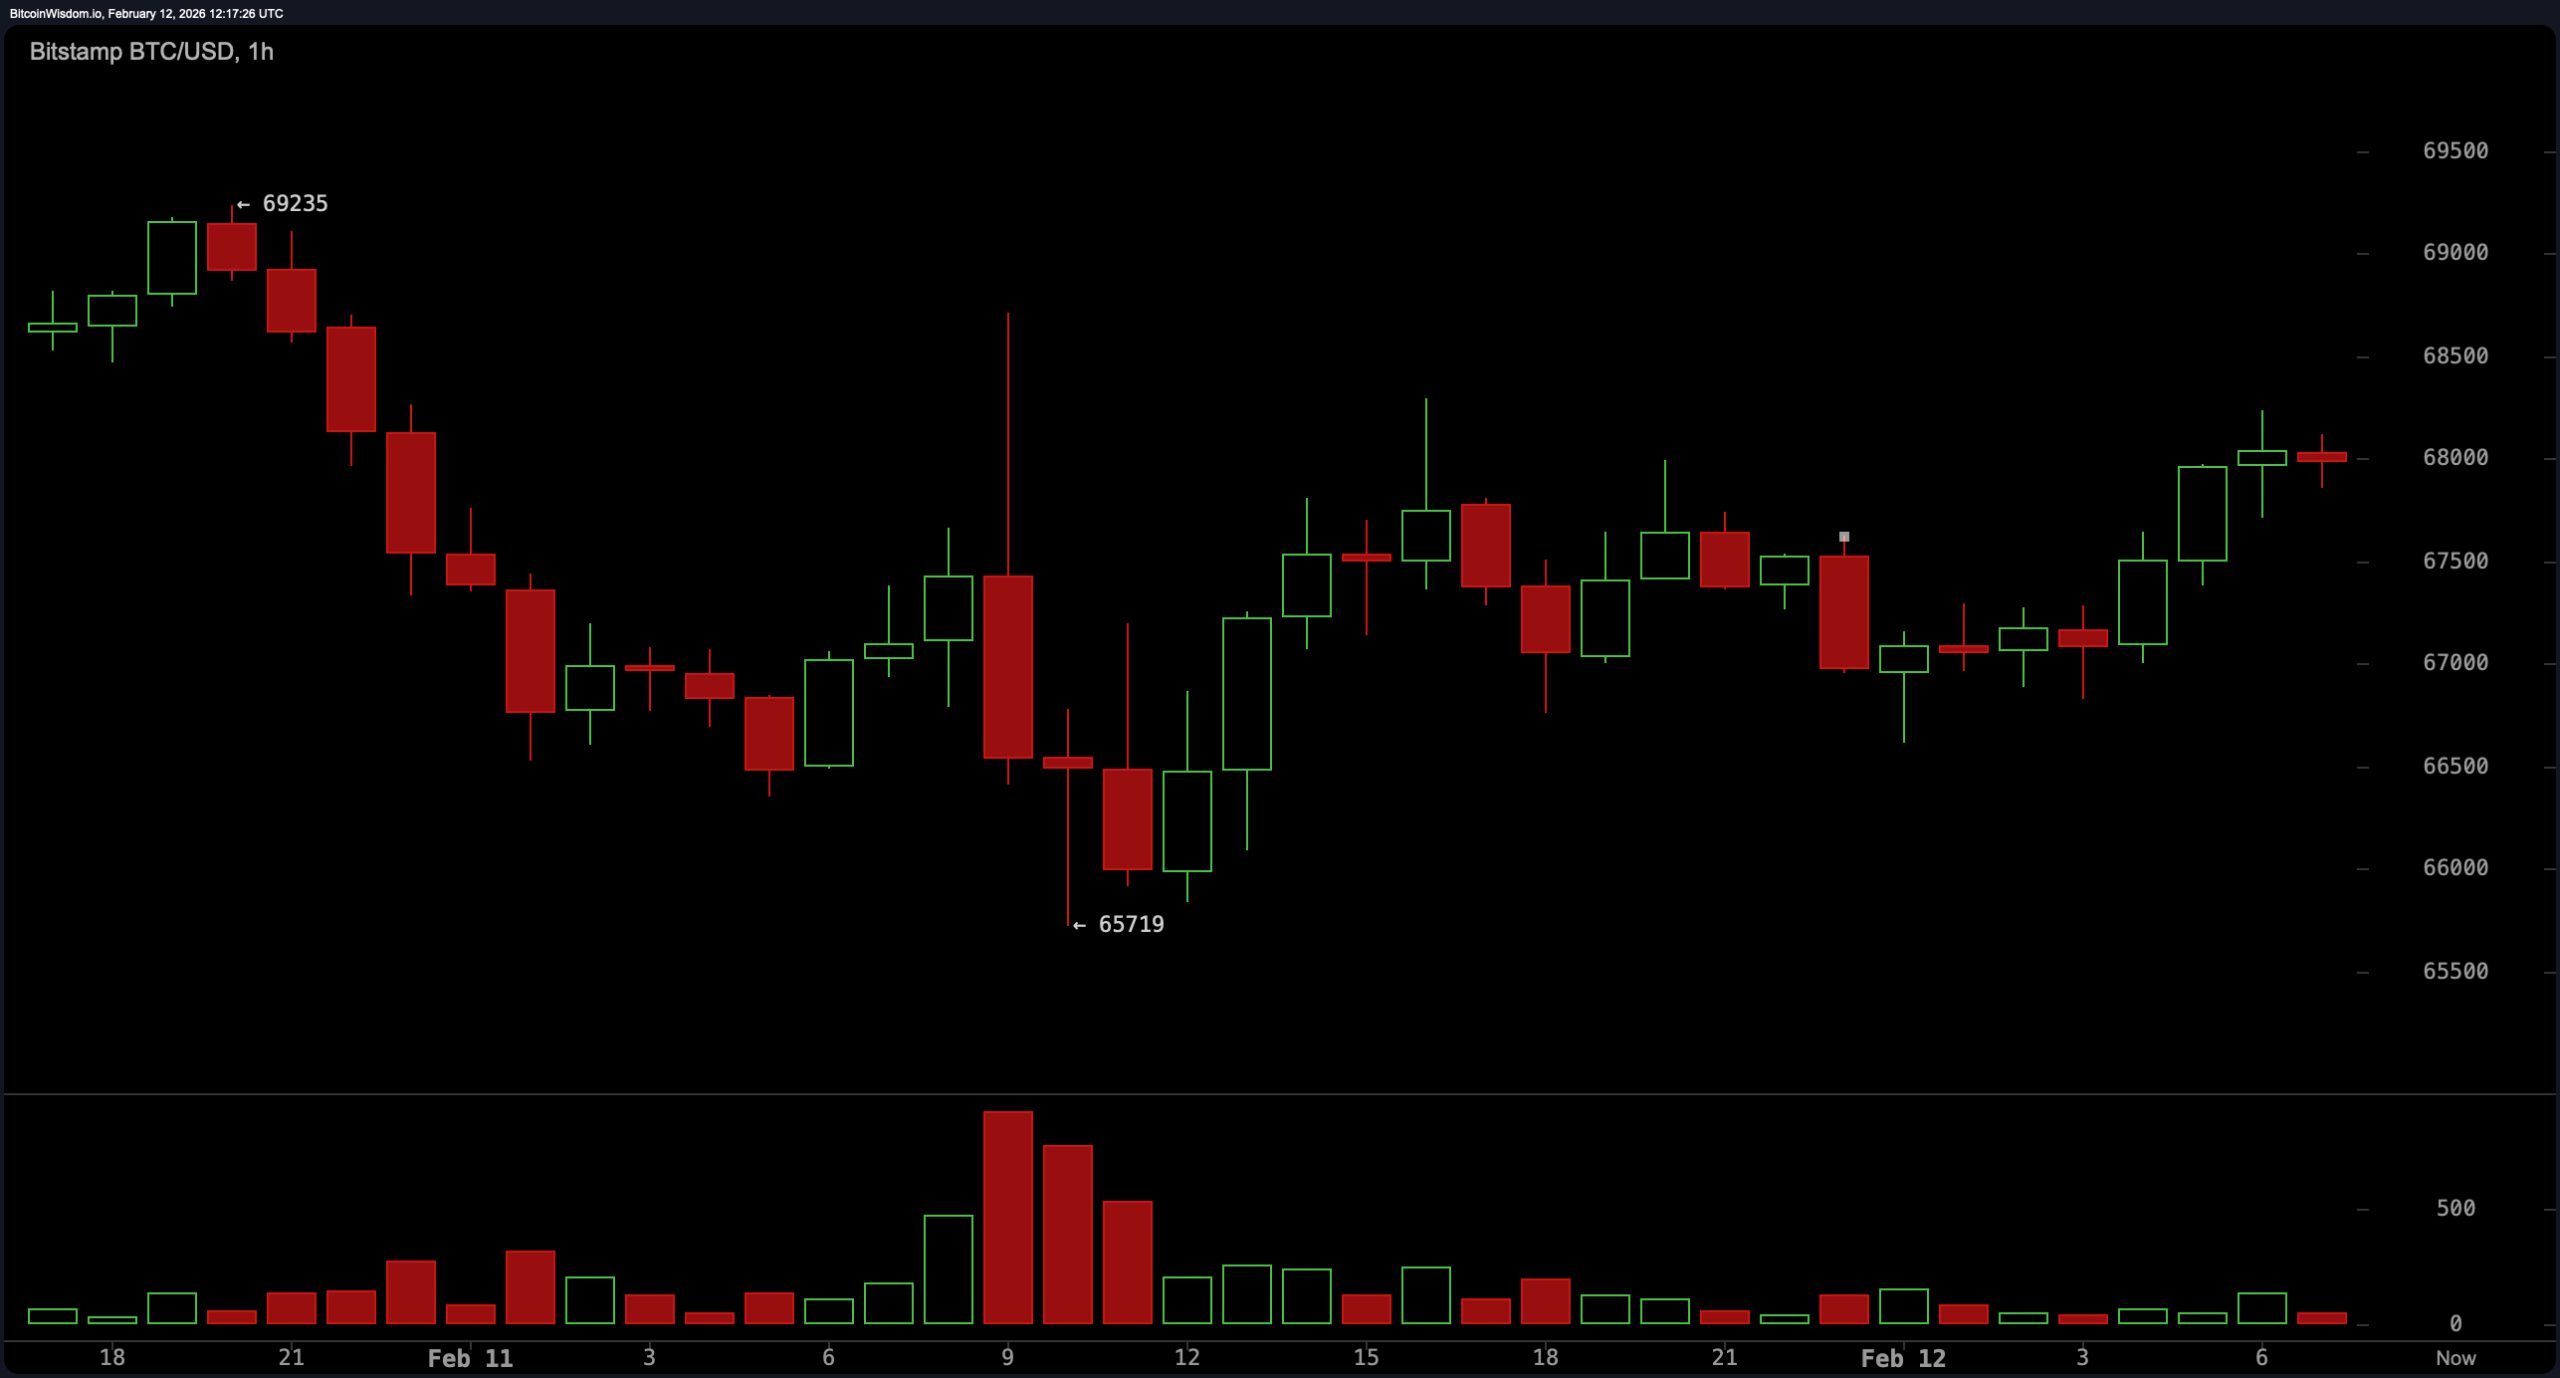
The one-hour chart presents a more constructive short-term picture, with a modest higher-high and higher-low pattern signaling near-term bullish momentum. Resistance stands at $68,500 to $69,000, and volume is not described as explosive, meaning any breakout attempt requires confirmation. A sustained move above $69,000 opens the path toward $70,000 to $71,000, while a loss of $67,000 would invalidate that immediate upside scenario. Conversely, failure in the $69,000 to $70,000 region could rotate price back toward $66,000 and potentially $64,000. Short-term optimism is present — but it is trading inside a larger bearish framework.
Oscillators reflect a market stabilizing but not yet reversing. The relative strength index ( RSI) reads 32 with a neutral signal, hovering near oversold territory. The Stochastic oscillator stands at 29, also neutral. The commodity channel index (CCI) prints negative 85, neutral. The average directional index (ADX) registers 54, neutral, signaling a strong underlying trend environment. The Awesome oscillator shows negative 14,576, neutral. Momentum registers negative 10,705 with a sell indication, and the moving average convergence divergence ( MACD) level stands at negative 5,734 with a sell indication. The bias here is hardly euphoric.
Moving averages remain decisively bearish across the curve. The simple moving average (SMA) and exponential moving average (EMA) continue to flash downside pressure across all major timeframes. The EMA (10) at $70,809 and the SMA (10) at $69,539 both indicate sell. The EMA (20) at $75,466 and the SMA (20) at $77,022 reinforce that weakness. The EMA (30) at $78,695 and the SMA (30) at $82,215 continue the pattern, followed by the EMA (50) at $82,727 and the SMA (50) at $85,372.
Even the longer-term EMA (100) at $89,003 and SMA (100) at $88,709, along with the EMA (200) at $94,887 and SMA (200) at $101,303, all reflect sell signals. In short, the trend structure remains aligned against sustained upside — and reclaiming $72,000 with convincing volume remains the technical line in the sand.
Bull Verdict
If bitcoin can decisively clear and hold above 69,000 on expanding volume, momentum on the one-hour chart could extend toward the 70,000 to 72,000 resistance band. A confirmed reclaim of 72,000 would begin to neutralize the daily bearish structure and challenge the prevailing lower-high pattern. In that scenario, the relief rally evolves into something more structurally meaningful — and the market shifts from reactive bounce to potential trend transition.
Bear Verdict
Failure to sustain strength near 69,000 to 70,000, particularly if accompanied by rising downside volume, keeps the broader downtrend firmly intact. With daily structure still printing lower highs and moving averages universally aligned to the downside, rejection in this resistance band opens the door back toward 66,000, then 64,000, with 60,000 as the next major support. Until 72,000 is reclaimed with conviction, rallies remain technically vulnerable within a dominant bearish framework.
FAQ
- What is bitcoin’s price on Feb. 12, 2026? Bitcoin is trading at $67,925 with a 24-hour range between $65,932 and $68,371.
- Is bitcoin in a bullish or bearish trend right now? The daily and four-hour charts show a bearish trend despite short-term strength on the one-hour timeframe.
- What are the key resistance levels for bitcoin? Major resistance stands at 69,500 to 71,000 short term and 70,000 to 72,000 on the daily chart.
- What are the key support levels for bitcoin? Immediate support sits at 66,000 and 64,000, with major structural support near 60,000.