
Bitcoin is holding a firm line at $68,703 on Feb. 10, 2026, around 8 a.m. Eastern time, carving out a tight intraday range between $68,427 and $71,032. With a market cap of $1.37 trillion and 24-hour trading volume hitting $49.82 billion, it looked like the asset was on a coffee break—buzzing, but not going anywhere fast.
Bitcoin Chart Outlook
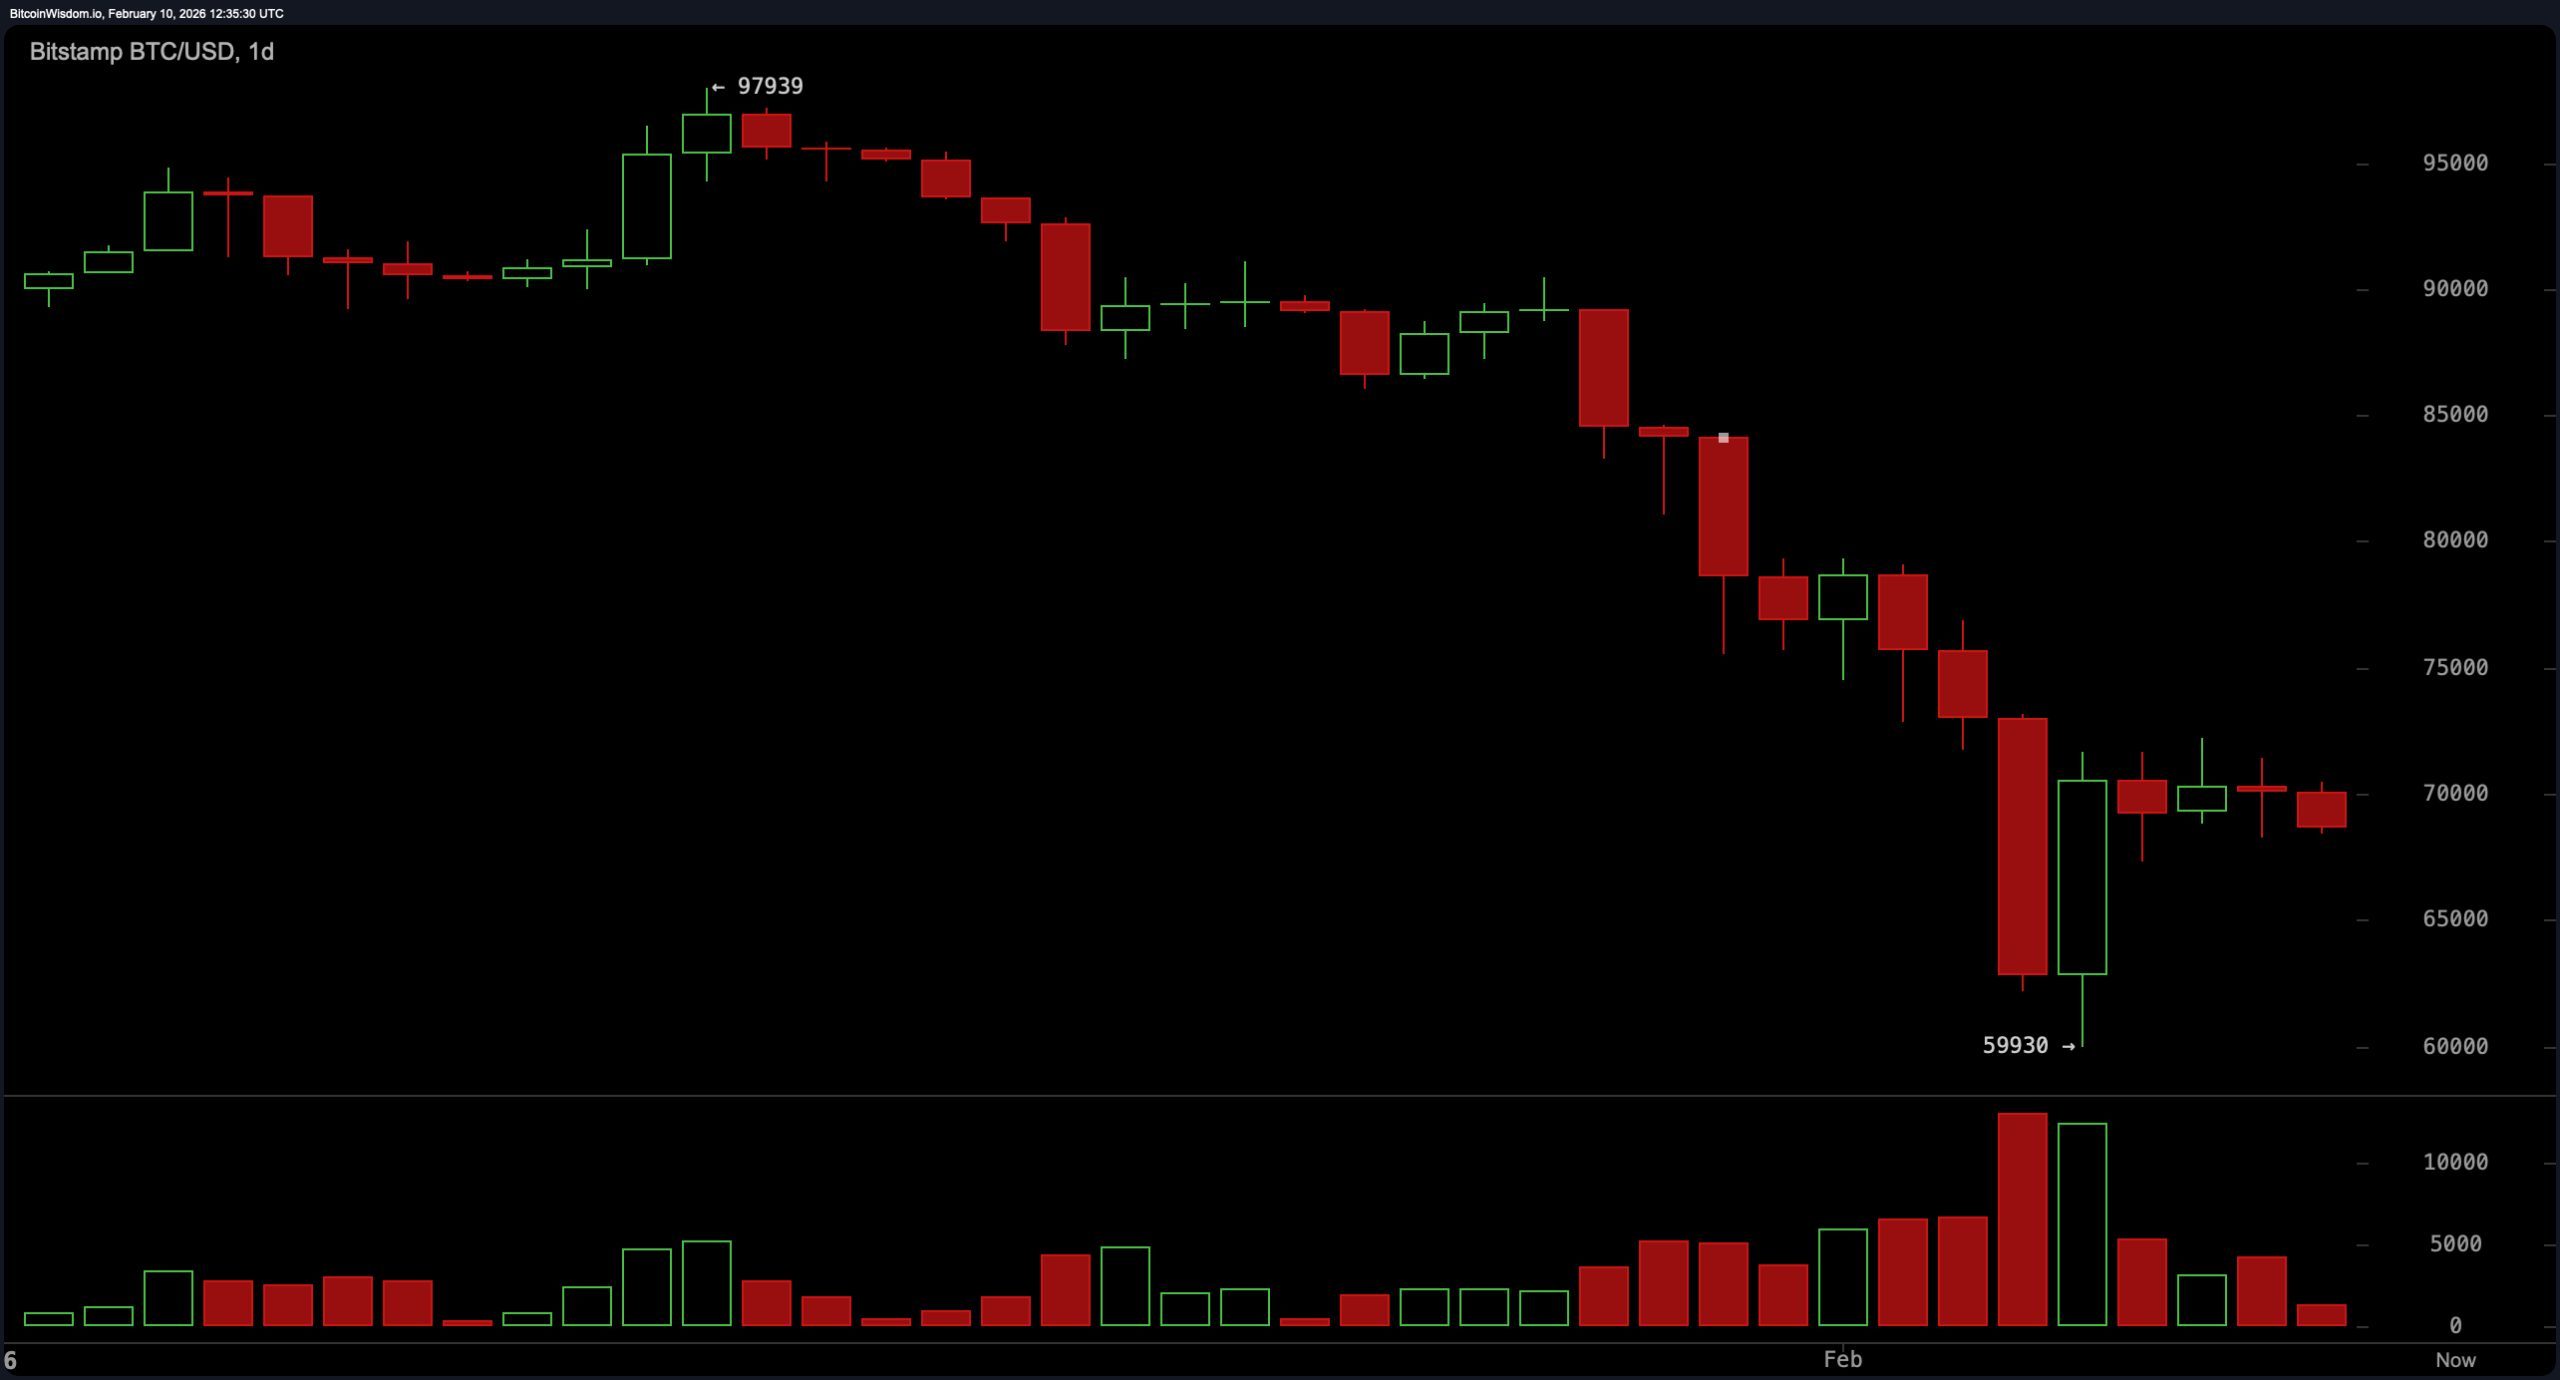
Let’s not get starry-eyed: bitcoin‘s daily chart structure is clearly in recovery mode, not breakout mode. The price is shuffling sideways below key resistance, nursing the wounds from its fall beneath the $97,900 high. The zone around $68,000–$70,000 is less a launchpad and more a rehab clinic for battered bulls. The real heartbeat lies lower, with the $60,000–$62,000 area still holding strong as the major demand zone. Until a daily close convincingly tears through $75,000, optimism remains on probation.
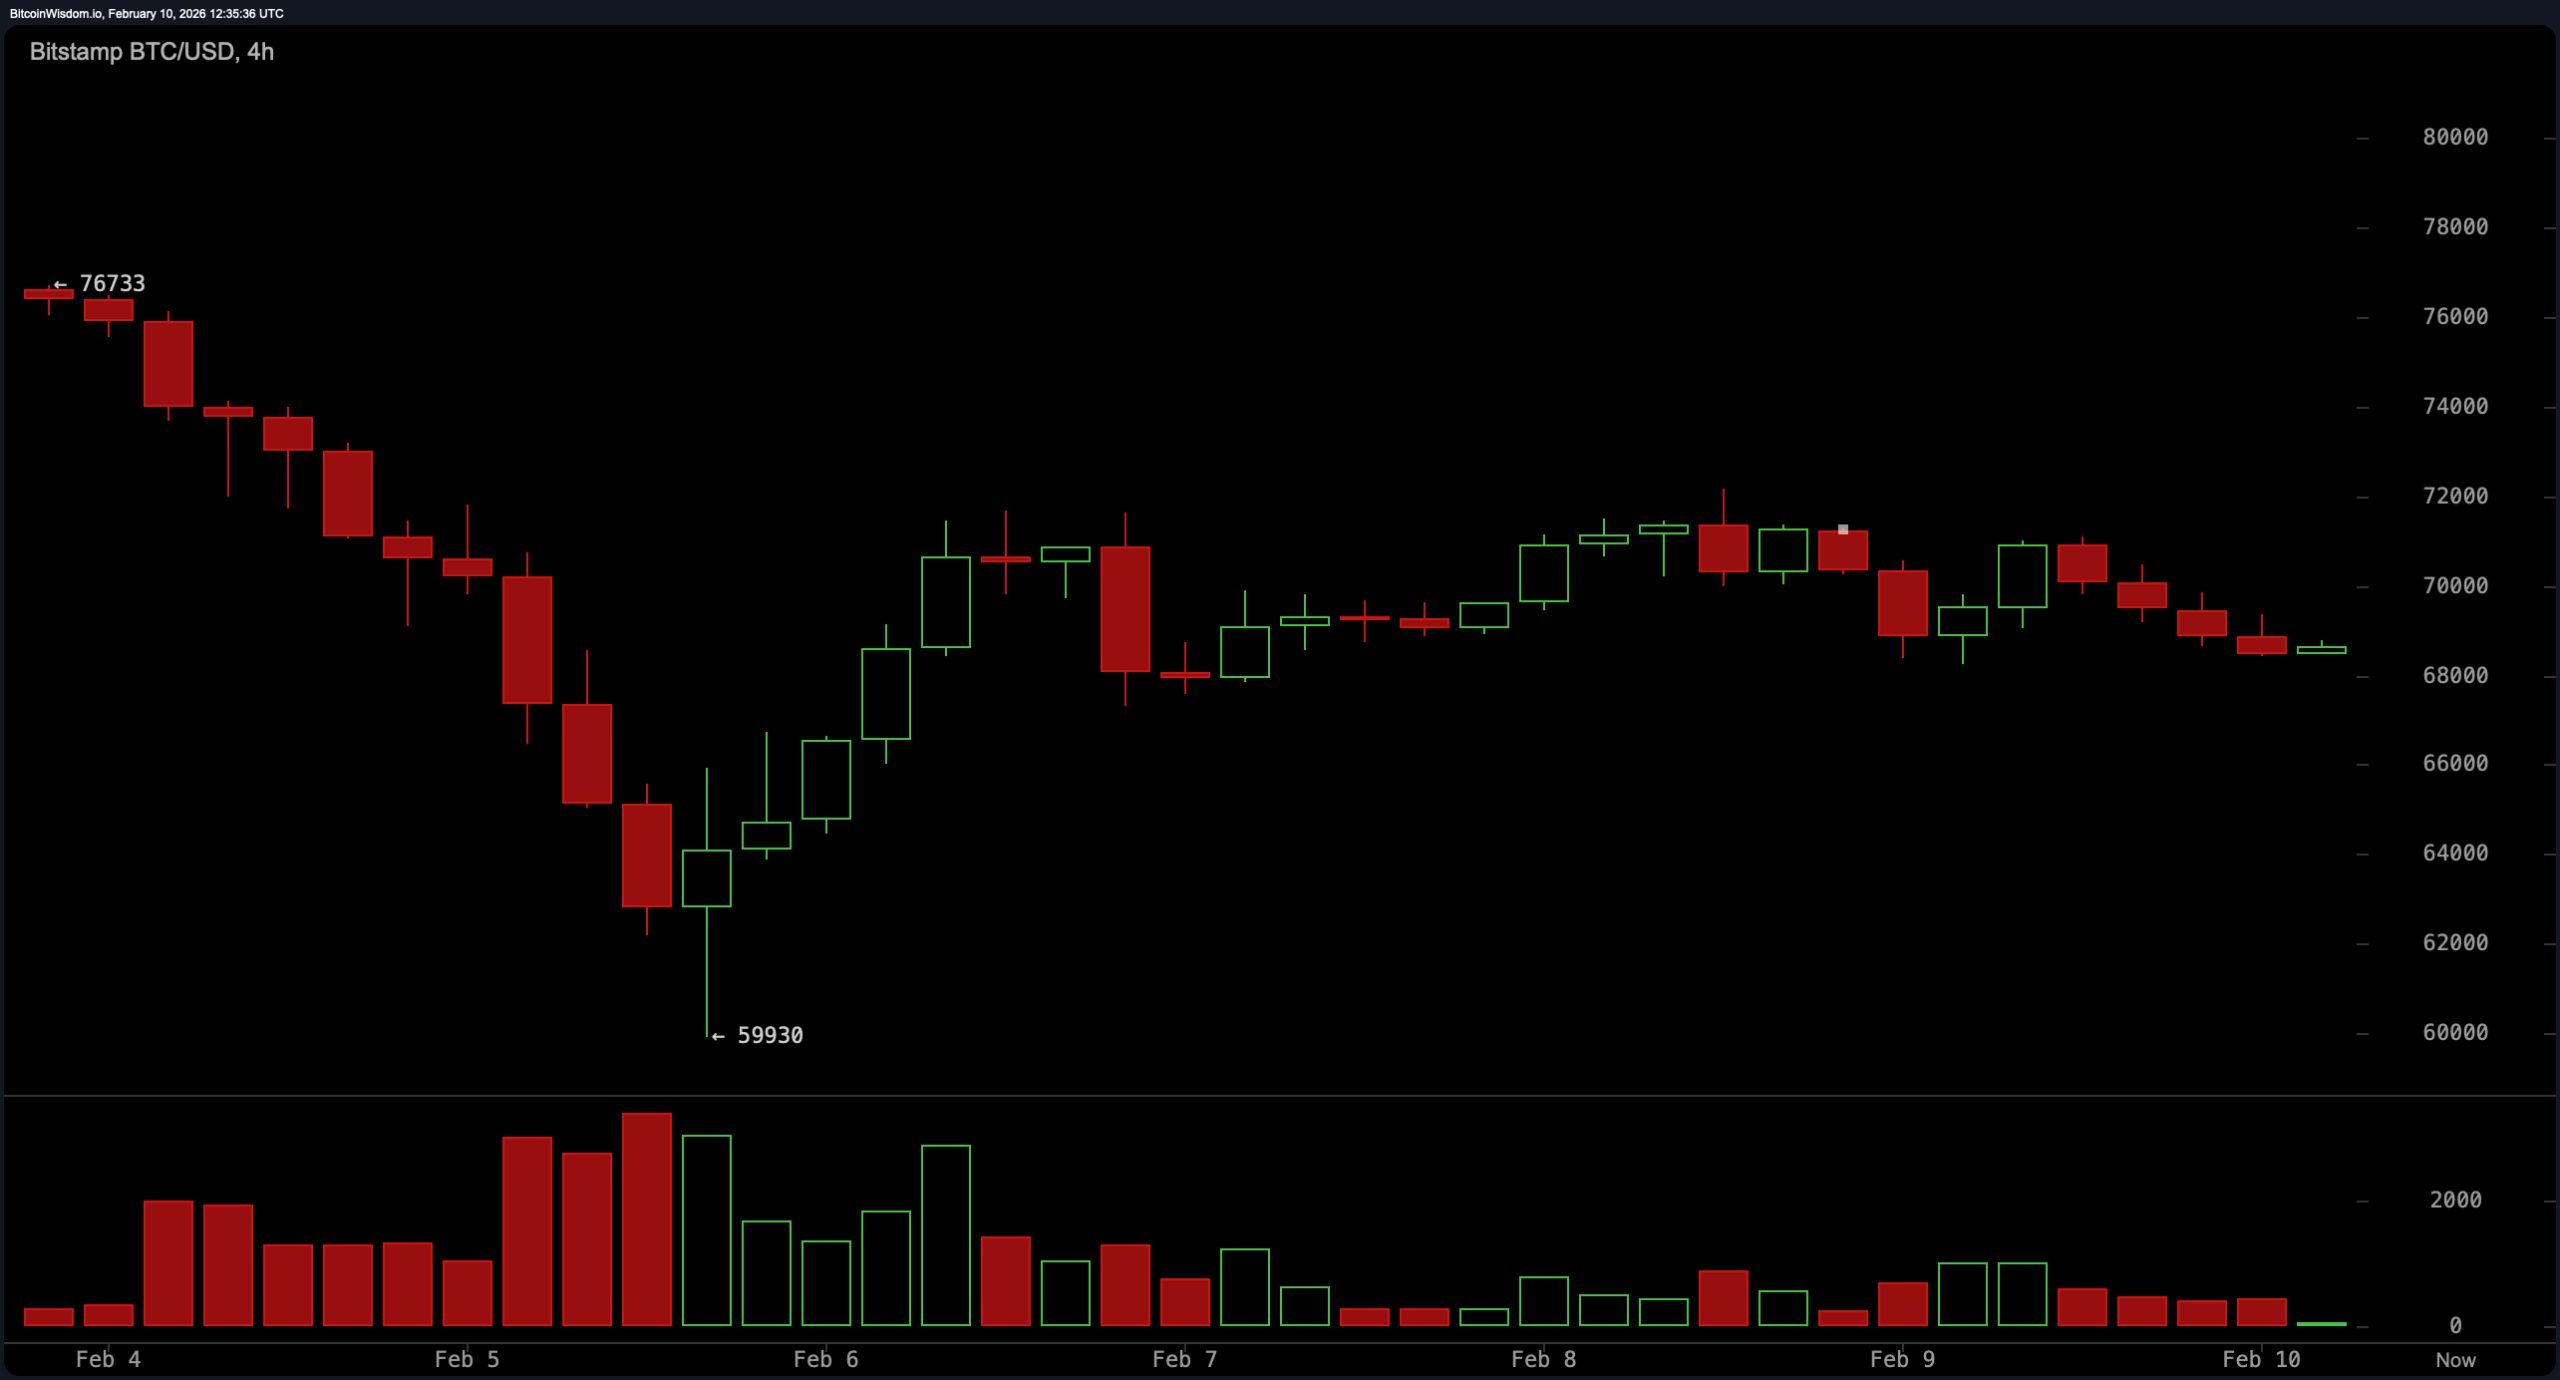
Over on the 4-hour chart, it’s a tale of chop and fade. Price action continues to scribble lower highs into a coiling sideways mess, and volume politely exits stage left every time the market dares to rally. That fading momentum paints a picture of traders saying, “You first,” as bitcoin refuses to take a directional stand. The range between $66,500 and $72,000 has become a rinse-and-repeat playpen, with mean-reversion trades carrying more weight than breakout dreams.
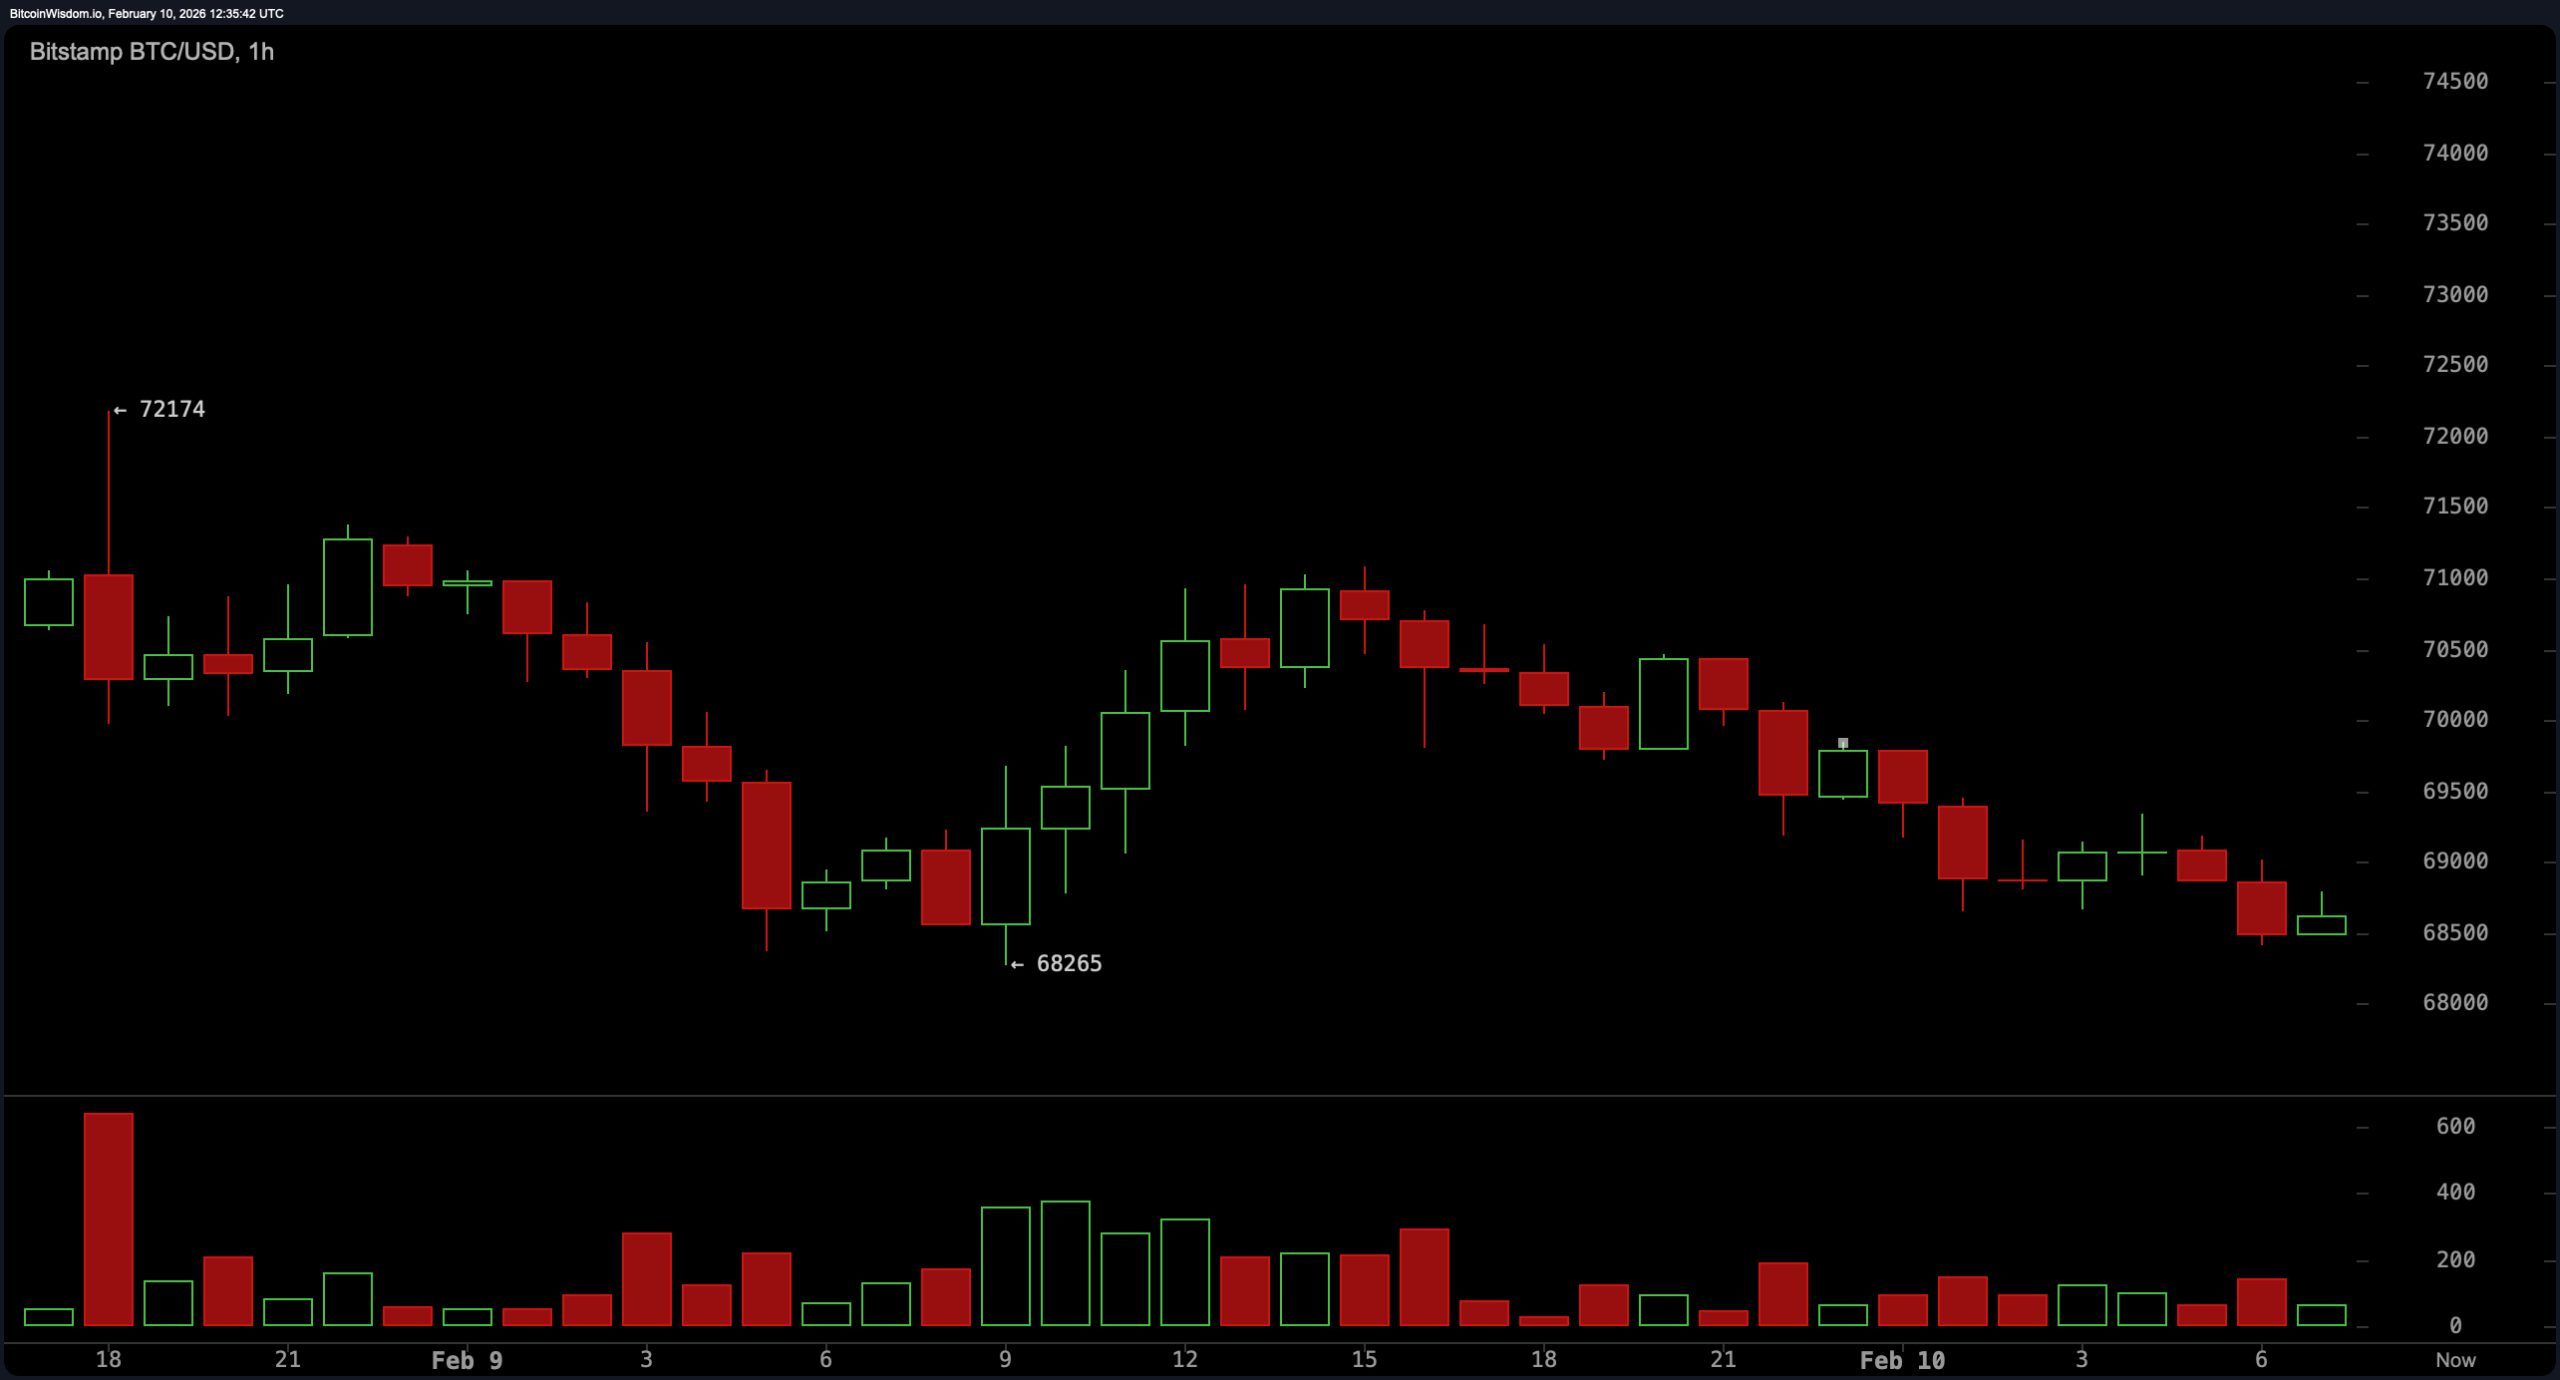
Zooming into the 1-hour chart, bitcoin‘s momentum looks like it forgot to set its alarm clock. Sellers are still dictating the pace, gently nudging the asset into a series of lower highs and soft dips. The bounce zones between $68,000–$68,500 are more relief than reversal, and upward pushes toward $70,000 are corrective—not declarations of bullish intent. Sellers are sniffing out failed bounces in the $70,500–$71,000 range, with eyes on dragging the price back toward $66,800.
Oscillators are collectively shrugging. The relative strength index ( RSI), Stochastic oscillator, commodity channel index (CCI), average directional index (ADX), and Awesome oscillator all sat in neutral territory. Momentum stood out like the overconfident intern—technically in the green—but barely enough to stir conviction.
Meanwhile, the moving average convergence divergence ( MACD) spelled out its dissent with a bearish reading of -5,704. Every major exponential moving average (EMA) and simple moving average (SMA) from the 10-period to the 200-period continued pointing lower, as if to say: “Nice try.”
All told, bitcoin isn’t crashing, but it sure isn’t climbing either. This isn’t the start of a new trend—it’s a waiting room. With consolidation still the main theme, the best opportunities remain in playing the edges of the range rather than chasing shadows. Until the market breaks its compression habit, the smart money will be saving its adrenaline for the real breakout—not the warm-up act.
Bull Verdict:
A decisive 4-hour close above $72,500 with rising volume could flip the script. If bulls muster the strength to break and hold that level, it would suggest growing conviction and open the door for a retest of the $75,000 ceiling. Until then, enthusiasm remains speculative—momentum needs more than hope and hopium to lead this rally.
Bear Verdict:
A break below $66,000 would yank the rug out from under bitcoin’s fragile stability, re-exposing the $62,000–$60,000 support zone. With momentum lacking and every major moving average pointing down, the bears are quietly circling. If the current range fails to hold, the next leg lower could unfold with little resistance.
FAQ ⏱️
- What is bitcoin’s price today? Bitcoin is trading at $68,703 as of Feb. 10, 2026.
- Is bitcoin going up or down right now? Bitcoin is consolidating sideways with weak momentum and no clear trend.
- What are the key support and resistance levels for bitcoin?Support is near $66,500, and resistance sits between $72,000 and $75,000.
- What signals are technical indicators showing for bitcoin?Most oscillators are neutral, and moving averages show continued downside pressure.