
Bitcoin price today trades near $64,670 after rebounding from a session low at $60,001 that marked the first time below $65,000 in over a year. The bounce comes as whale wallets dump 81,068 $BTC in just eight days, pushing large holder supply to a nine-month low while retail investors aggressively accumulate.
Whales Dump 81,000 $BTC As Large Holder Supply Hits 9 Month Low
Santiment data reveals a dramatic shift in Bitcoin ownership structure. Whale and shark wallets holding between 10 and 10,000 $BTC have fallen to their lowest share of supply since late May 2025, collectively accounting for just 68.04% of all Bitcoin.
The dump of 81,068 $BTC over eight days coincides with Bitcoin’s fall from $90,000 to $65,000, a 27% decline. When large holders reduce exposure at this pace, it signals conviction that the asset has peaked rather than a temporary positioning shift.
Meanwhile, retail “shrimp wallets” holding less than 0.1 $BTC have risen to a 20-month high, now accounting for 0.249% of supply or roughly 52,290 $BTC. Santiment warns this combination of key stakeholders selling while retail buys historically creates bear cycles.
Spot Outflows Approach $2 Billion In Three Days
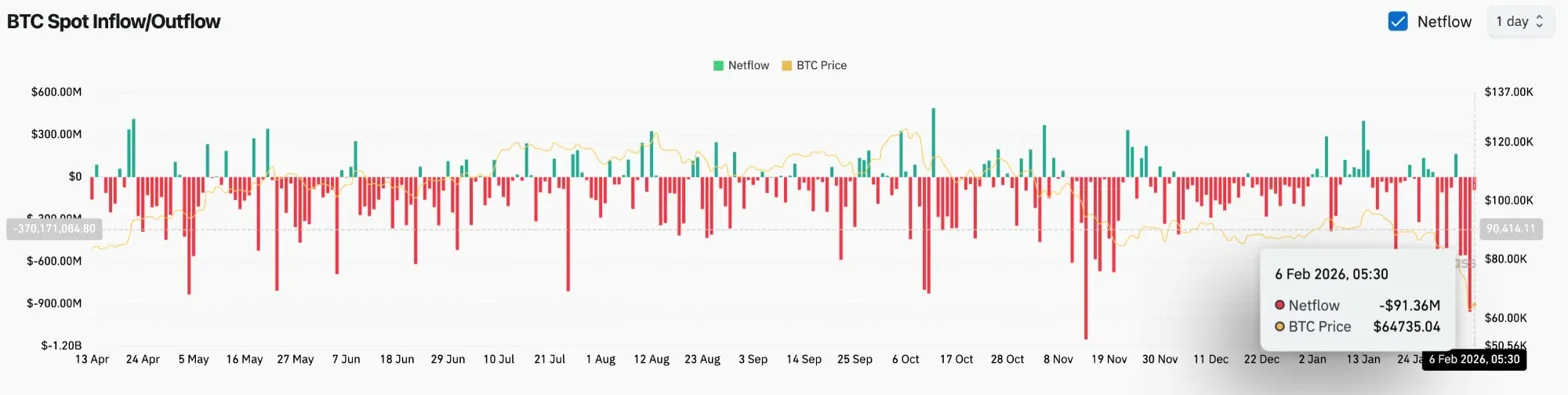
Coinglass data shows $91.36 million in spot outflows on February 6, extending the massive distribution that has defined the past week. Over three days, spot outflows have approached $2 billion as institutional ETF withdrawals accelerate alongside spot selling.
Deutsche Bank analysts attributed the slide to massive withdrawals from institutional ETFs. The outflow pattern represents one of the most severe distribution periods since Bitcoin ETFs launched, signaling institutional capitulation rather than temporary repositioning.
Related: Cardano Price Prediction: ADA Price Weakness Deepens as Hoskinson Urges Focus Beyond Red Days
When outflows of this magnitude persist during a crash, it confirms that sellers have conviction. The lack of buying interest even at the $60,000 level suggests the market has not yet found a price where demand can absorb supply.
Daily Chart Shows Critical Support Levels
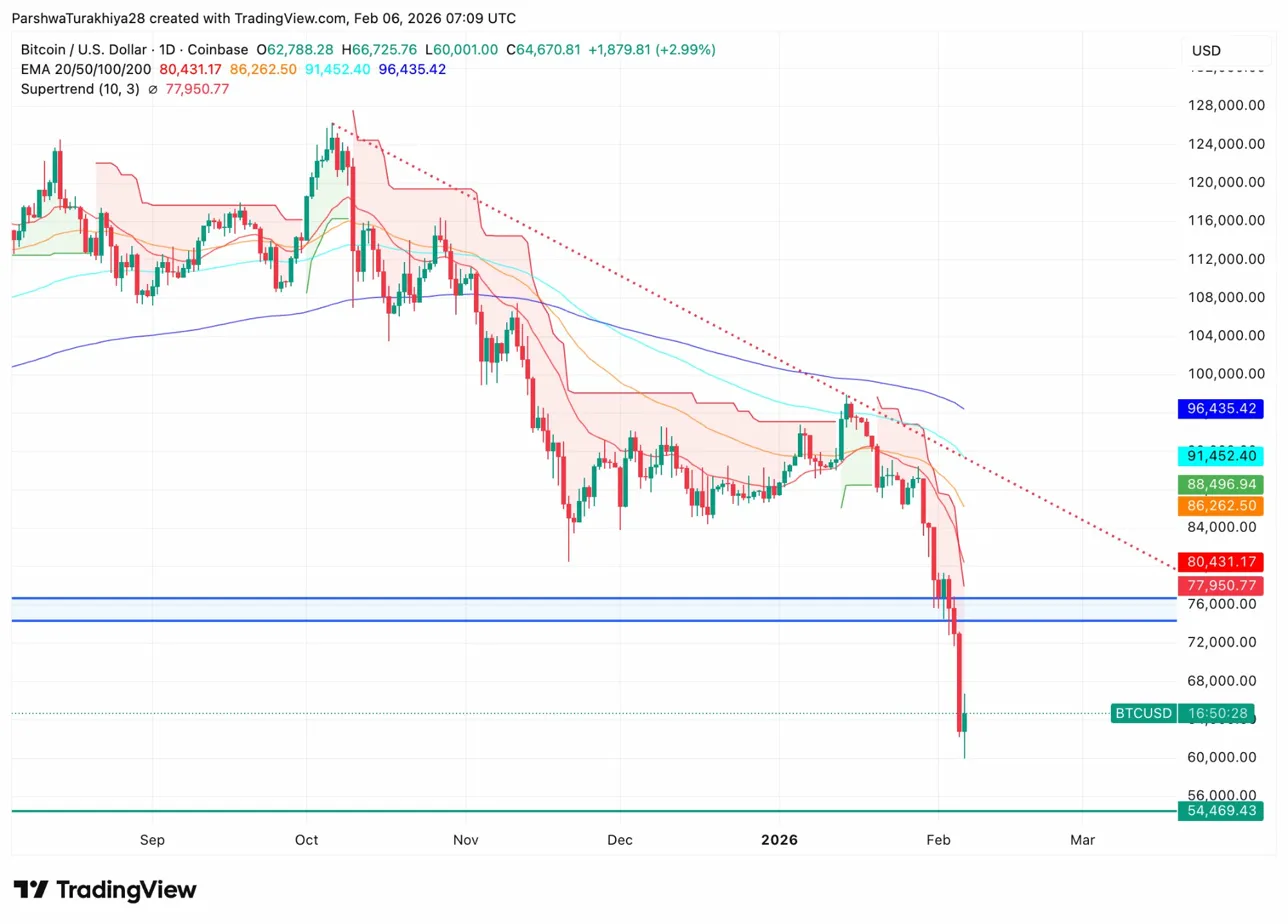
On the daily chart, Bitcoin has crashed through multiple support levels with devastating speed. The $77,950 Supertrend level broke first, followed by the $76,000 horizontal support that had held for months.
Price now trades well below all four major EMAs. The 20 day sits at $80,431, the 50 day at $86,262, the 100 day at $91,452, and the 200 day at $96,435. The gap between current price at $64,670 and the nearest EMA at $80,431 shows the severity of the breakdown.
The $54,469 level marked on the chart represents the next major support if $60,000 fails. That zone aligns with the summer 2024 consolidation area where Bitcoin traded before the rally to all-time highs.
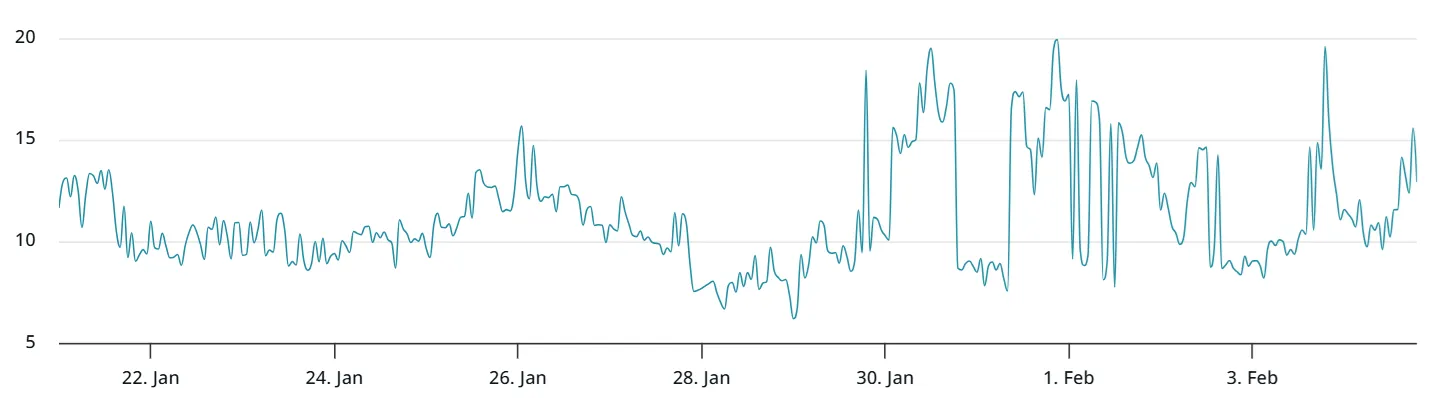
Fear Index Hits Lowest Since Terra Collapse
The Crypto Fear & Greed Index dropped to 9 out of 100 on Friday, its lowest reading since mid-2022 when the market was reeling from the Terra blockchain collapse. The extreme fear reading suggests sentiment has reached capitulation levels.
CryptoQuant CEO Ki Young Ju noted that every Bitcoin analyst is now bearish, a unanimous consensus that sometimes marks turning points. However, the whale dumping and ETF outflows suggest this pessimism has fundamental backing.
Related: Solana Price Prediction: SOL Downtrend Deepens Despite Slowing Sell Pressure
The geopolitical backdrop continues to pressure crypto. The U.S. capture of Venezuelan President Maduro, Trump’s Greenland threats, and the Warsh Fed nomination have combined to send investors scrambling for traditional safe havens like gold and silver, which hit historic highs.
Short Term Chart Shows Descending Trendline Resistance
On the 30-minute chart, Bitcoin trades below a descending trendline that has guided the selloff since February 3. The trendline currently runs through $66,000, marking immediate resistance for any recovery attempt.
RSI has recovered to 46.47 from deeply oversold levels, showing some stabilization after the crash to $60,001. MACD has turned positive with the histogram expanding, suggesting short-term momentum may be shifting.
The bounce from $60,001 to $64,670 represents a 7.8% recovery that needs to hold above $63,000 to signal any meaningful stabilization. A rejection at the descending trendline would target a retest of the $60,000 low.
Outlook: Will Bitcoin Go Up?
The trend remains firmly bearish while whales distribute and institutional outflows persist.
- Bullish case: A daily close above $77,950 would reclaim the Supertrend and signal that the $60,000 low marked capitulation. The extreme Fear Index reading at 9 has historically preceded bounces when combined with stabilizing flows.
- Bearish case: A close below $60,000 would confirm the breakdown and target the $54,469 support zone. With whales dumping 81,000 $BTC and retail accumulating, the historical bear cycle setup Santiment describes remains active.
Related: Shiba Inu Price Prediction: SHIB Recovers 15% From Crash Low While Bitcoin Slides Under $65K
Disclaimer: The information presented in this article is for informational and educational purposes only. The article does not constitute financial advice or advice of any kind. Coin Edition is not responsible for any losses incurred as a result of the utilization of content, products, or services mentioned. Readers are advised to exercise caution before taking any action related to the company.