
Bitcoin is dangling at the edge of a breakdown, not bouncing toward a breakout. In the last hour, its price jittered between $69,049 and $69,546, as $1.40 trillion in market cap faces mounting pressure and $99.42 billion in 24-hour volume suggests panic, not conviction, inside a volatile $69,049–$76,122 trading range.
Bitcoin Chart Outlook
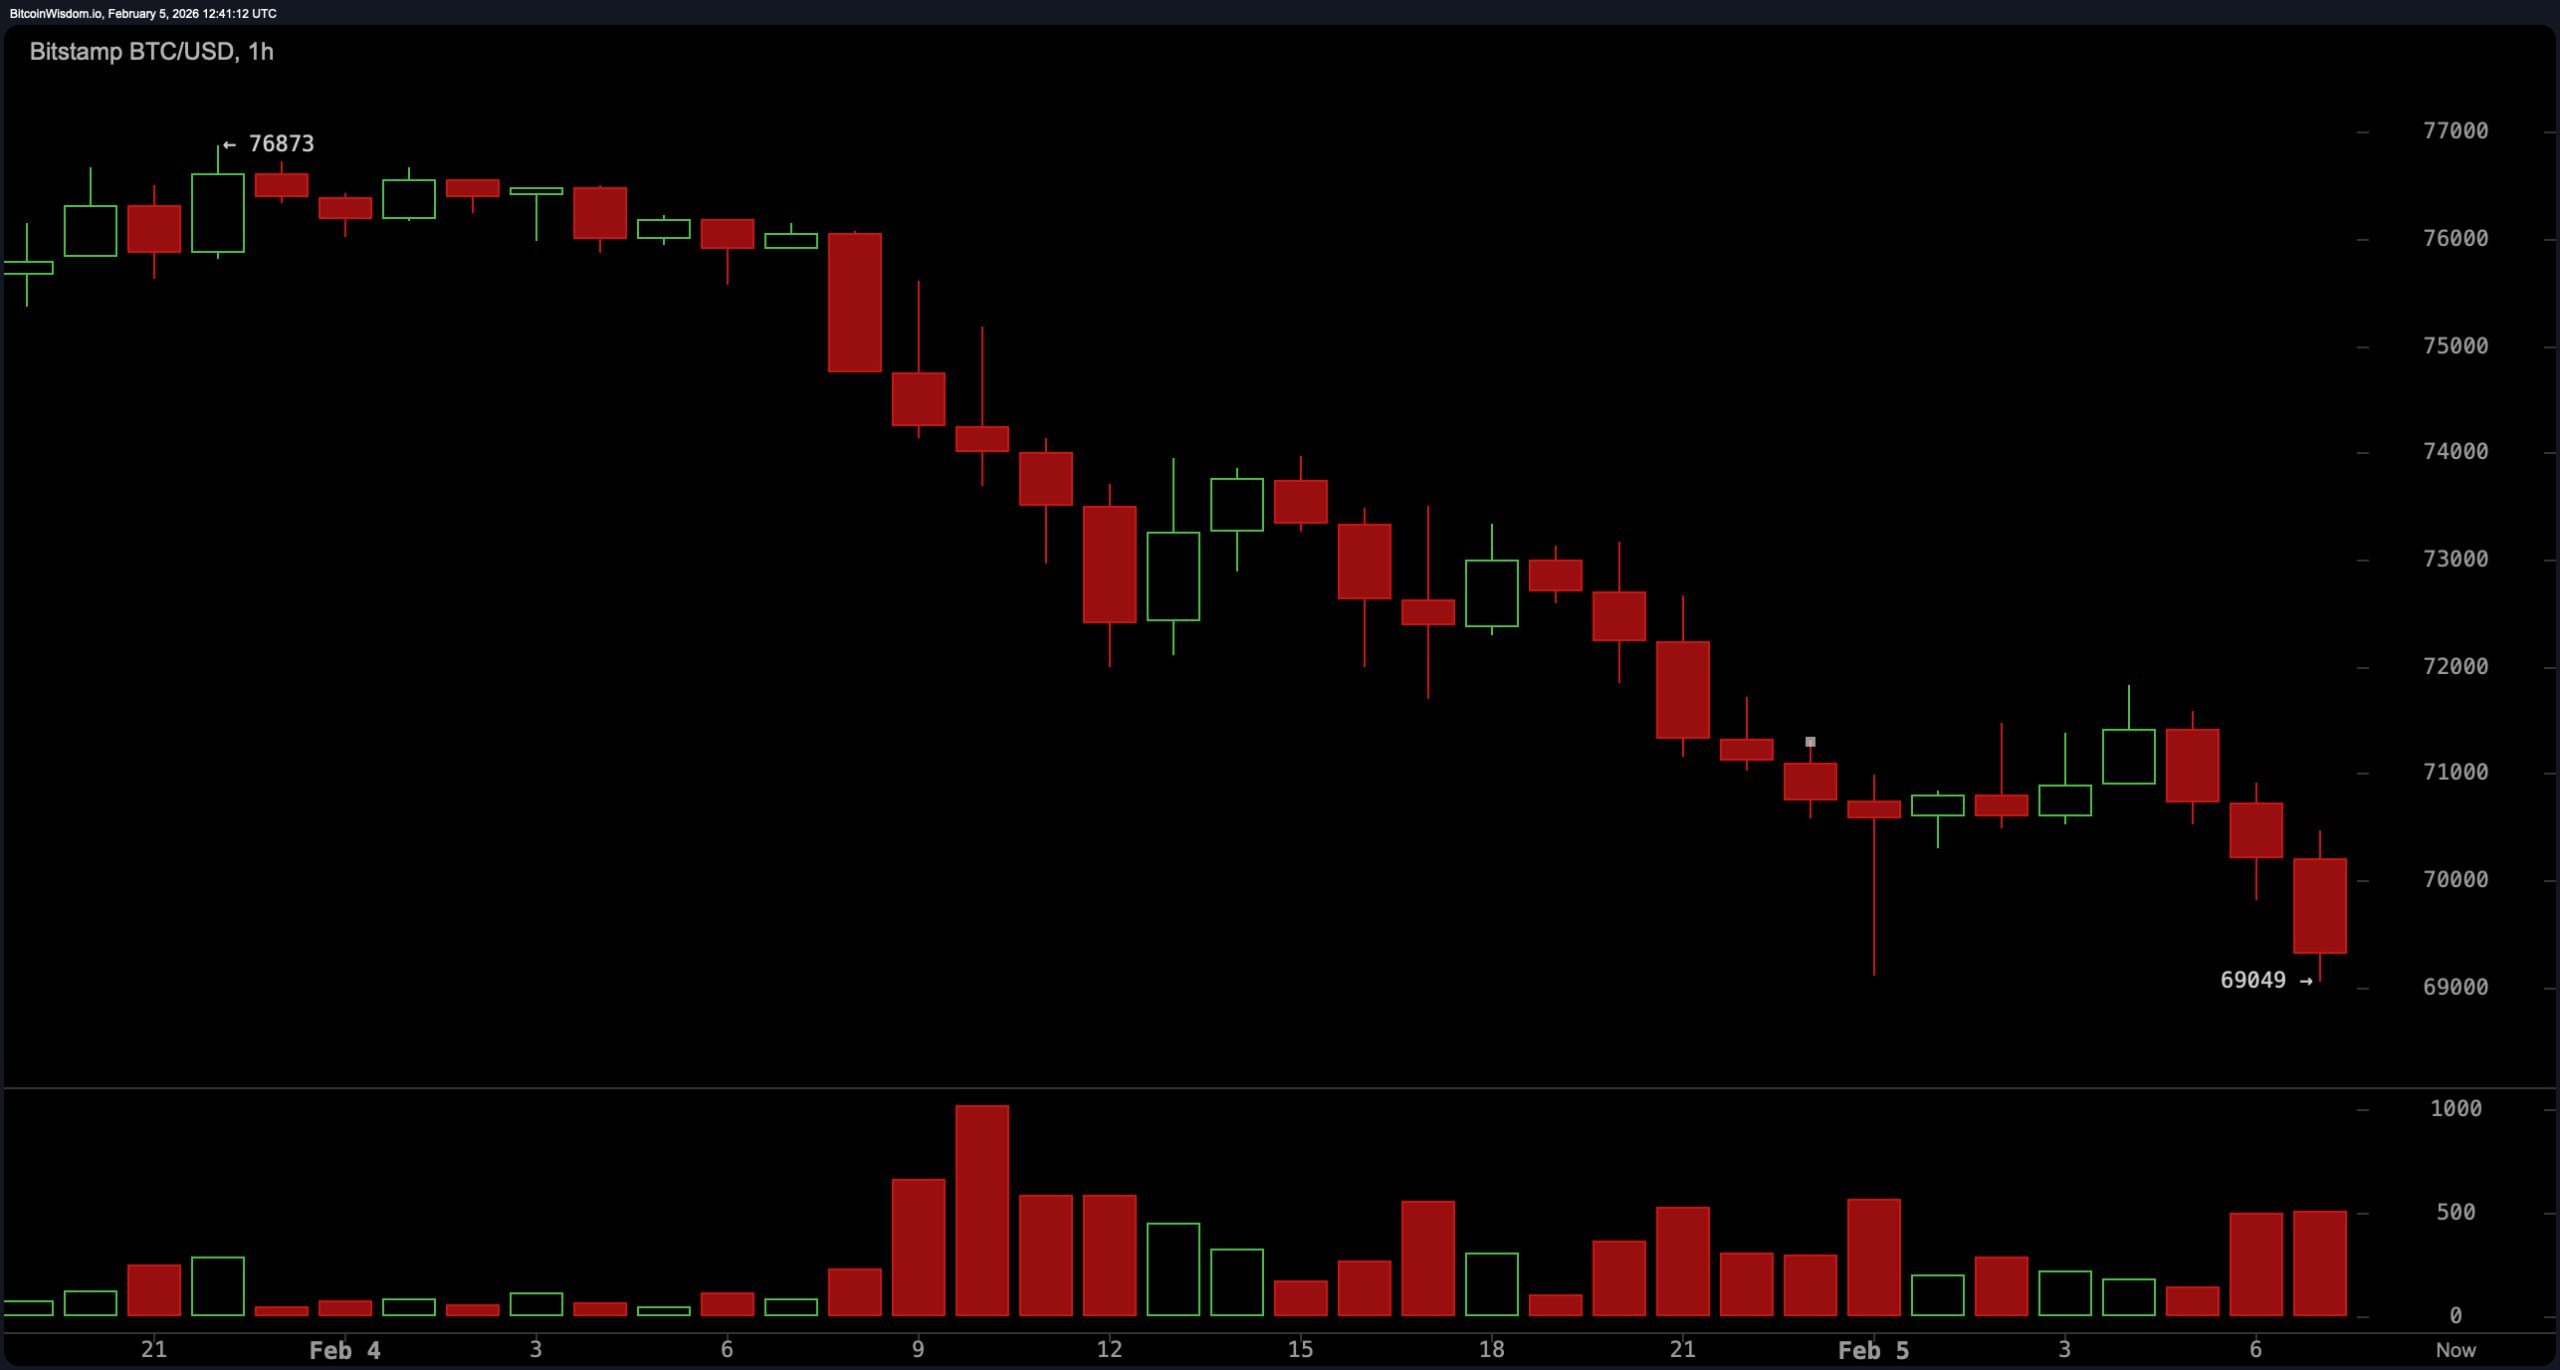
Bitcoin‘s 1-hour chart paints a classic case of indecisive nerves. We’re not seeing the type of aggressive push typical of a reversal—just a pattern of lower highs and fleeting bounces that fade faster than a Tiktok trend.
Volume spikes conveniently match red candles, a not-so-subtle nod to sellers calling the shots. Short-term scalp setups are congested near $69,200–$69,800, while failed attempts to climb above $72,500 remain the market’s Achilles’ heel. A loss of $69,000 would slam the door shut on any bullish dreams, opening the floor for potential downside acceleration.
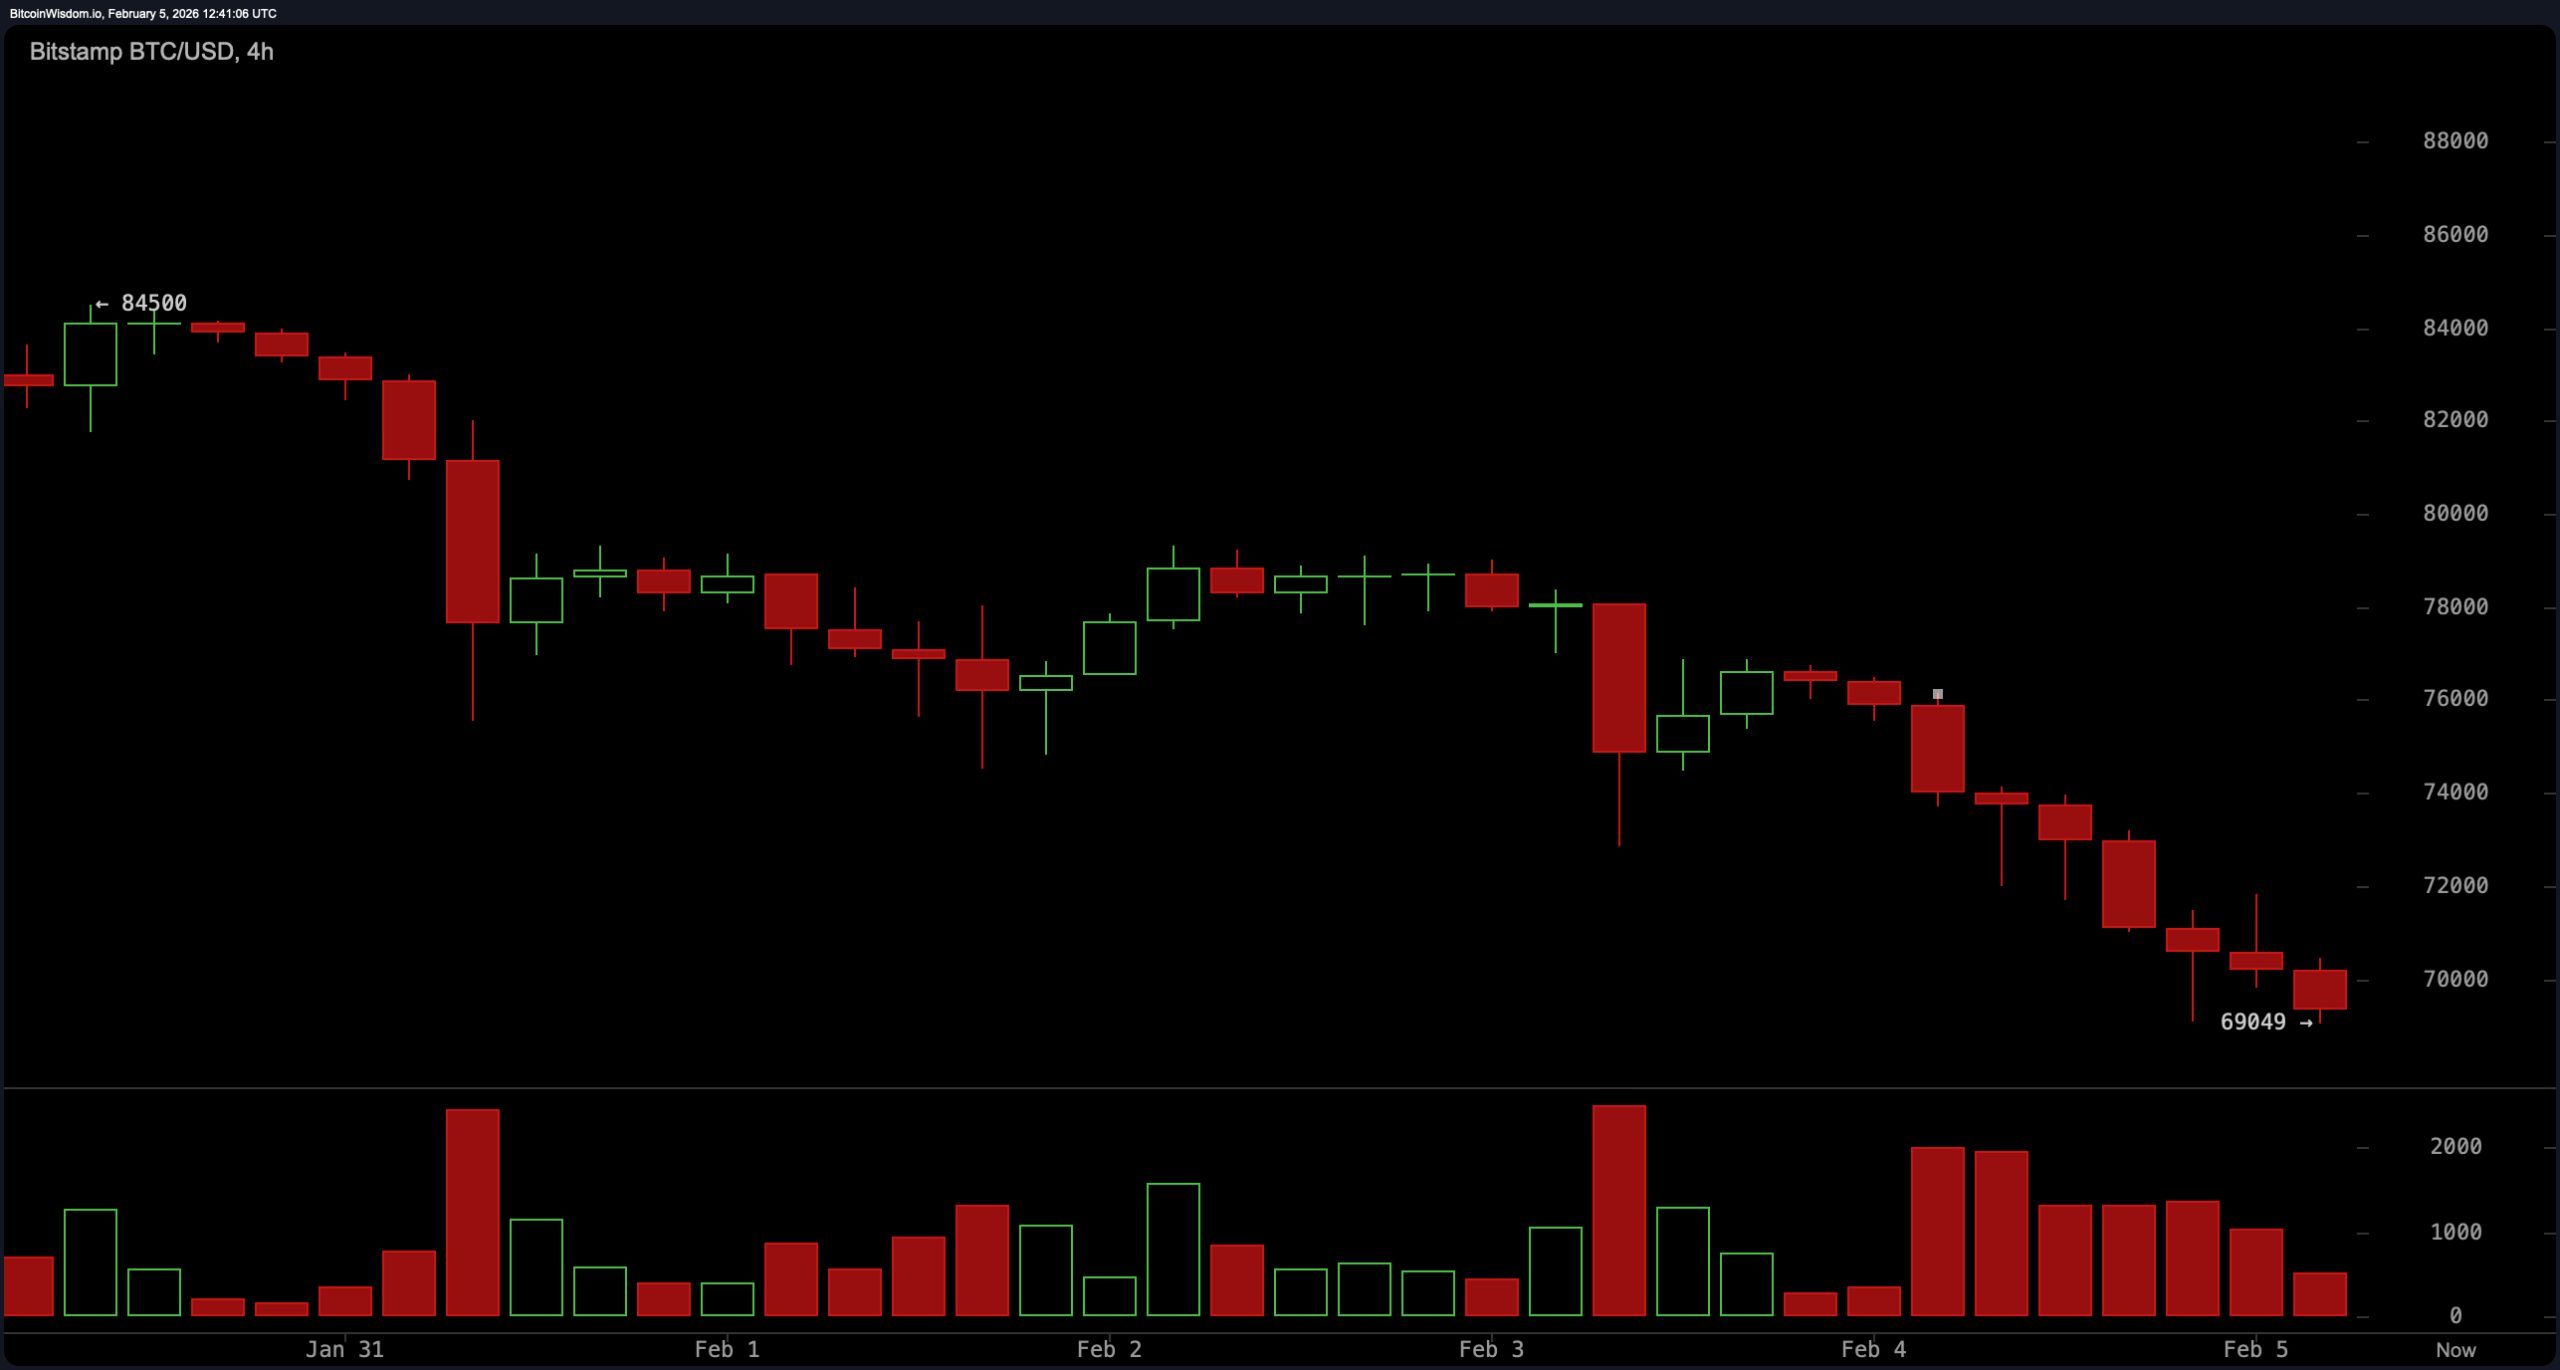
Zooming out to bitcoin’s 4-hour chart, the story doesn’t improve much—unless you’re a fan of bear flags. Every bounce attempt has been efficiently neutralized below resistance, and the drop from $78,000 to $69,000 unfolded with the kind of precision that only market pessimism can deliver. There’s some weak-willed consolidation going on, but it screams “continuation,” not “recovery.” A move back above $72,500 would be the market’s version of CPR, while anything below $69,000 signals it’s lights out for the current price structure.
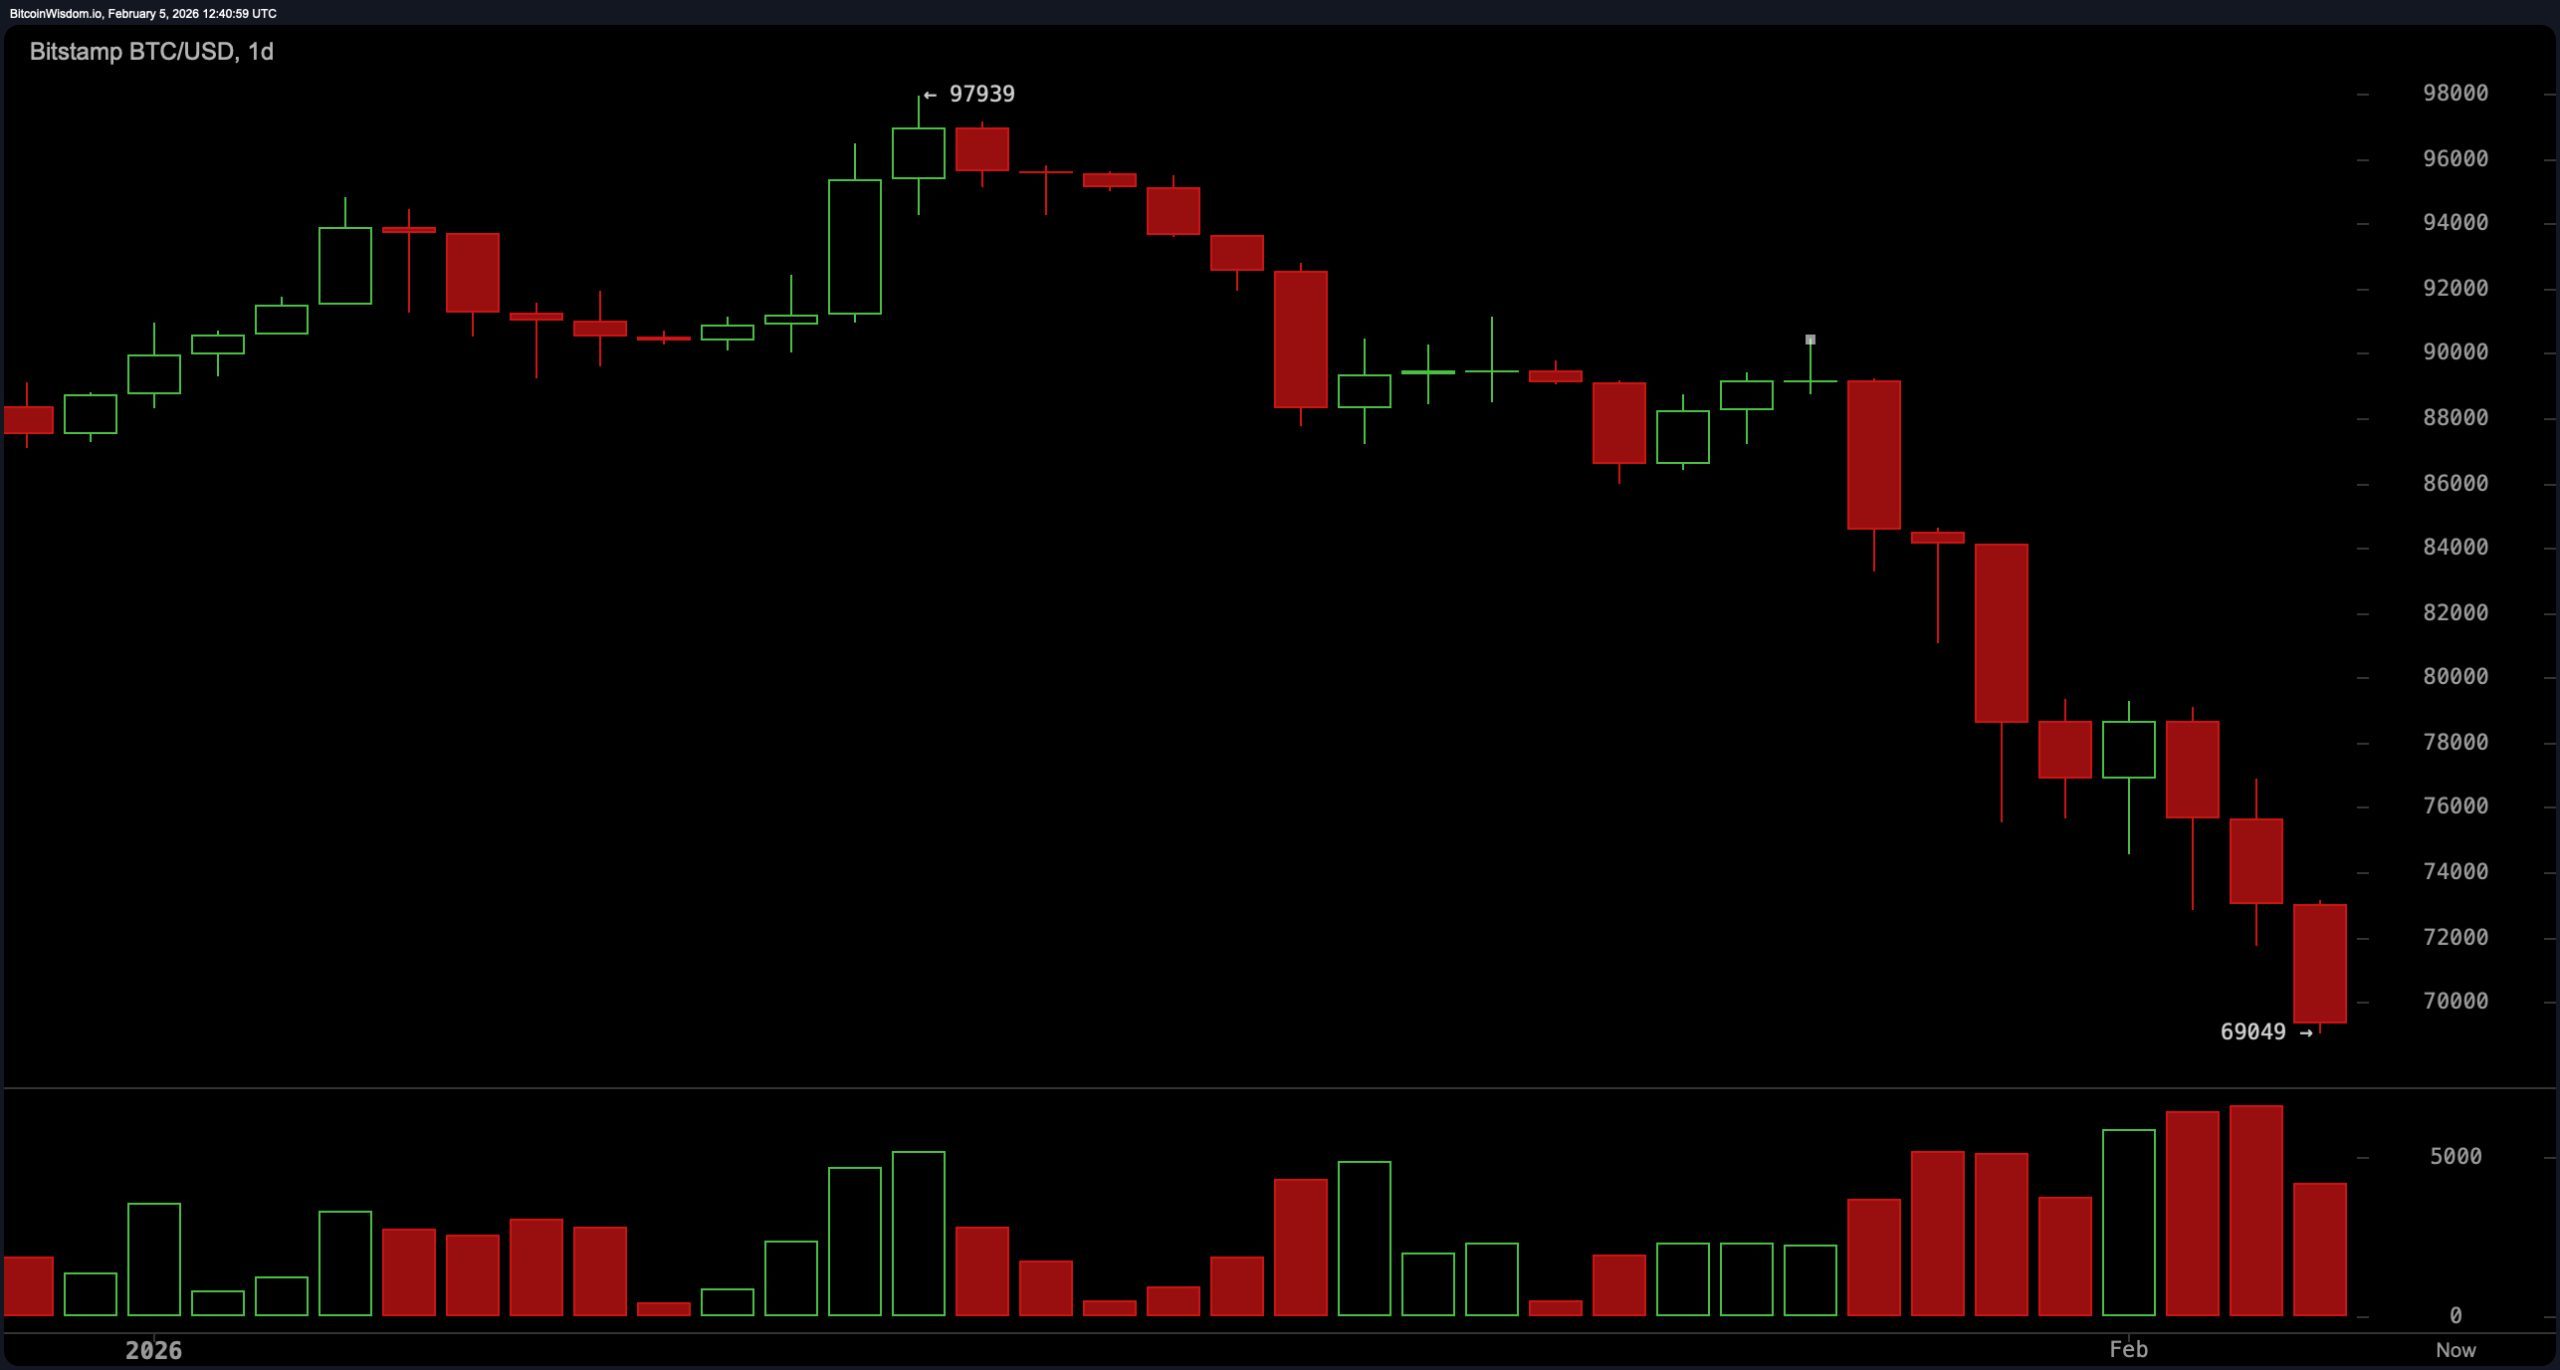
The daily chart solidifies the theme: lower highs, lower lows, and no sign of structural salvation. The price retreat from the highs near $97,900 to this precarious $69K neighborhood isn’t just a detour—it’s a full-scale trend shift. Selling expanded on the breakdown candles, reinforcing the idea that this isn’t a minor correction. Key support now lies between $69,000 and $69,500; failure to defend that zone could drag prices down into the $66,500–$67,000 range. Overhead resistance sits stoutly at $75,500–$77,000, with the real fortress looming at $82,000–$84,500.
Oscillators are giving their best impression of Switzerland—neutral, neutral, neutral—across the board. The relative strength index ( RSI) is hanging at a noncommittal 21, while the Stochastic, commodity channel index (CCI), average directional index (ADX), and Awesome oscillator all echo the same meh sentiment. Only the momentum oscillator and moving average convergence divergence ( MACD) show any strong opinion, and both are tilted negatively. Translation? The market is tired, and it shows.
Moving averages are no less critical—and no more comforting. The exponential moving averages (EMA) and simple moving averages (SMA) from 10 to 200 periods all point downhill, with current price action below even the shortest of these trend gauges. With the 10-period EMA at $78,544 and the 200-period SMA way up at $103,069, bitcoin has some serious climbing to do before reclaiming any semblance of trend strength. Until then, all higher timeframes remain tethered to a bearish bias with $69,000 as the market’s precarious lifeline.
Bull Verdict:
If bitcoin can hold the $69,000 level with conviction and claw its way back above $72,500, there’s a shot at a short-term relief rally. But let’s not kid ourselves—anything under $75,000 remains a corrective blip, not a trend reversal. Bulls need to bring more than hope; they need volume, momentum, and a clean break above resistance.
Bear Verdict:
The charts read like a cautionary tale for anyone wearing laser eyes. With price action breaking down across all major timeframes and every moving average pointing south, the bias remains bearish until proven otherwise. A breach below $69,000 could trigger a cascade to the $66,500–$67,000 zone—because gravity, unlike hype, always wins.
FAQ
- Where is bitcoin trading now? Bitcoin is hovering between $69,049 and $69,546 as of Feb. 5, 2026, at 7:30 a.m. EST.
- What’s the key support level to watch?The $69,000 mark is the critical support level across all timeframes.
- Is the current trend bullish or bearish?All major timeframes show a firmly bearish trend with no reversal in sight.
- What happens if $69K breaks?A drop below $69,000 could open downside toward $66,500–$67,000.