
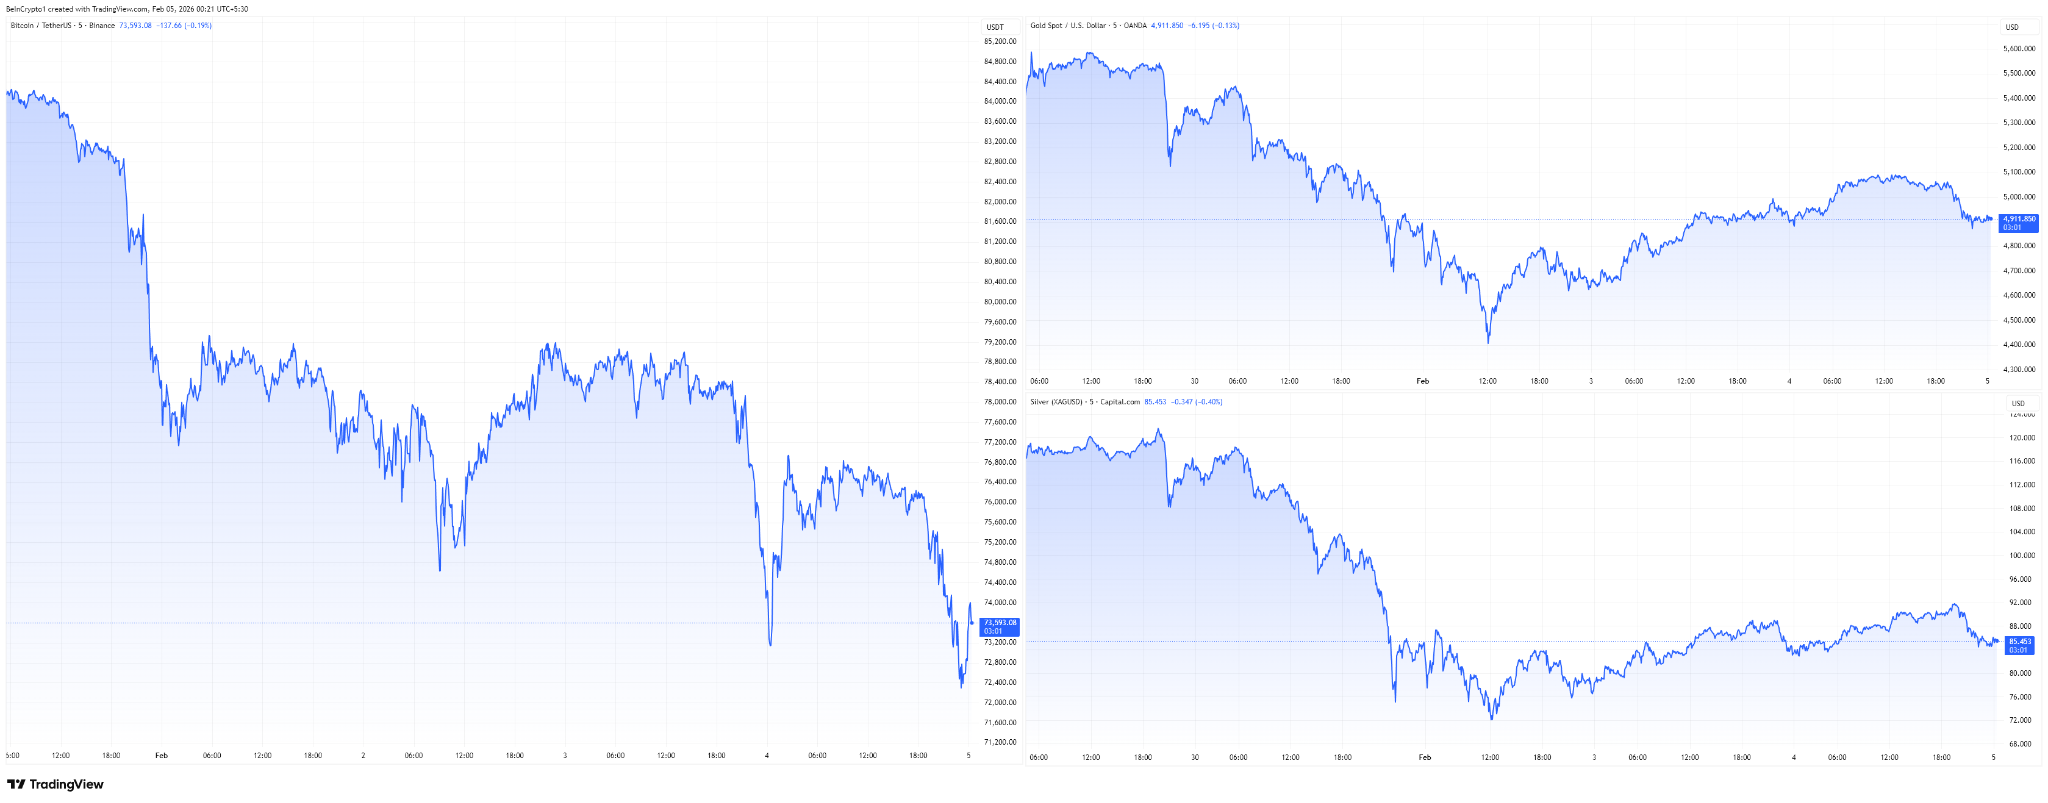
Bitcoin fell sharply to $73,000 on February 3, extending a broader bearish trend that has now erased 41% from its October 2025 all-time high above $126,000. The drawdown has intensified debate over whether the market is approaching a cyclical bottom—or entering a deeper corrective phase.
The sell-off mirrors rising anxiety across traditional markets. US equity indices weakened amid concerns about artificial intelligence-driven disruption and escalating geopolitical risks, prompting investors to rotate away from risk assets.
In that environment, capital flowed back into traditional safe havens such as gold and silver, while Bitcoin failed to attract defensive demand.
Macro and Geopolitical Stress Push Investors Toward Traditional Havens
Bitcoin’s volatility continues to reflect macro sensitivity rather than isolation from global markets. The latest leg down coincided with renewed tensions between the United States and Iran after an Iranian drone was reportedly shot down near a US aircraft carrier.
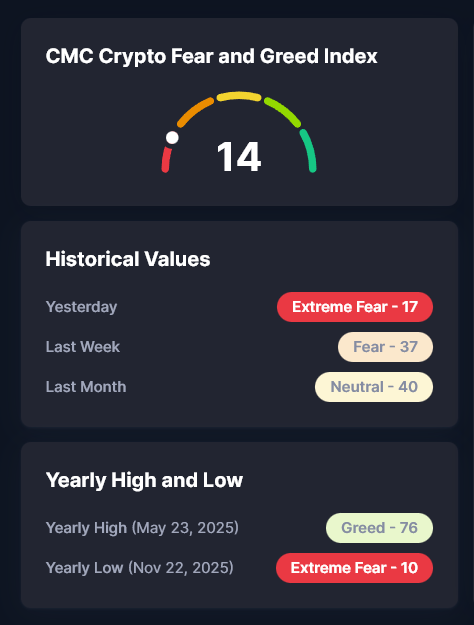
The incident pushed the VIX up roughly 10% and drove the Crypto Fear & Greed Index into “extreme fear” territory.
At the same time, developments in artificial intelligence—including new announcements around Anthropic’s Claude chatbot—sparked renewed concerns about disruption across the tech sector.
That uncertainty weighed on major technology stocks and further reduced appetite for speculative assets.
While Bitcoin declined, gold rose 6.8% and silver gained 10%, reinforcing their role as preferred hedges during periods of monetary and geopolitical stress.
Speaking to CNN, Gerry O’Shea, Global Head of Market Insights at Hashdex, noted that the divergence between Bitcoin and gold suggests investors still view precious metals as the primary safe haven during periods of uncertainty.
That shift has weakened Bitcoin’s short-term refuge narrative and added downside pressure.
Fun fact: Gold's correlation with Bitcoin over the last 10 years is 0.09.
— Jack Mallers (@jackmallers) January 29, 2026
In other words, they are not correlated at all, and do not move together. We have seen this movie before. The last time was COVID.
Patience, fellow Bitcoiners. pic.twitter.com/yBcSJVrS2U
Analysts Warn of Deeper Drawdowns and a Potential Bull Trap
Market participants remain divided, but several analysts are openly warning that the correction may not be over.
Crypto analyst Benjamin Cowen argued that Bitcoin’s near-term path is critical:
*#$BTC just dropped below the April 2025 low.*
— Benjamin Cowen (@intocryptoverse) February 3, 2026
If it does not bounce soon, this is going to be one hell of a midterm year.
If it can bounce, it gives us a few months and gets us closer to October without so much bad price action (likely the bottom in time).
I feel like the bear… pic.twitter.com/5avv8DKNjG
Other analysts are more pessimistic. Nehal, a widely followed trader on X, suggested the current structure resembles a classic bull trap, warning that the move lower may only be halfway complete.
According to Nehal’s historical comparison, Bitcoin’s previous cycles ended with drawdowns of 86% in 2018 and 78% in 2021.
Applying a similar framework to the current cycle implies a potential 72% decline, which would place Bitcoin near $35,000.
This cyclical perspective remains influential despite structural changes in the market, including ETF adoption and greater institutional participation.
This chart says we’re only halfway through the Bull Trap.
— Nehal (@nehalzzzz1) February 4, 2026
If the pattern is still in play, $BTC will dump to $35,000 in February.
The bear market hasn’t even started yet. pic.twitter.com/Igdx4uQuzQ
On-Chain Data Signals “Bottom Discovery” Phase
On-chain indicators are adding another layer to the debate. Analyst CryptOpus noted that Bitcoin has entered what he describes as a “bottom discovery” phase for the first time this cycle.
At the 2025 peak, roughly 19.8 million $BTC were held in profit. That figure has now dropped to 11.1 million $BTC, a 40% reduction in profitable supply.
Historically, similar conditions have marked transitions from corrective phases toward cycle resets. In 2018, Bitcoin remained in this state for roughly eight months before stabilizing.
👀 #BITCOIN HAS OFFICIALLY ENTERED ITS BOTTOM DICOVERY PHASE! For the first time this cycle, supply-in-profit is moving into the Bottom Discovery #trend line. At last year’s peak, 19.8M $BTC were in profit. Today, only 11.1M are, wiping out ~40% of profitable supply. That means… pic.twitter.com/LJ1WauPrI6
— CryptOpus (@ImCryptOpus) February 4, 2026
Key Technical Levels Under Scrutiny
From a technical standpoint, downside risks remain clearly defined. Nic, CEO of Coin Bureau, highlighted that Bitcoin has remained under pressure since breaking below the 50-week moving average in November.
Bitcoin is currently trading near MicroStrategy’s cost basis and close to the April lows around $74,400.
“If we break lower, the next major level is $70,000, just above the previous all-time high of $69,000. A clean break below that opens the door to a bear market target in the $55,700–$58,200 range, between realized price and the 200-week moving average,” Nic warned.
Where is the Bitcoin Bottom?
— Nic (@nicrypto) February 4, 2026
Ever since breaking the 50w MA bull trend in November, Bitcoin's momentum has been to the downside.
2 weeks ago, we also broke through the 100w MA.
Last week we broke through the ETF cost basis & the true market mean.
We're currently trading… pic.twitter.com/T2vo4hTedF
Conflicting Views on Whether a Bottom Is Near
Not all analysts agree with the bearish outlook. Michaël van de Poppe believes Bitcoin may already be nearing the end of its downturn.
I'm not selling.
— Michaël van de Poppe (@CryptoMichNL) February 3, 2026
Fuck that.
I think that we're at the end of the bear market.
I also think that Gold & Silver have peaked for now.#Bitcoin peaked in Q4 2024, after which we've seen a normal bear market year in 2025.
The cycle is about to start from here on.
I remain all-in…
Meanwhile, analyst David Battaglia focused on liquidation dynamics, describing current conditions as increasingly irrational.
Battaglia noted that below $85,000, liquidity gaps were significant, meaning panic sellers—whether institutional or whales—likely exited at suboptimal prices.
He contrasted this with the October 10 crash tied to Binance, which he described as structurally cleaner.
“Between $90,000 and $100,000, there’s massive short density and a 14:1 puts-to-calls imbalance, which under normal conditions already signals a strong bottom,” Battaglia said.
In Summary
Bitcoin’s drop to $73,000 has reignited fears of a deeper correction. Macro uncertainty, geopolitical tension, and mixed on-chain signals leave the market split between expectations of further downside and signs of an emerging bottom.
The coming weeks will likely determine whether this move represents a temporary pause—or the foundation of a new trend for 2026.
The post Is Bitcoin Price Headed Lower? Analysts Debate a Much Deeper Fall appeared first on BeInCrypto.