
Bitcoin is changing hands at $78,162 today, with a market capitalization of $1.56 trillion and 24-hour trading volume surging to $54.86 billion. It has swung between $77,642 and $79,130 over the past day—tight, yes, but deceptively charged with indecision.
Bitcoin Chart Outlook
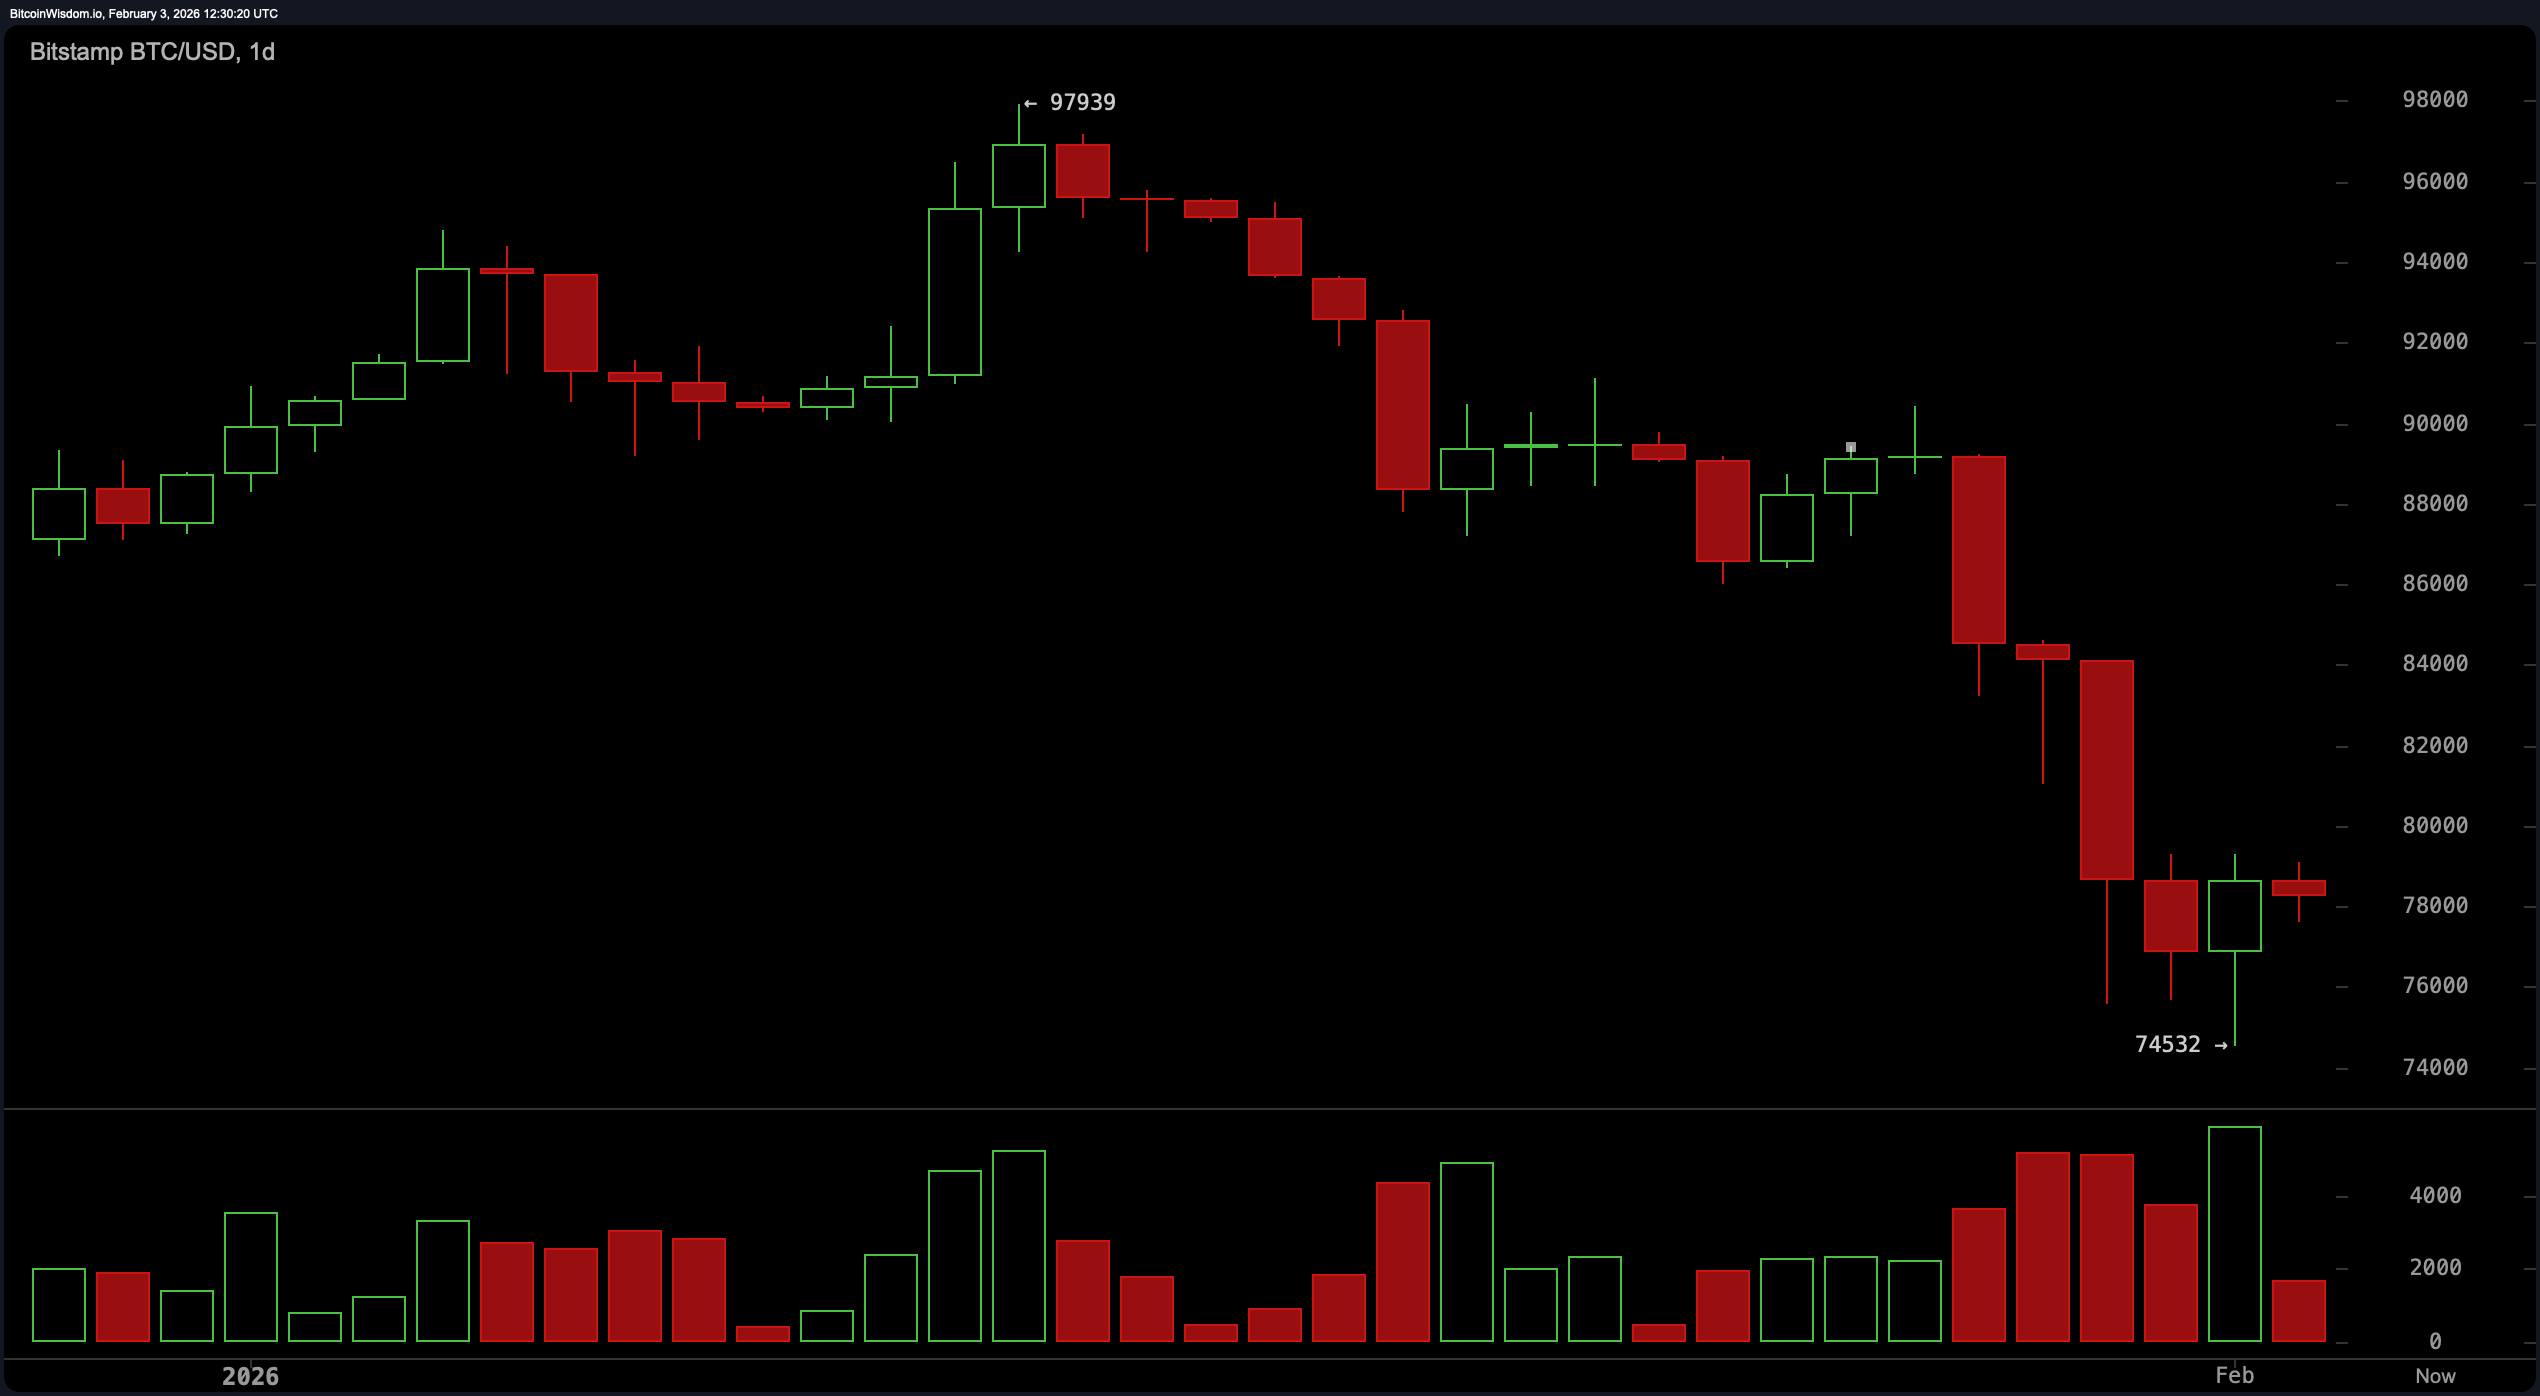
Bitcoin’s daily chart reveals a market still catching its breath after its recent faceplant from the $97,900 level, bottoming out at $74,532. The bounce from that low wasn’t exactly an Olympic-level comeback—more of a hesitant shuffle upward.
The price structure appears corrective rather than impulsive, suggesting the bulls might just be flexing sore muscles rather than charging with confidence. Strong resistance remains stubborn between $88,000 and $90,000, while support in the $74,500 to $76,000 range acts like the market’s emotional support blanket. Unless bitcoin reclaims the $90,000 handle with gusto, the overarching bias stays neutral-to- bearish.
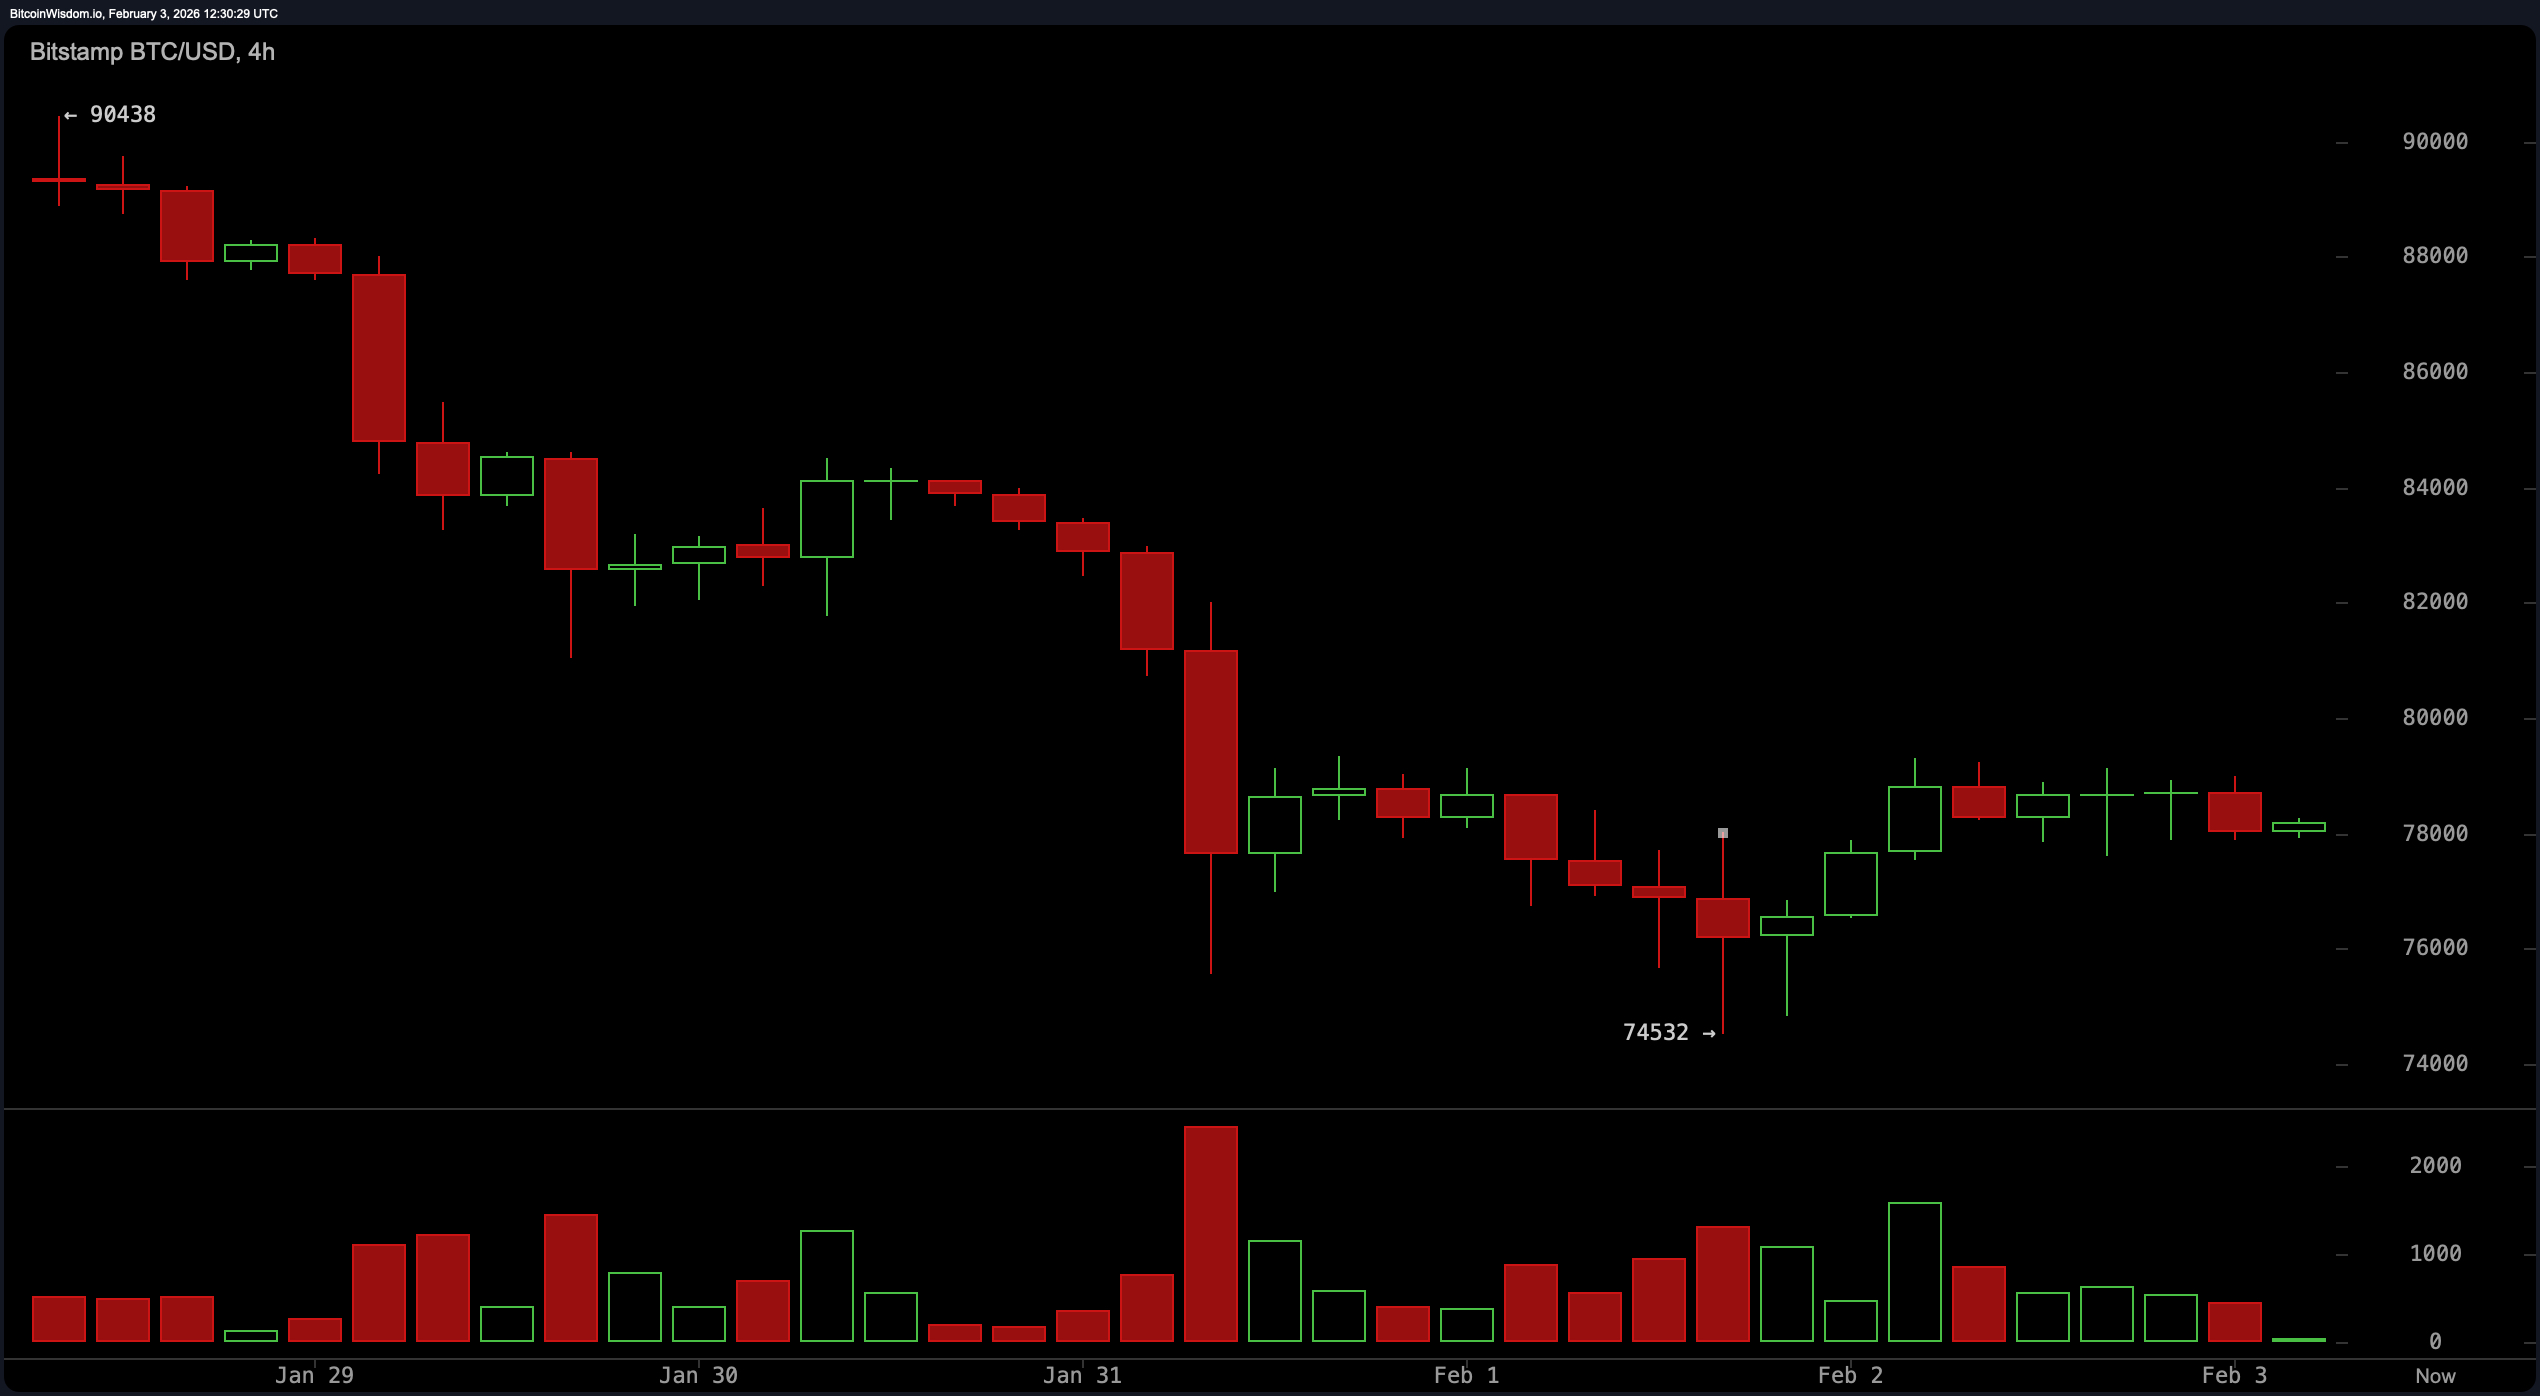
On the 4-hour chart, things look a bit like a soap opera—lots of drama, but not much real change. Lower highs persist, a classic mark of fading ambition among buyers. Price is bouncing inside a narrow band between $76,000 and $79,500, suggesting traders are playing hot potato rather than building conviction. Volume backs up this narrative: hefty sell-side activity at the lows followed by a rather limp recovery. Any clear move above $80,000, with momentum and volume in tow, might shift the mood. But for now, it’s all just side-eye and hesitation.
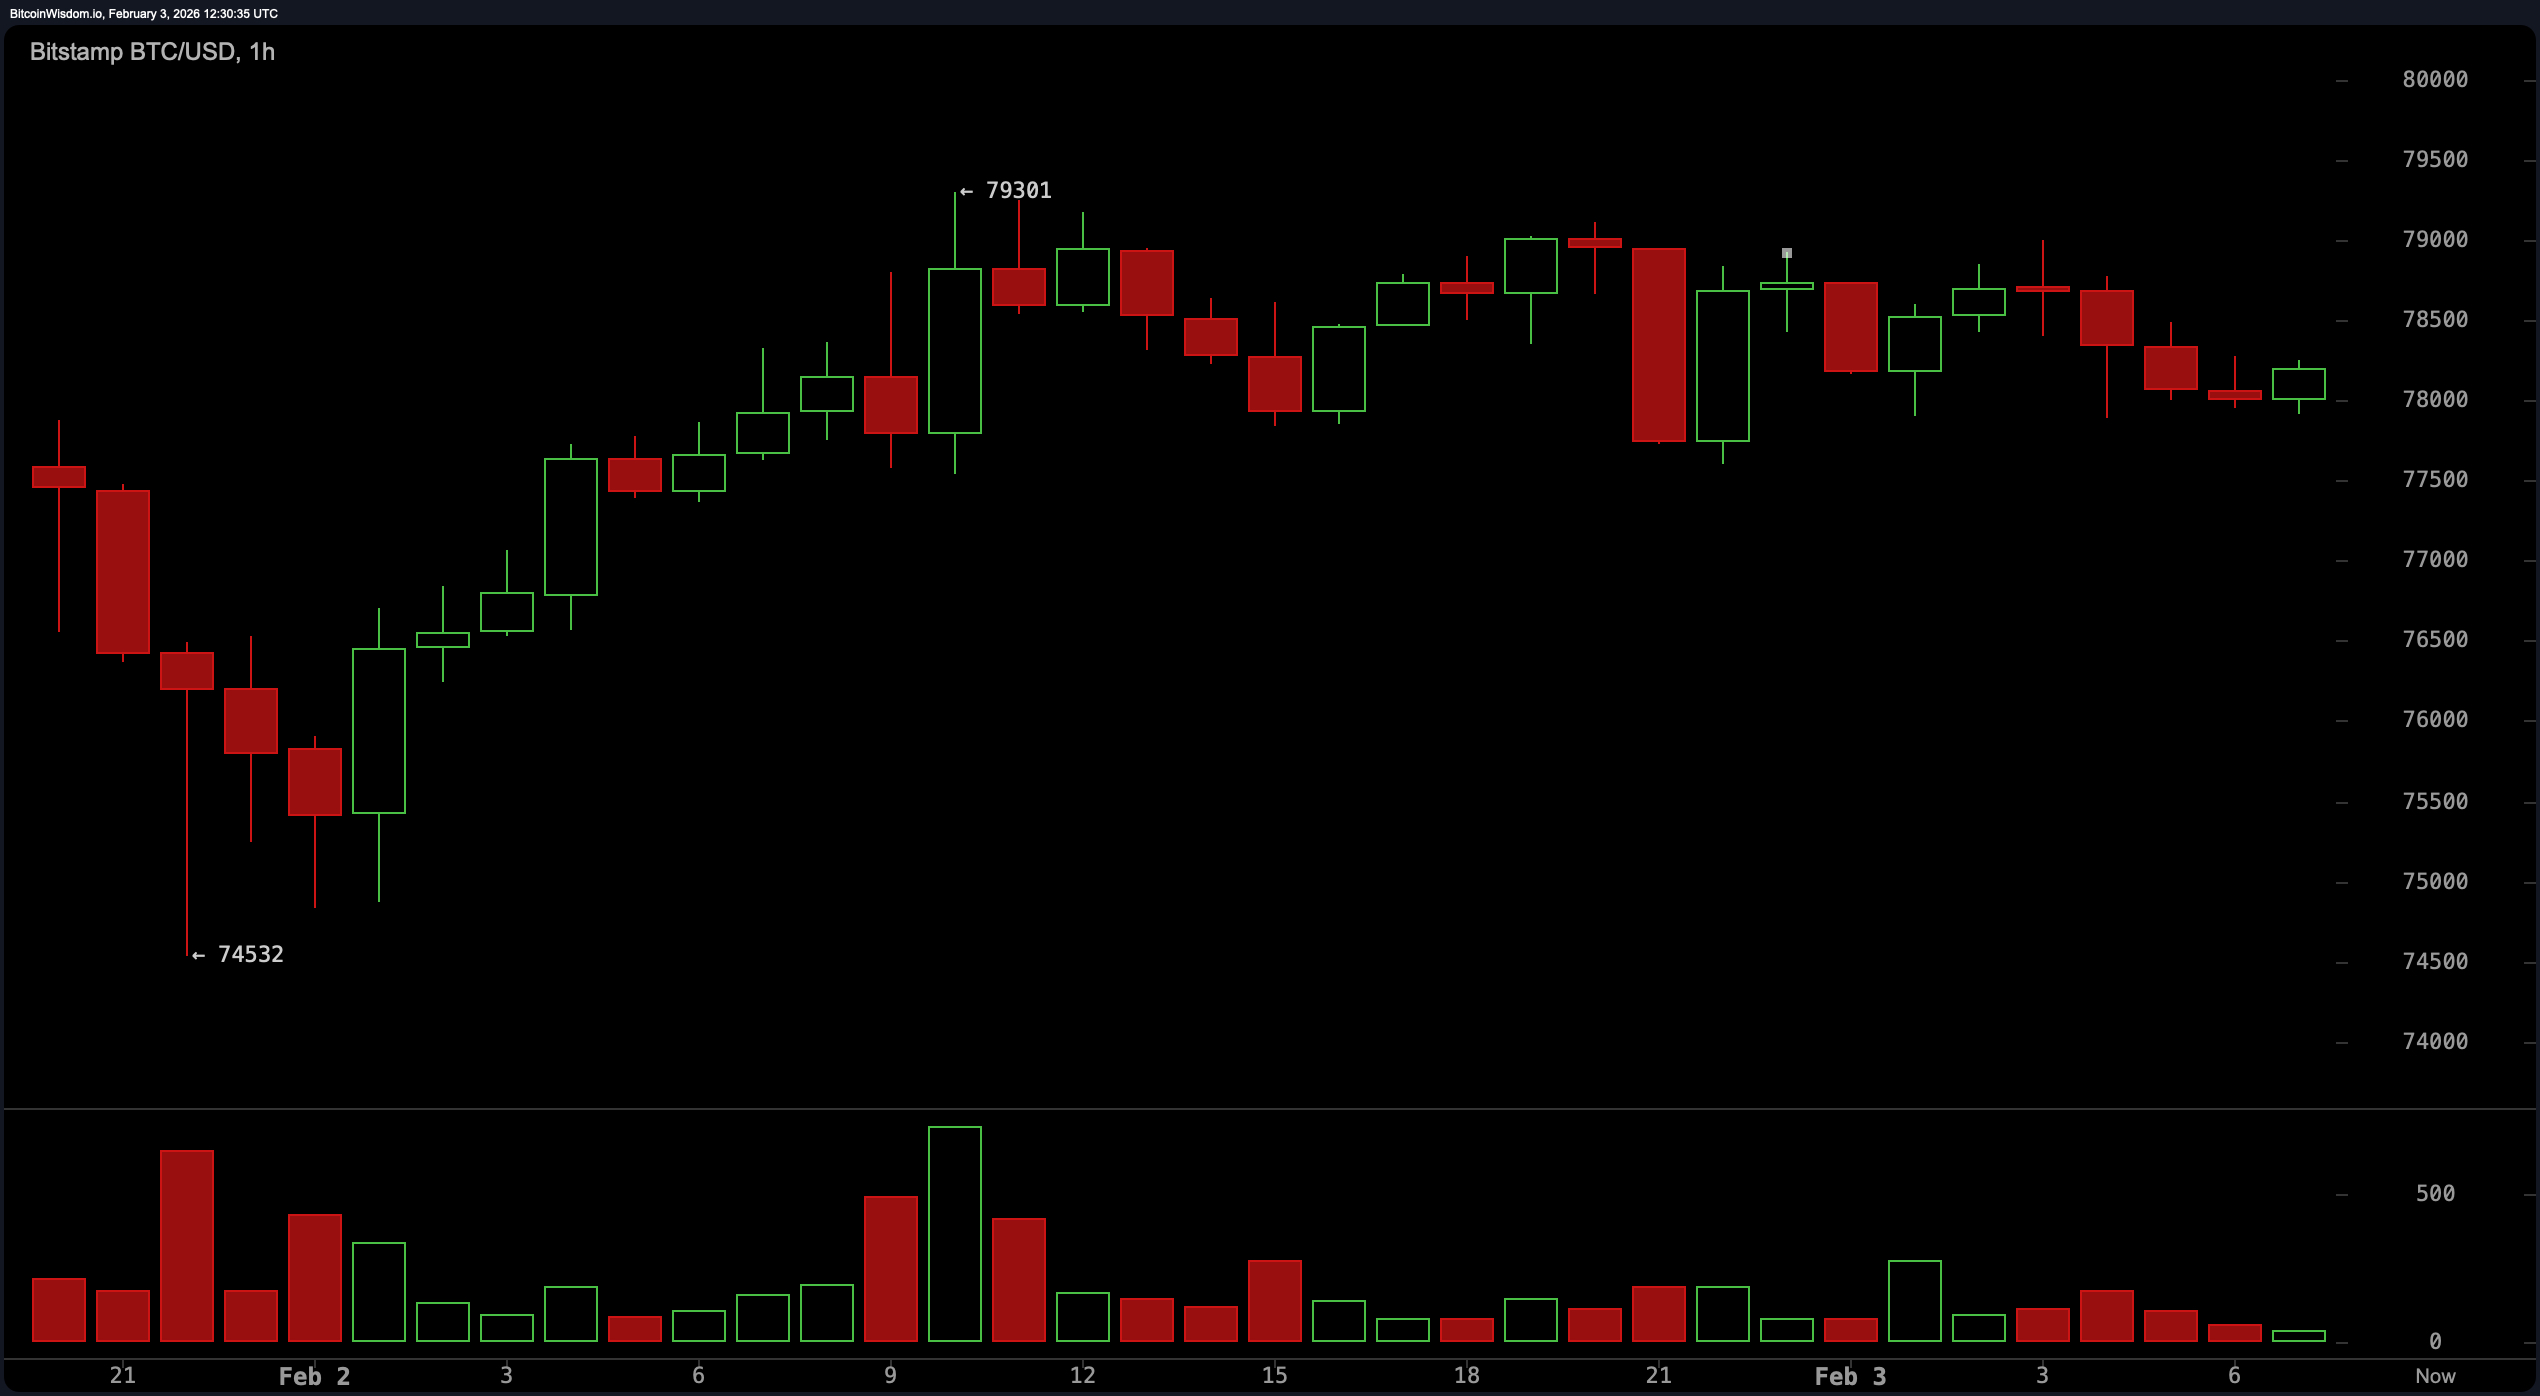
Zooming into the 1-hour chart, we see momentum that’s running on fumes. After topping out near $79,301, bitcoin has slipped into a pattern of lower highs—never a good look on the runway of intraday trends. Volume has dwindled during this sideways stretch, signaling confusion more than conviction. The microstructure screams stalling momentum, which often precedes either a sharp pop or an unceremonious flop. Traders watching for breakouts should temper expectations until bitcoin picks a side with volume to match.
Now to the oscillators—the real heartbeat of technical analysis. The relative strength index ( RSI) sits at a subdued 29, a level that flirts with oversold territory but lacks enough energy to generate reliable signals. The stochastic oscillator is down at 17, and the commodity channel index (CCI) has plummeted to −138, both hinting at possible exhaustion on the downside. However, the momentum indicator and moving average convergence divergence ( MACD) are posting figures of −10,920 and −3,235 respectively—hardly the stuff of a bullish fairytale. These indicators suggest the bounce lacks depth and direction.
As for moving averages, bitcoin is a walking contradiction to every major trend line. From the 10-period exponential moving average (EMA) at $82,452 to the 200-period simple moving average (SMA) at $103,541, all indicators are trailing far above current price, flashing the kind of alignment that would make trend-followers wince. This blanket of resistance from short to long time frames hints at a macro environment that hasn’t forgiven the recent fall. Until bitcoin claws its way back above at least the 50-period averages, its technical backdrop will likely remain on the defensive.
Bottom line? bitcoin isn’t dead, but it sure isn’t dancing. The market is trapped in a volatility-driven tug-of-war where conviction is scarce and range-bound trading reigns. Until it decisively conquers $82,000 or loses its grip on $74,500, it’s wise to view this chart with a side of skepticism and a whole lot of patience.
Bull Verdict:
If bitcoin can muscle its way above $80,000 with conviction—ideally clearing $82,000 on strong volume—momentum could shift rapidly. A move like that would break the current range and potentially invite trend-followers back into the ring, especially with oversold signals stacking up across multiple oscillators.
Bear Verdict:
Unless bitcoin reclaims key moving averages and shatters the $82,000 ceiling, the path of least resistance remains downward. The current bounce lacks both structure and strength, and the technical landscape is still littered with lower highs, heavy overhead resistance, and limp momentum.
FAQ ❓
- What is bitcoin’s current price today? bitcoin is trading at $78,162 with a 24-hour range between $77,642 and $79,130.
- Is bitcoin in an uptrend or downtrend?The broader trend remains down, with resistance stacked above $80,000.
- What are key levels to watch now?Support sits around $74,500–$76,000, while resistance looms near $80,000–$82,000.
- Are technical indicators bullish or bearish?Most oscillators and moving averages suggest continued weakness in the short term.