Exchange figures pegged at Bitcoin’s low at around $75,644 that day, dipping below the mean purchase price for key U.S. exchange traded funds at $84,000 – resulting in a gap of up to 10%. It even got past a tracked entry point of $76,037 and skated close to the annual floor from April of 2025’s policy-driven selloff of $74,420..
Patterns from previous cycles indicate that 40% retreats from records are seldom the final step; they often surge to 50% or more in less than three months. Applied here, that translates to about $63,000. Ownership information on the ledger shows thin activity from $82,000 to $70,000, perhaps pulling down prices to see buying interest there.
Key gauges incorporate the mean level of realization going on close to $56,000, with 200-week mean going on close to $58,000, both edging up daily with quotes remaining higher. Signs of heavy buying from major players or established owners are still in short supply, though profit sales from long-term groups have slackened recently.
Bitcoin has taken a different path from metals, such as gold, in anti-inflation plays. Regulatory shifts, including a proposed clarity bill for crypto, seem less likely in the near future and the benefits might fall toward smaller coins if it passes.
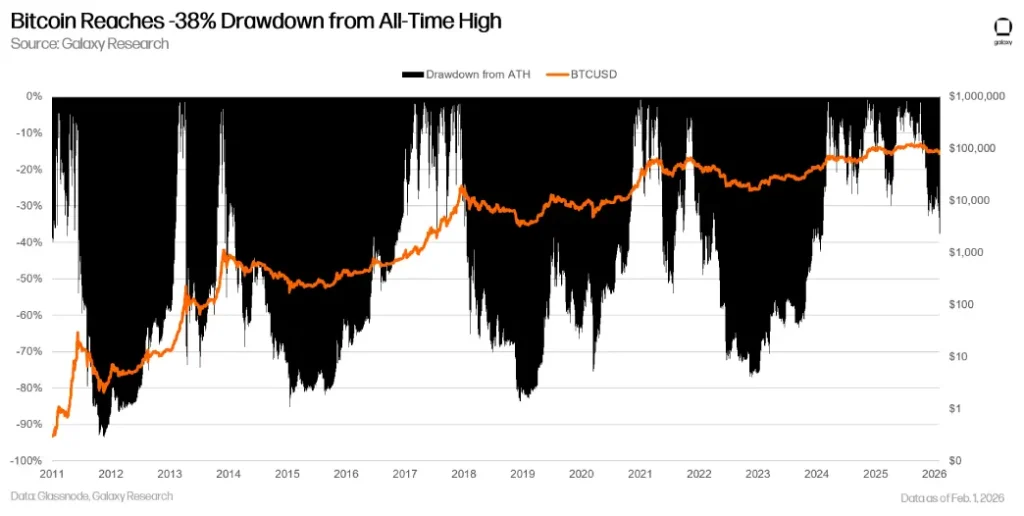
Galaxy Digital’s research head, Alex Thorn has pointed out in recent notes that such drawdowns challenge the lower bands, which may stabilize closer to $70,000 before testing the $56,000 to $58,000 zone – areas that have anchored previous lows. Volatility could hover around $76,000, linked to historical volatility from fund averages, but a deeper slide could hit those lower levels in several weeks from now, adjusting higher if there are going to be delays.
Head and Shoulder Pattern Set Bitcoin Price Correction For $60,000 Target
On January 31st, the Bitcoin price correction gave a decisive breakdown from the support trendline of head and shoulders pattern at $82,323. The chart setup is commonly spotted at major market tops and reflects a change in market direction.
Currently, the $BTC price trades at $78,553, maintaining its stability above the $75,000 psychological level. The post-correction may push the price back to $82,300 and retest this level as potential resistance.
If the overhead supply persists, the sellers may drive an extended correction of $66,700, followed by $60,000.
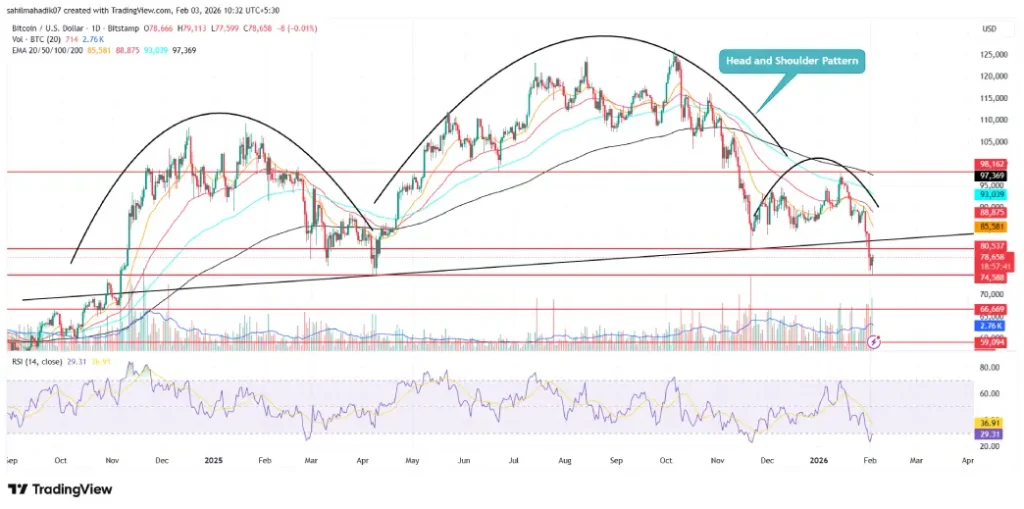
$BTC/USDT -1d Chart
On the contrary note, if the buyers reclaims the $82,300 support, the Bitcoin price could shift sideways to renew its bullish momentum.

 cryptonewsz.com