
In this febrile crypto moment, bitcoin’s showing off its classic mix of drama and indecision. A wild ride between $74,532 and $78,610 sets the tone, with volume clocking in at a staggering $86.03 billion—because what’s a day in crypto without a bit of whiplash? The market cap plants its flag at $1.55 trillion, but beneath the surface, the charts whisper caution. With technicals flaring contradictory signals across timeframes, this isn’t your average day at the digital rodeo.
Bitcoin Chart Outlook
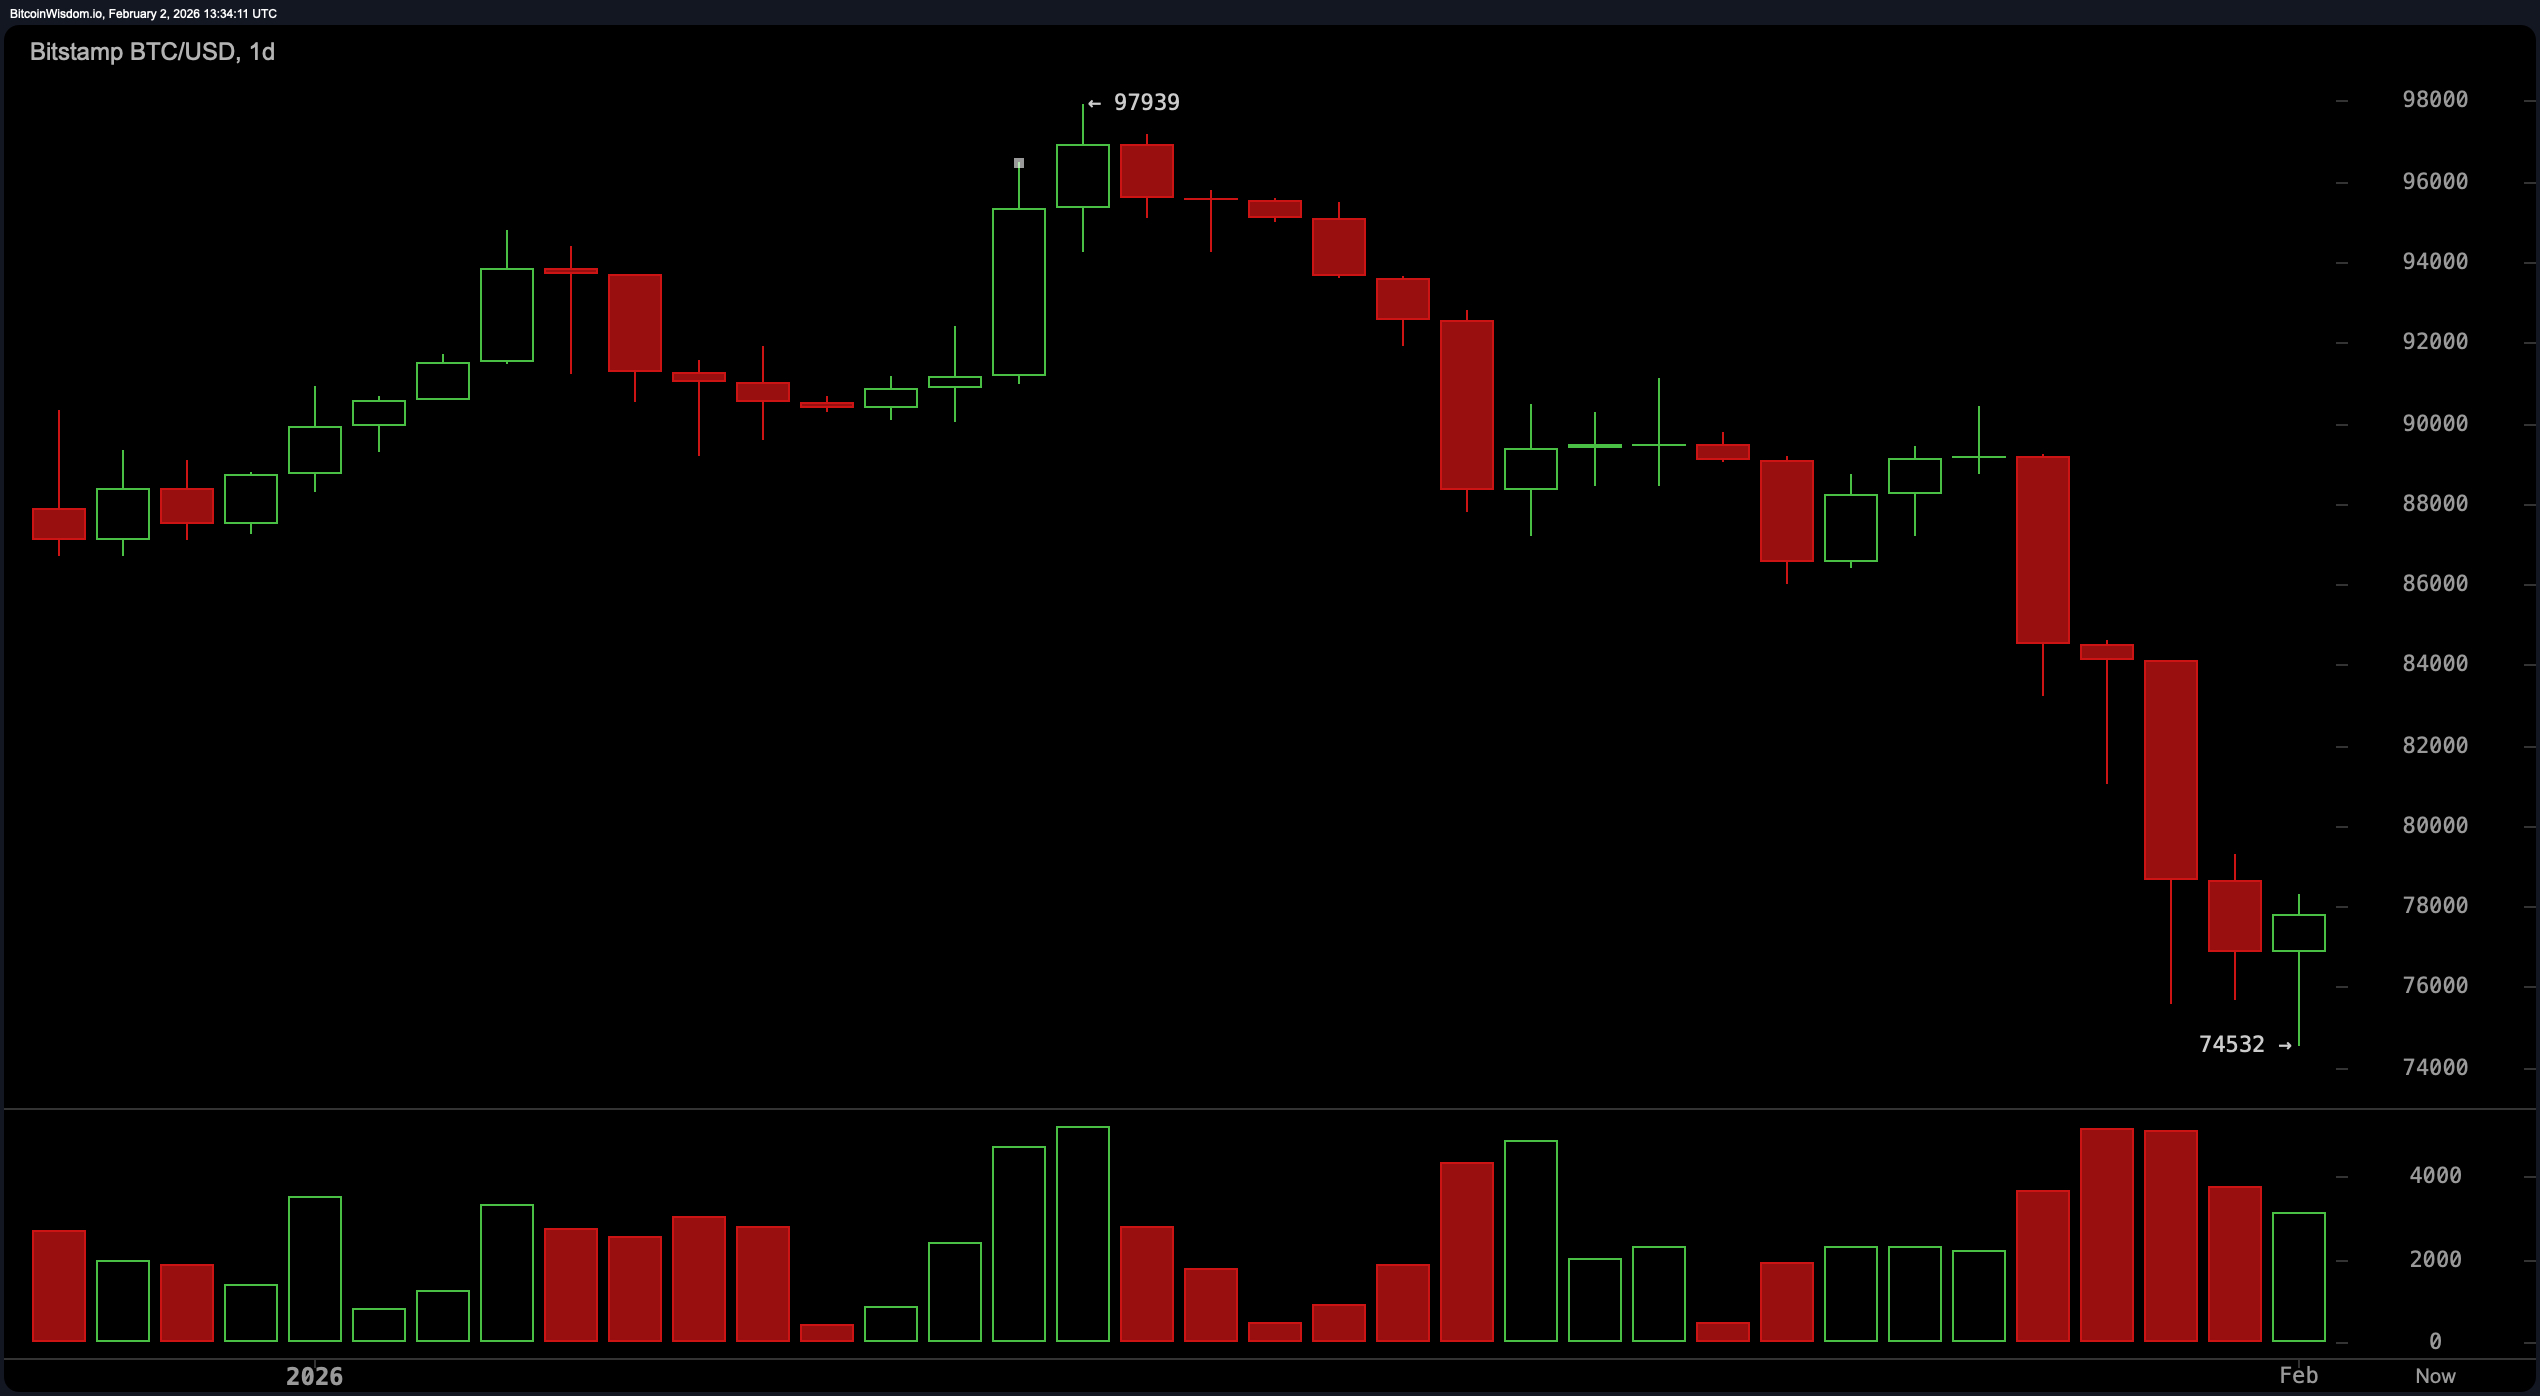
The daily chart is practically screaming “I’ve fallen and I can’t get up.” Bitcoin collapses from a failed push near $97,900, trading well below major moving averages and confirming a breakdown in trend structure. The pair of lower highs and lower lows reads like a textbook bearish narrative.
Support kicks in near $74,000 and $74,500, a level now serving as bitcoin’s line in the sand, while any serious upside would require a bold reclaim of $82,000. Elevated sell-side volume on the breakdown versus meek participation on the bounce betrays weak conviction from the bulls, who seem to be nursing their wounds and not doubling down.
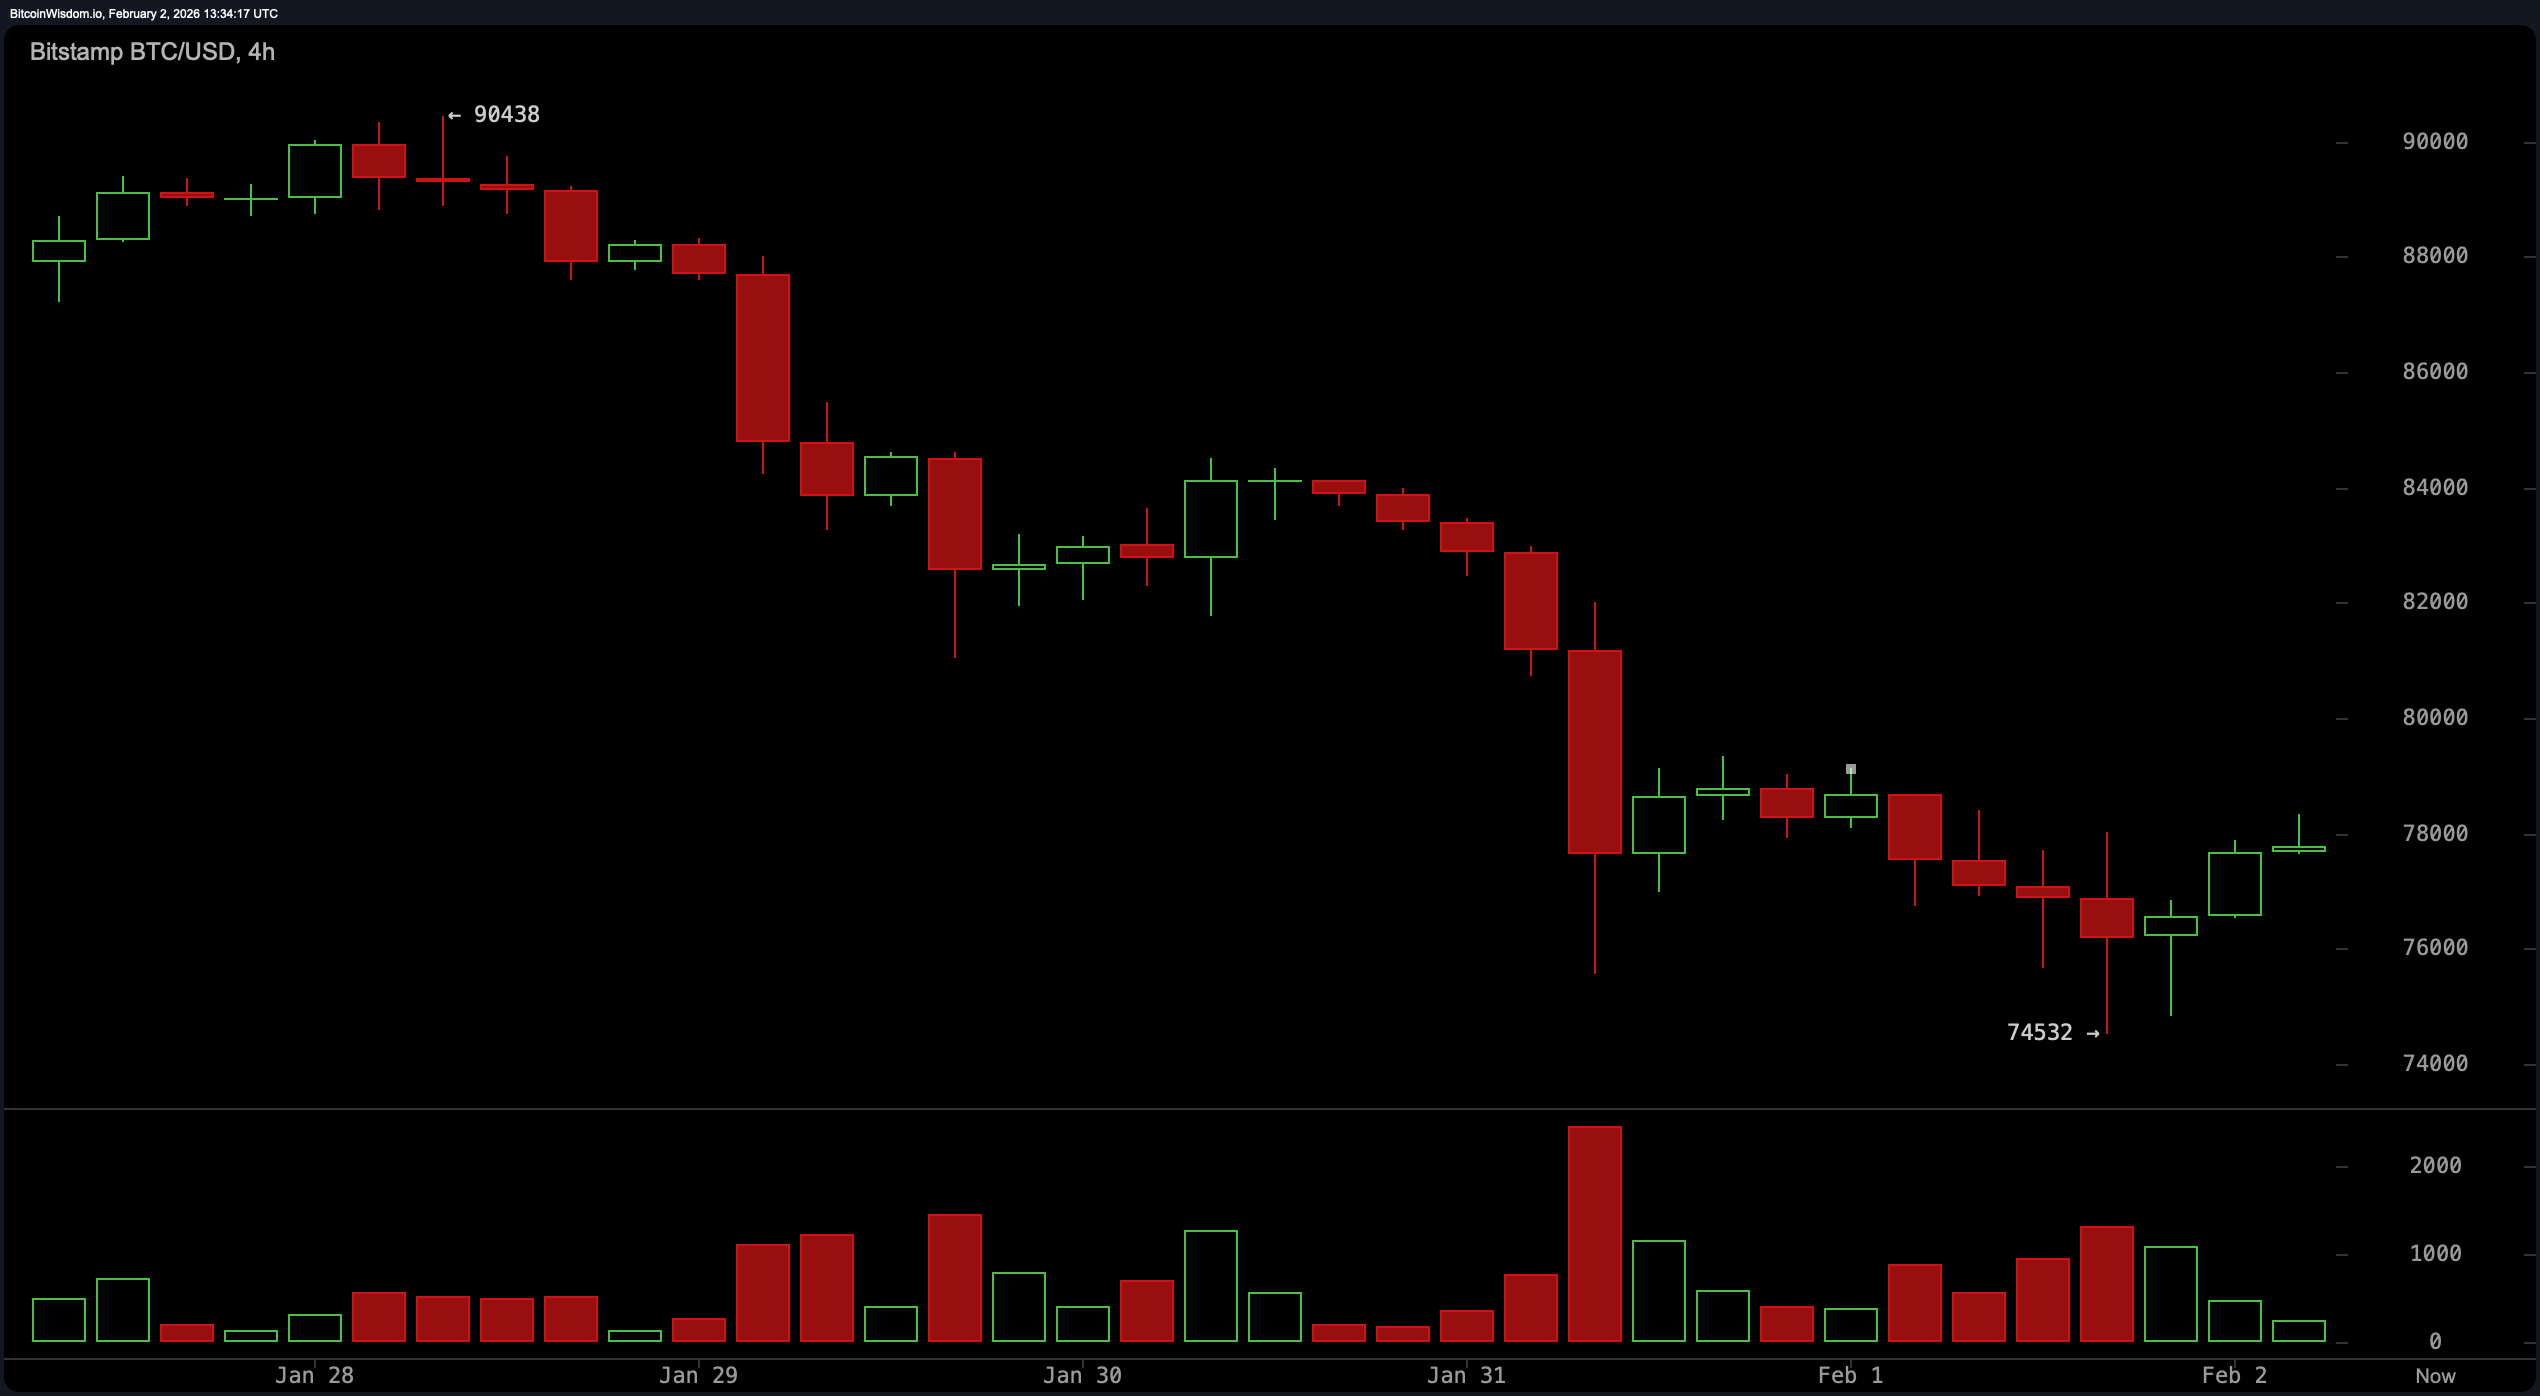
On the 4-hour chart, there’s a touch more optimism—but let’s not break out the champagne just yet. The price carves out a tentative base around $74,500, managing to print some higher lows like it’s trying to re-establish itself after a crypto hangover. Still, the bounce looks more like a light jog than a sprint; momentum is muted and resistance looms overhead between $79,000 and $81,500. Price compression in the $76,000 to $79,000 range suggests we’re in a short-term decision zone, and any conviction needs to be backed with cleaner follow-through. Until then, this is more of a holding pattern than a breakout anthem.
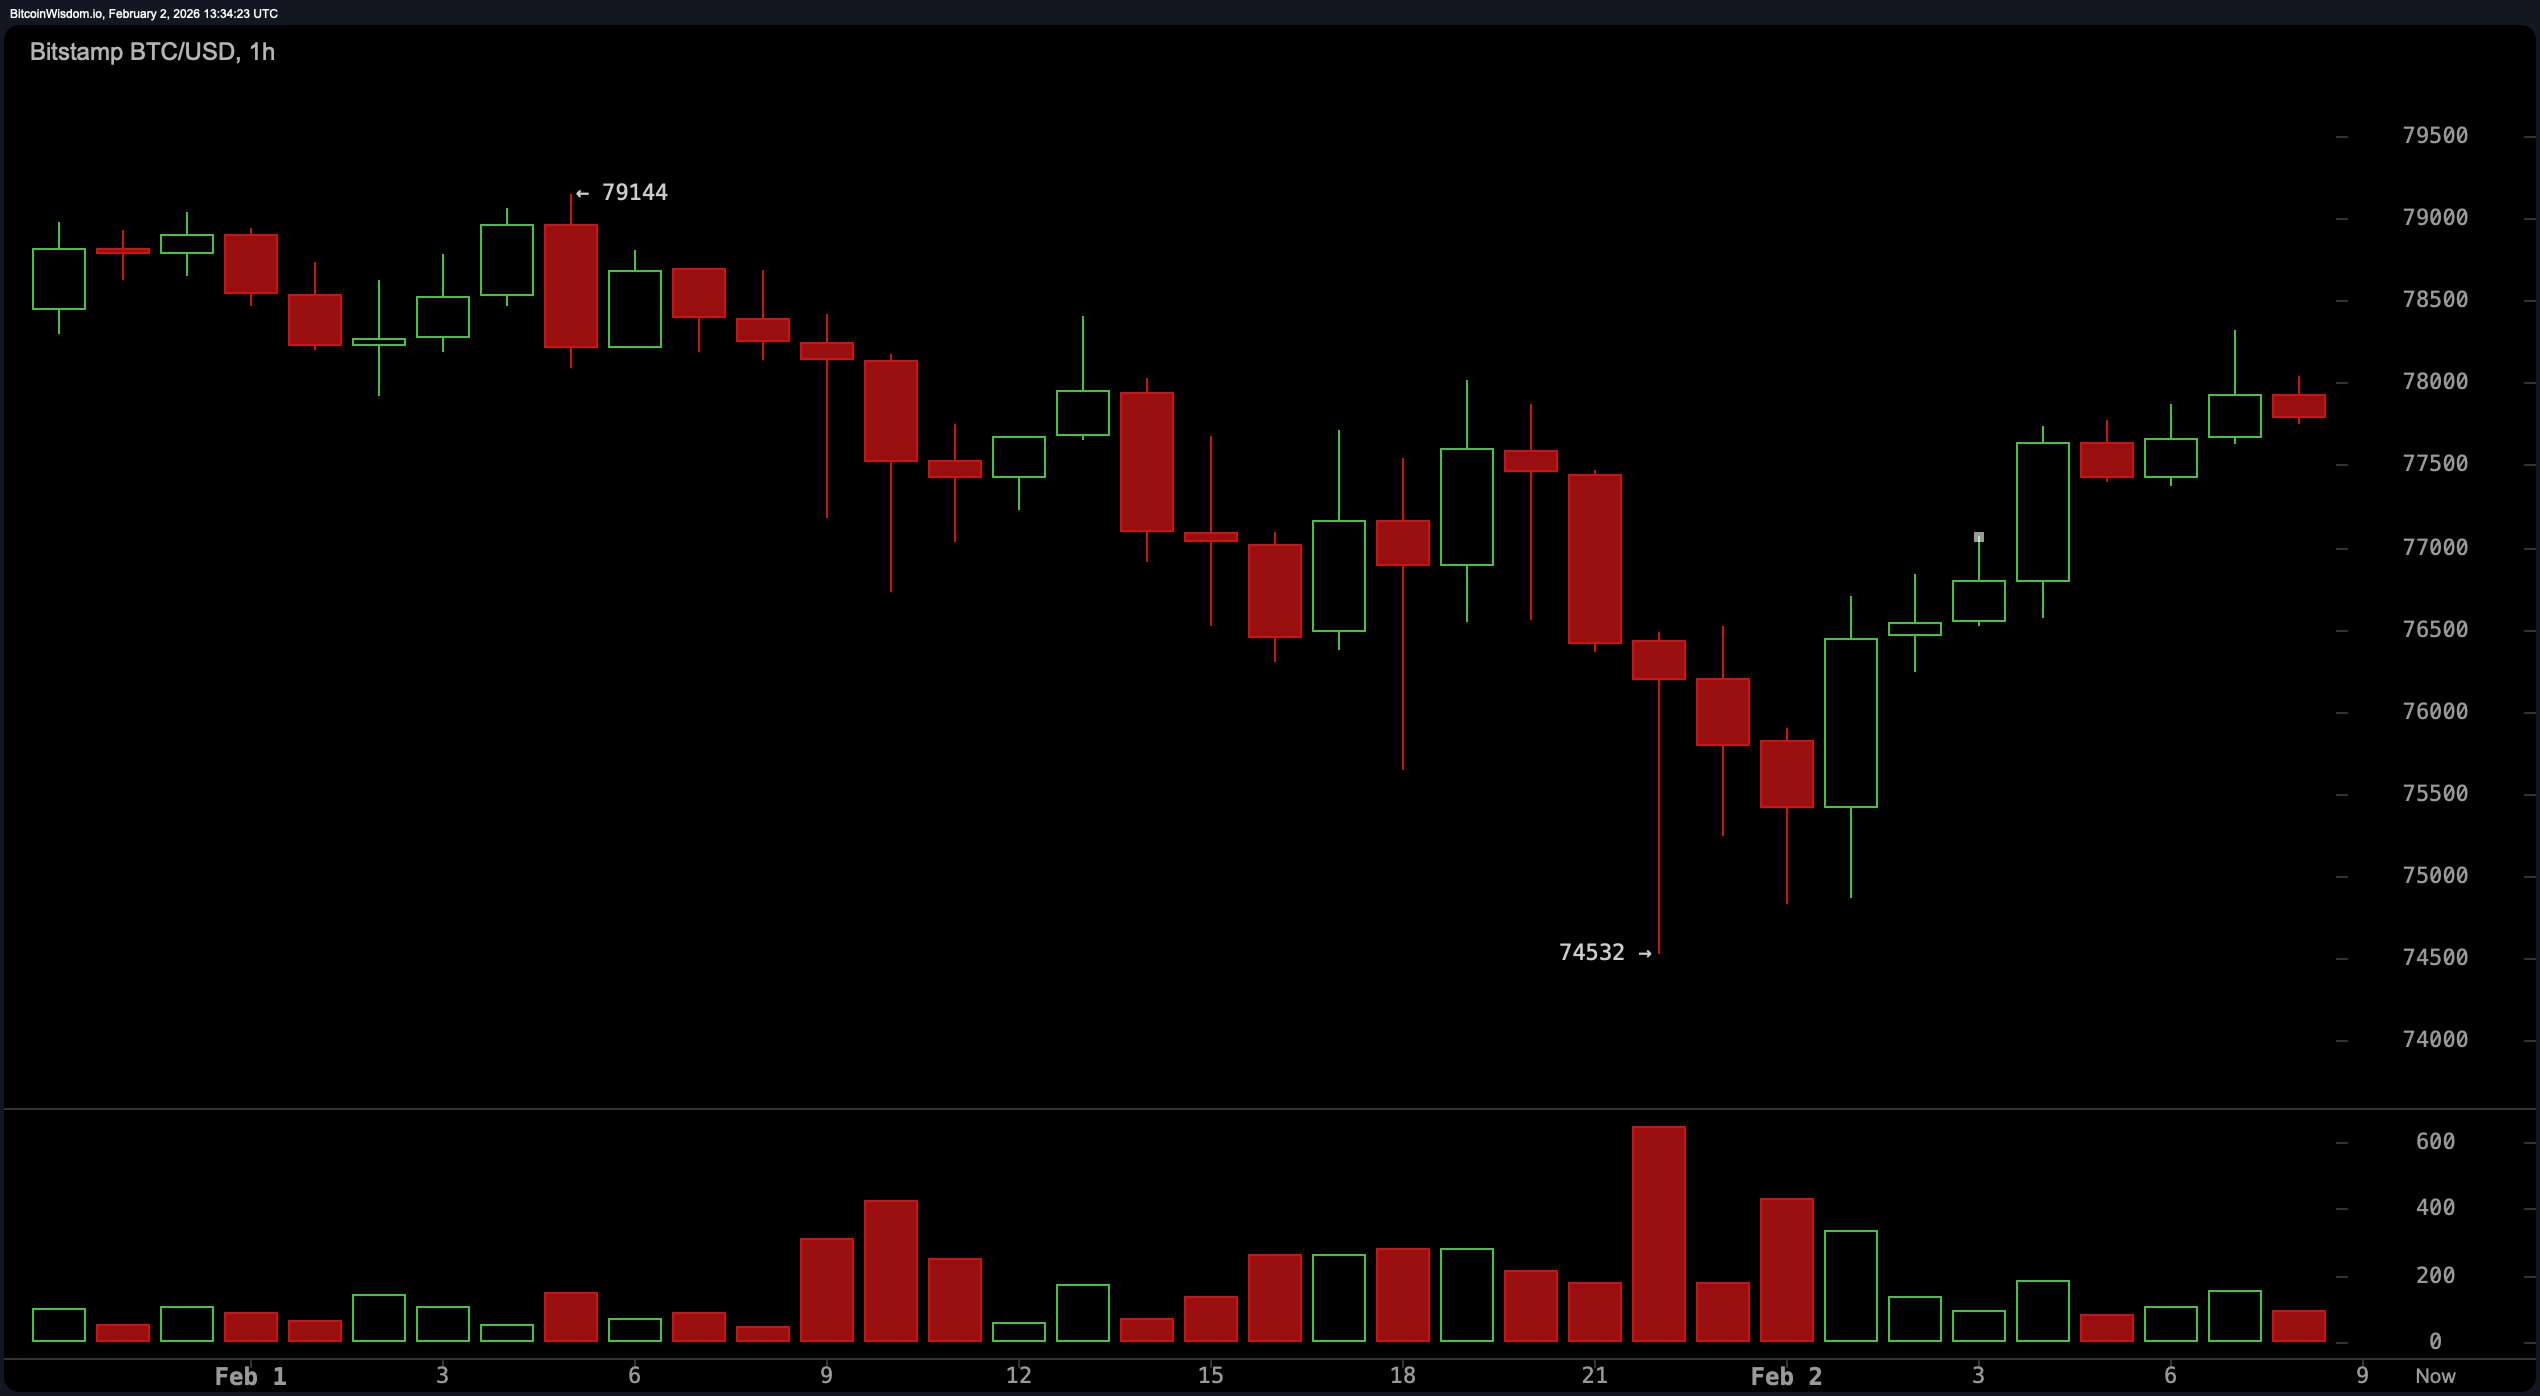
Zooming into the 1-hour chart, bitcoin stages what looks like a short-term recovery, climbing from a local low of $74,532. Tactical bulls show up with higher lows and scalp-worthy setups around $75,500 to $76,200. But the rally hits its head repeatedly against the $78,500–$79,200 ceiling, where sellers step in like clockwork. Buyers show up, yes—but those candles near resistance are tiptoeing, not charging. In short: the bounce is real, but the commitment? Questionable.
Oscillator signals are about as mixed as a bag of altcoins at a meme-coin convention. The relative strength index ( RSI) sits at 27, suggesting bitcoin is knocking on the door of oversold territory. The commodity channel index (CCI) throws in a deeply negative read at -183, echoing similar exhaustion. The momentum oscillator prints a heavy -11,674, while the moving average convergence divergence ( MACD) shows a level of -3,039, tilting cautiously toward downside pressure. Meanwhile, the Stochastic and average directional index (ADX) indicators hover in neutral purgatory, waiting for the price action to pick a side.
Then come the moving averages, and let’s just say: they’re not pulling any punches. Every major exponential moving average (EMA) and simple moving average (SMA)—from 10 to 200 periods—sits above current price, delivering a collective shrug to bullish arguments. The 10-period EMA at $83,253 and the 200-period SMA towering at $103,737 form a canyon of resistance. Technically, this puts bitcoin in a confirmed downtrend across the board, unless something wild pushes price back above at least the $82,000 mark. Until then, the averages aren’t just unkind—they’re downright dismissive.
In sum, the charts are aligned in one message: the bounce is on—but it’s tentative, tactical, and hanging by a thread called $74,000.
Bull Verdict:
If bitcoin holds the $74,000 to $74,500 floor and musters the strength to reclaim $82,000 with conviction, the groundwork is there for a meaningful rebound. The short-term higher lows and momentum stabilization on intraday charts lend cautious hope to bullish traders. Oversold oscillators like the relative strength index ( RSI) and commodity channel index (CCI) hint that downside momentum may be spent—for now. But the bulls will need volume, not vibes, to reverse the damage.
Bear Verdict:
Below $82,000, the trend remains decisively wounded—and below $74,500, the floor vanishes. The stacked moving averages paint a clear picture of structural weakness, while the daily breakdown signals distribution, not accumulation. Oscillators whisper oversold, but momentum and MACD say the pain may not be over. Until buyers reclaim key levels with strength, this bounce risks being nothing more than a dead cat in designer fur.
FAQ ❓
- What is bitcoin’s price on February 2, 2026? Bitcoin is trading at $77,870.
- What key support level are traders watching?$74,500 starts the critical support zone on all major timeframes.
- Is bitcoin showing bullish or bearish signals?Most indicators point to a bearish-to-neutral outlook below $82,000.
- What’s the trading volume for bitcoin in the past 24 hours?24-hour volume stands at $86.03 billion.