
A further drop remains the more likely scenario for most of the coins, according to CoinStats.
$BTC/USD
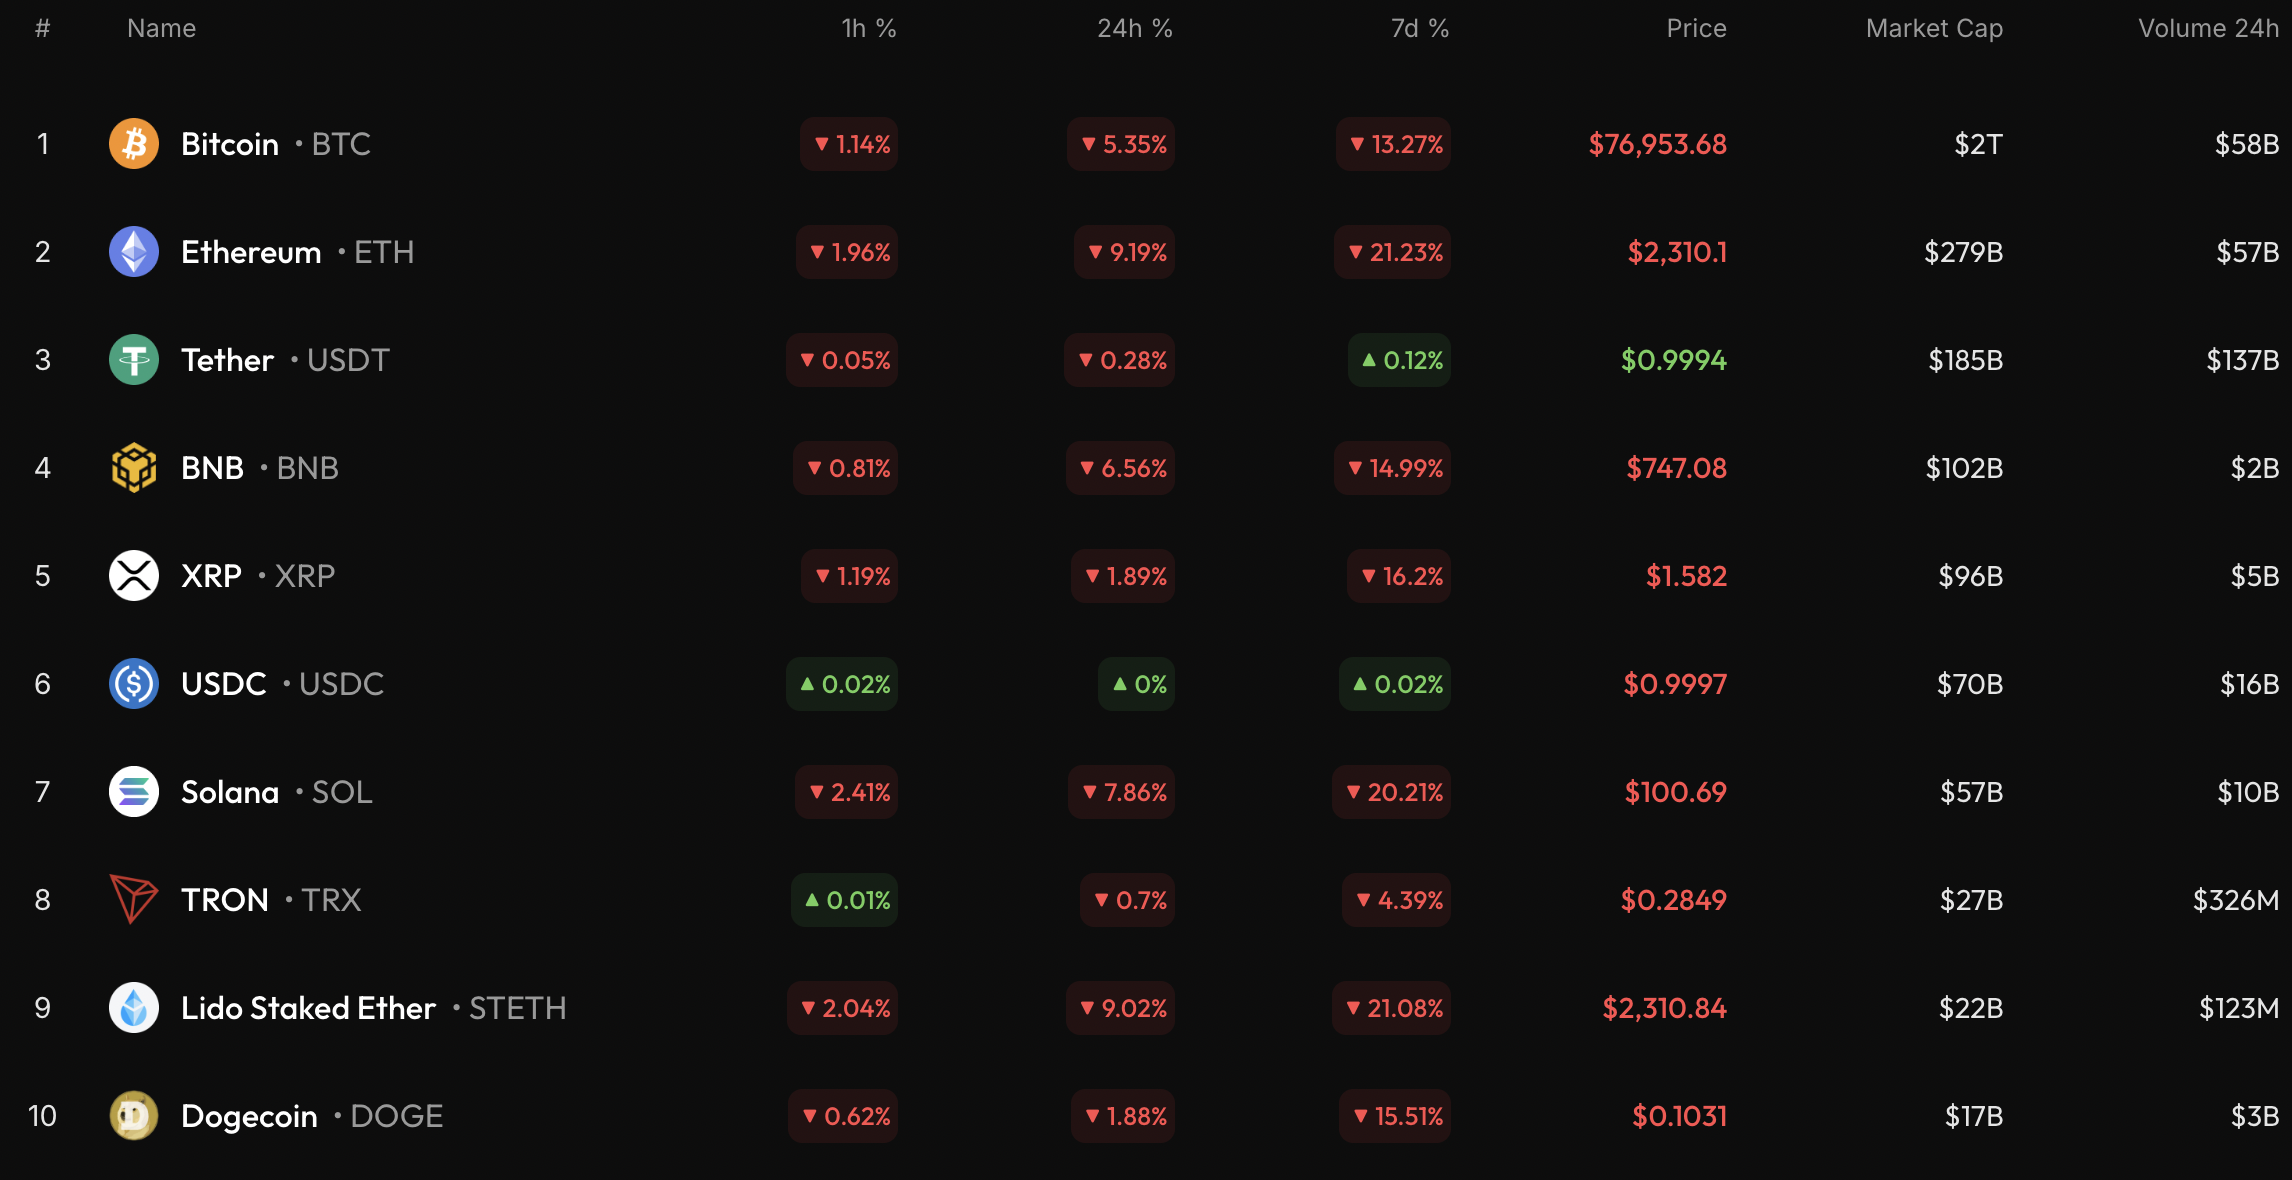
The rate of Bitcoin ($BTC) has declined by 5.35% over the last day.
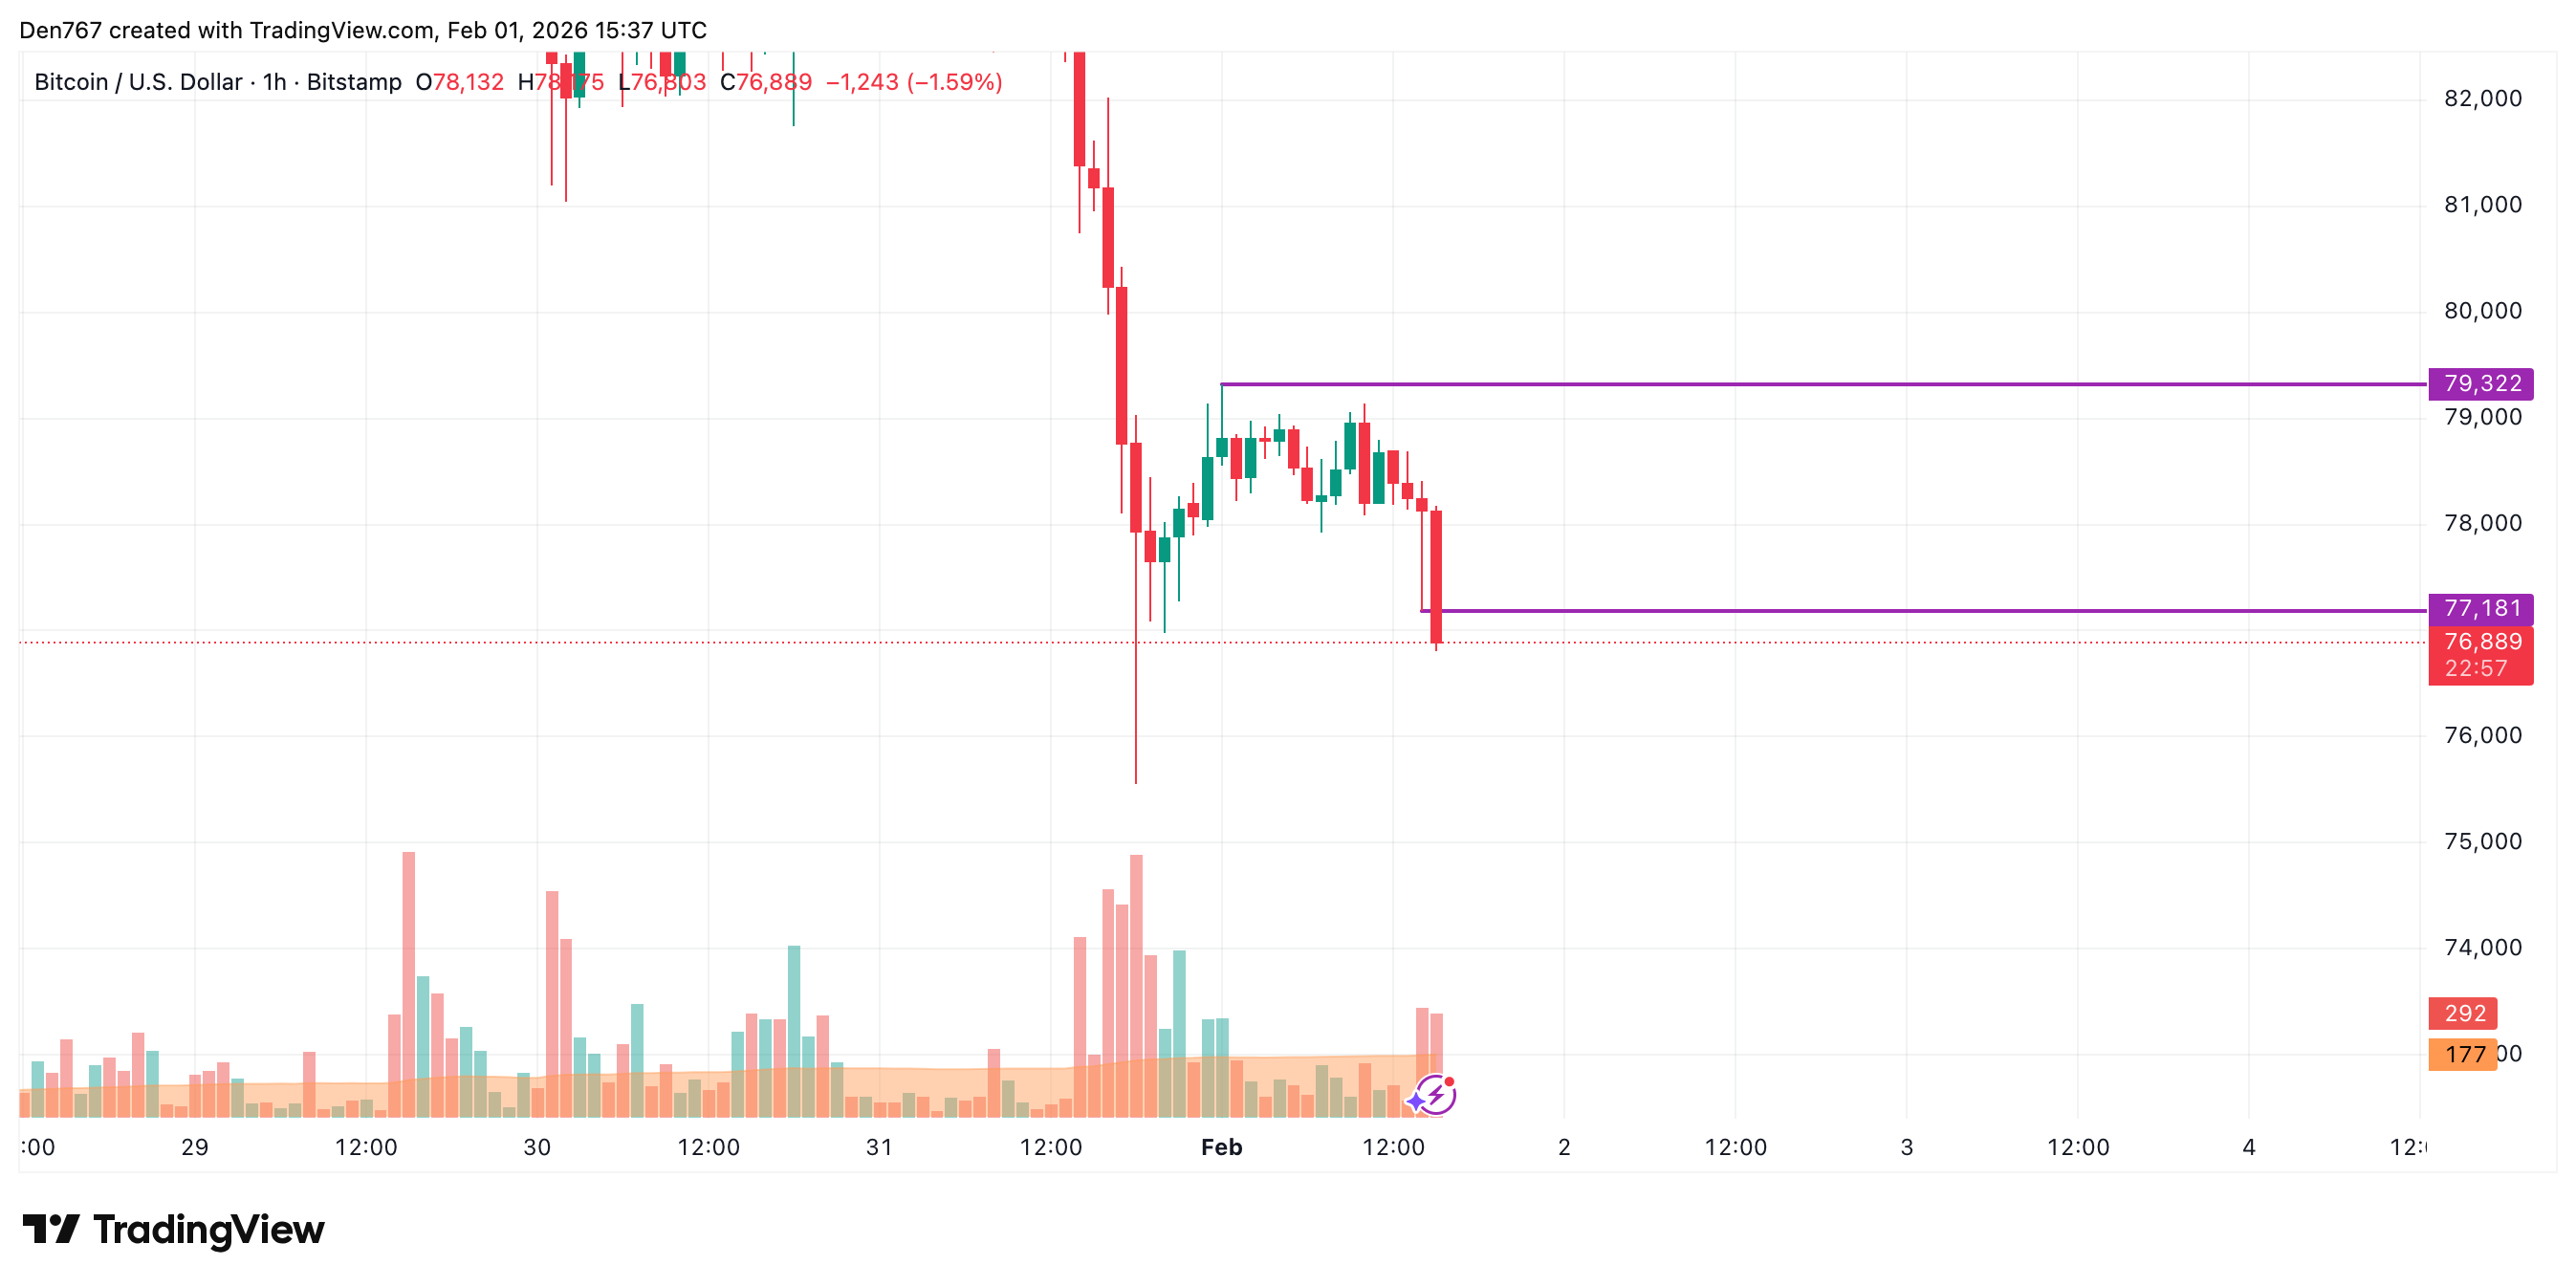
On the hourly chart, the price of $BTC is about to fix below the local support at $77,181. If it happens, the decline may lead to a test of the $75,000-$76,000 zone tomorrow.
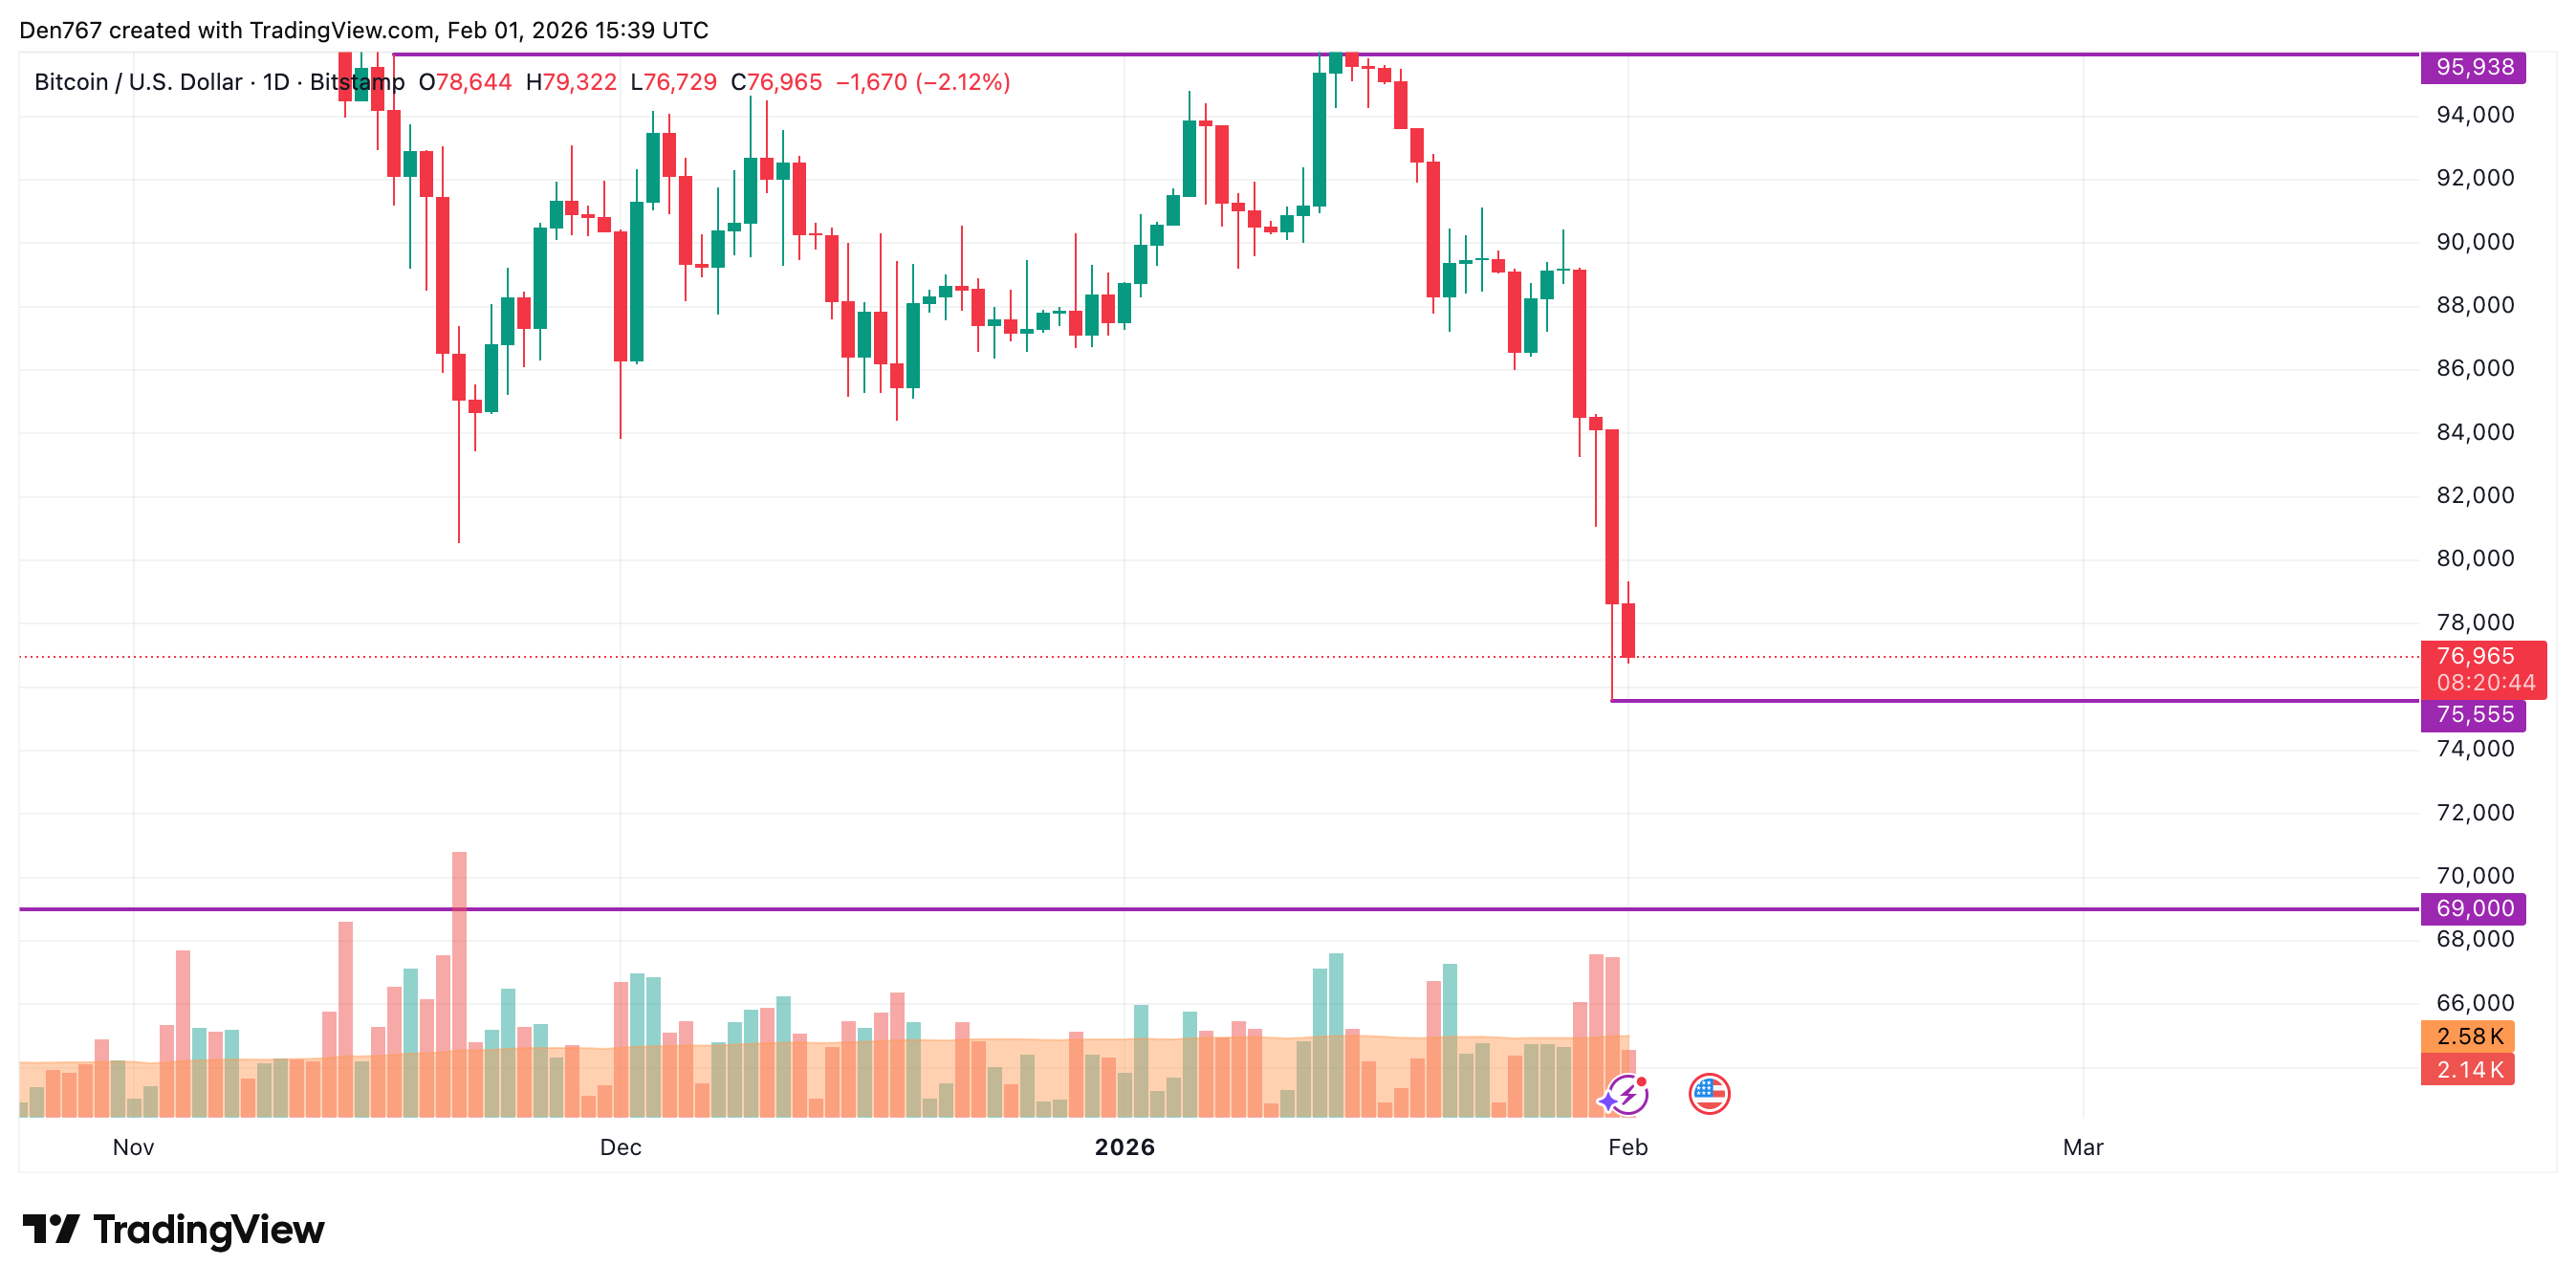
On the bigger time frame, the rate of the main crypto is far from the main levels. In this case, one should focus on the candle closure in terms of yesterday's bar low.
If it happens below $75,555, the decline is likely to continue to the $70,000 zone.
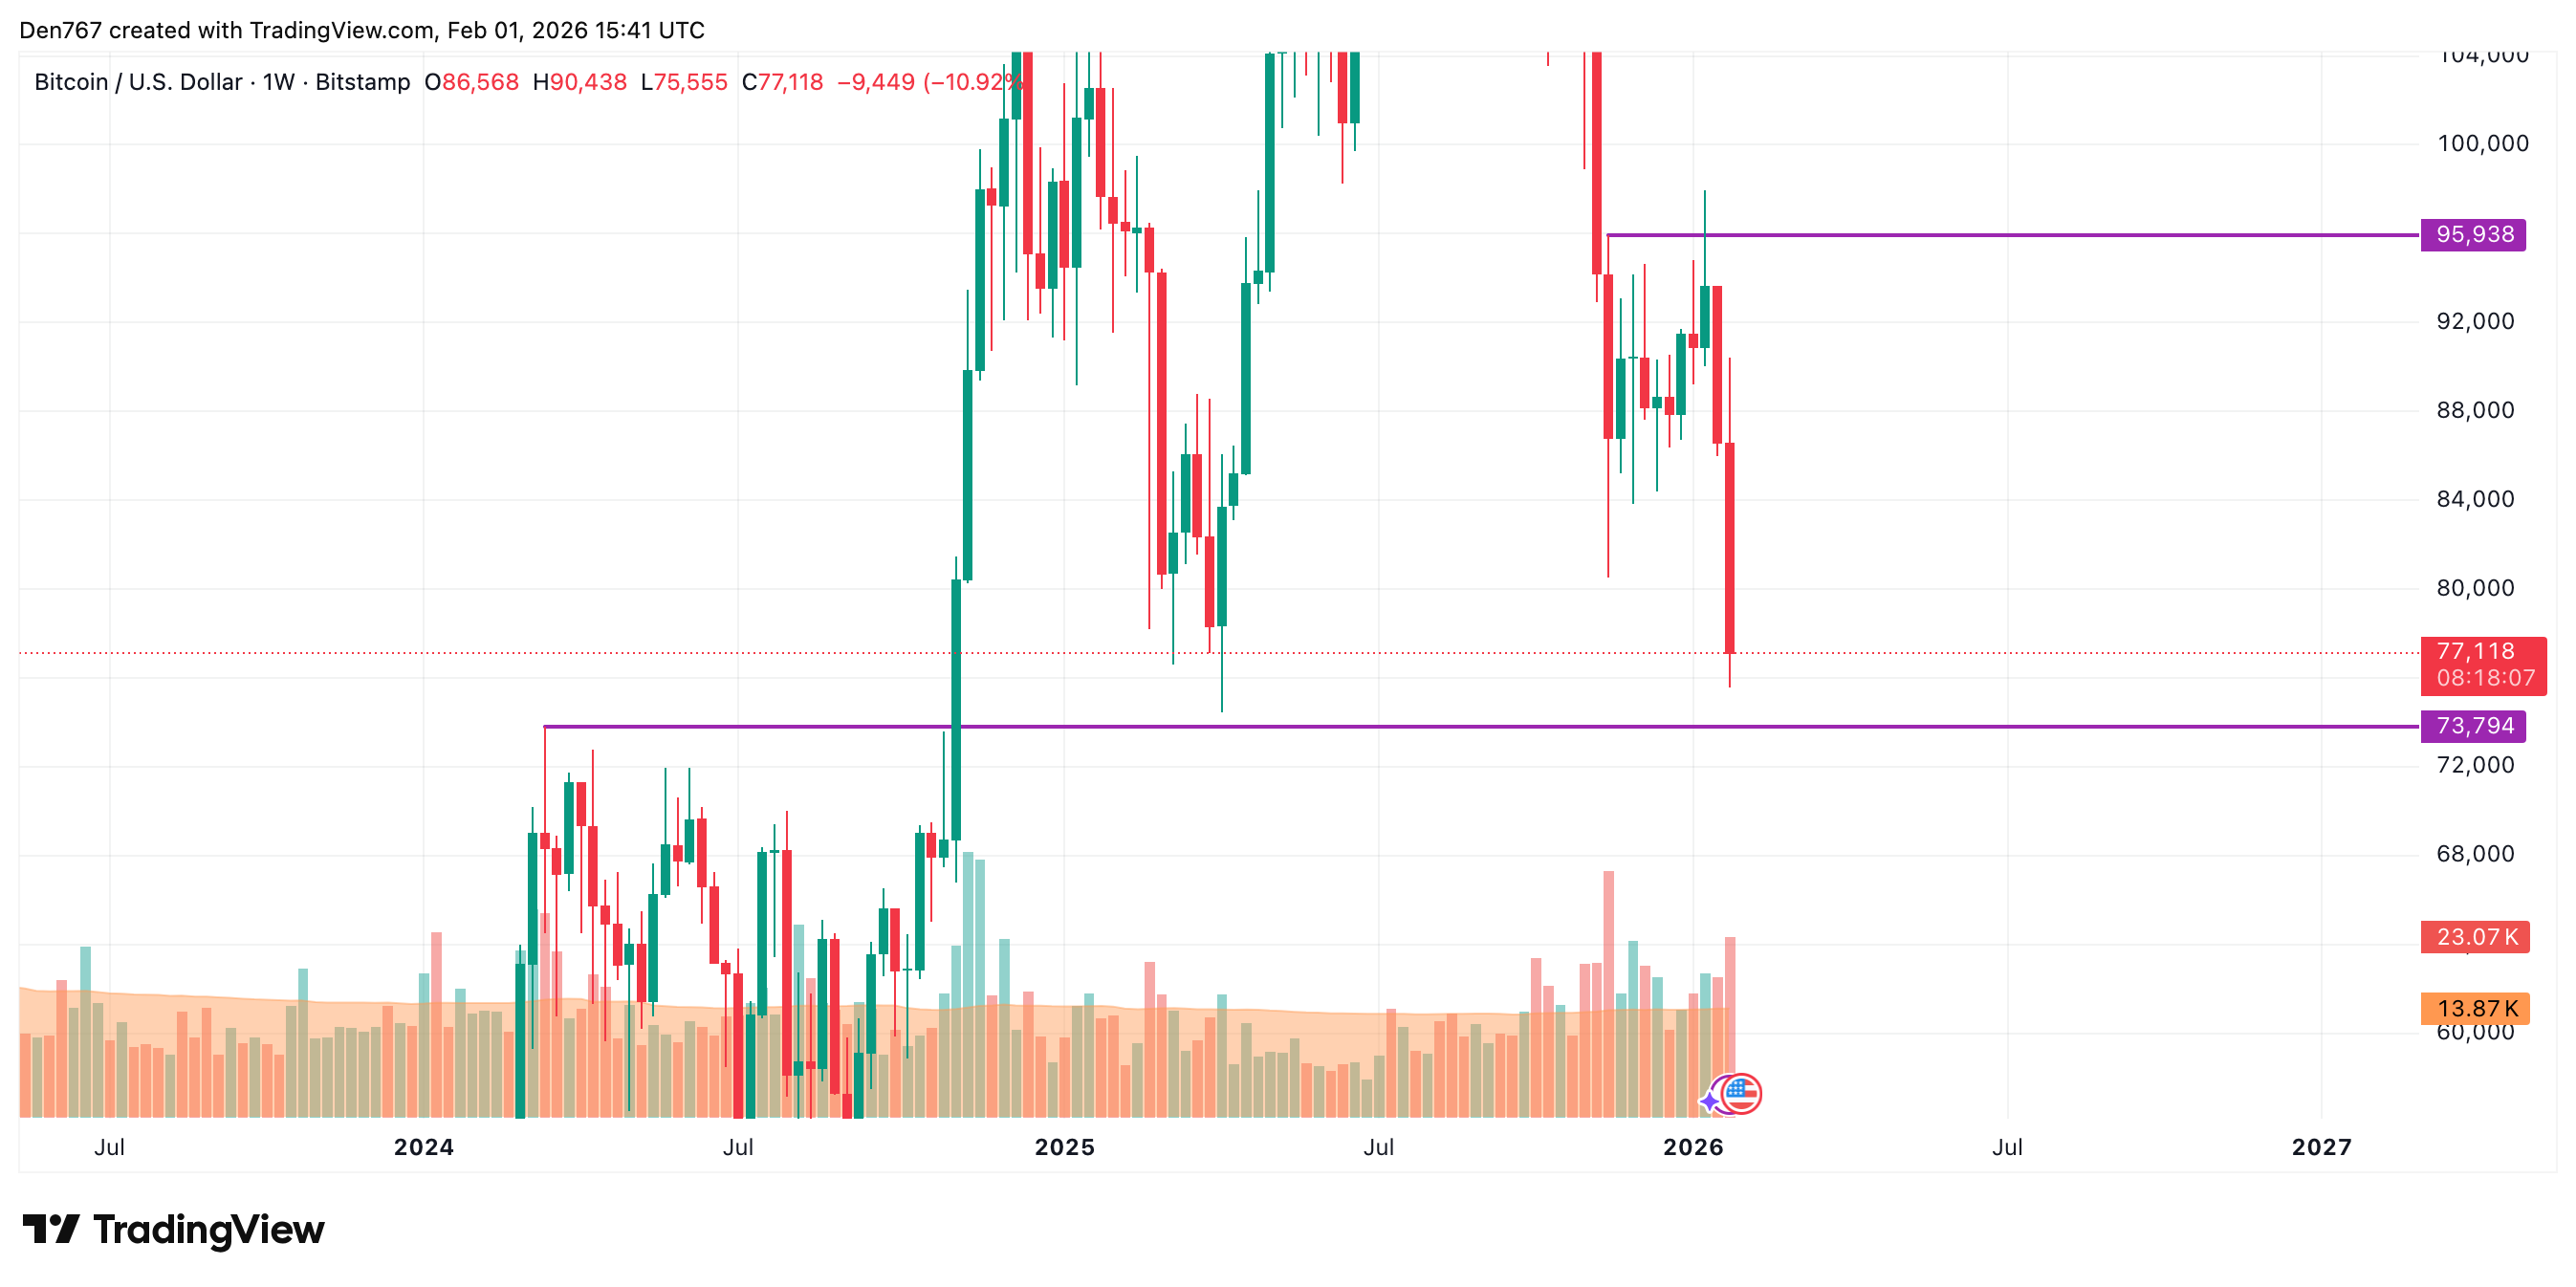
From the midterm point of view, the nearest level at $73,794 plays an important role in terms of further price movements. If a false breakout happens, there is a possibility to see a bounce back to the $76,000-$78,000 range.
Bitcoin is trading at $77,118 at press time.