
Bitcoin is priced at $78,634 as of Feb. 1, 2026, with a total market capitalization of $1.57 trillion. Over the past 24 hours, trading volume runs high at $83.65 billion, with intraday price swings ranging from $77,082 to $82,733. The market attempts to stitch together a recovery narrative—but for now, it’s more bandage than breakthrough.
Bitcoin Chart Outlook
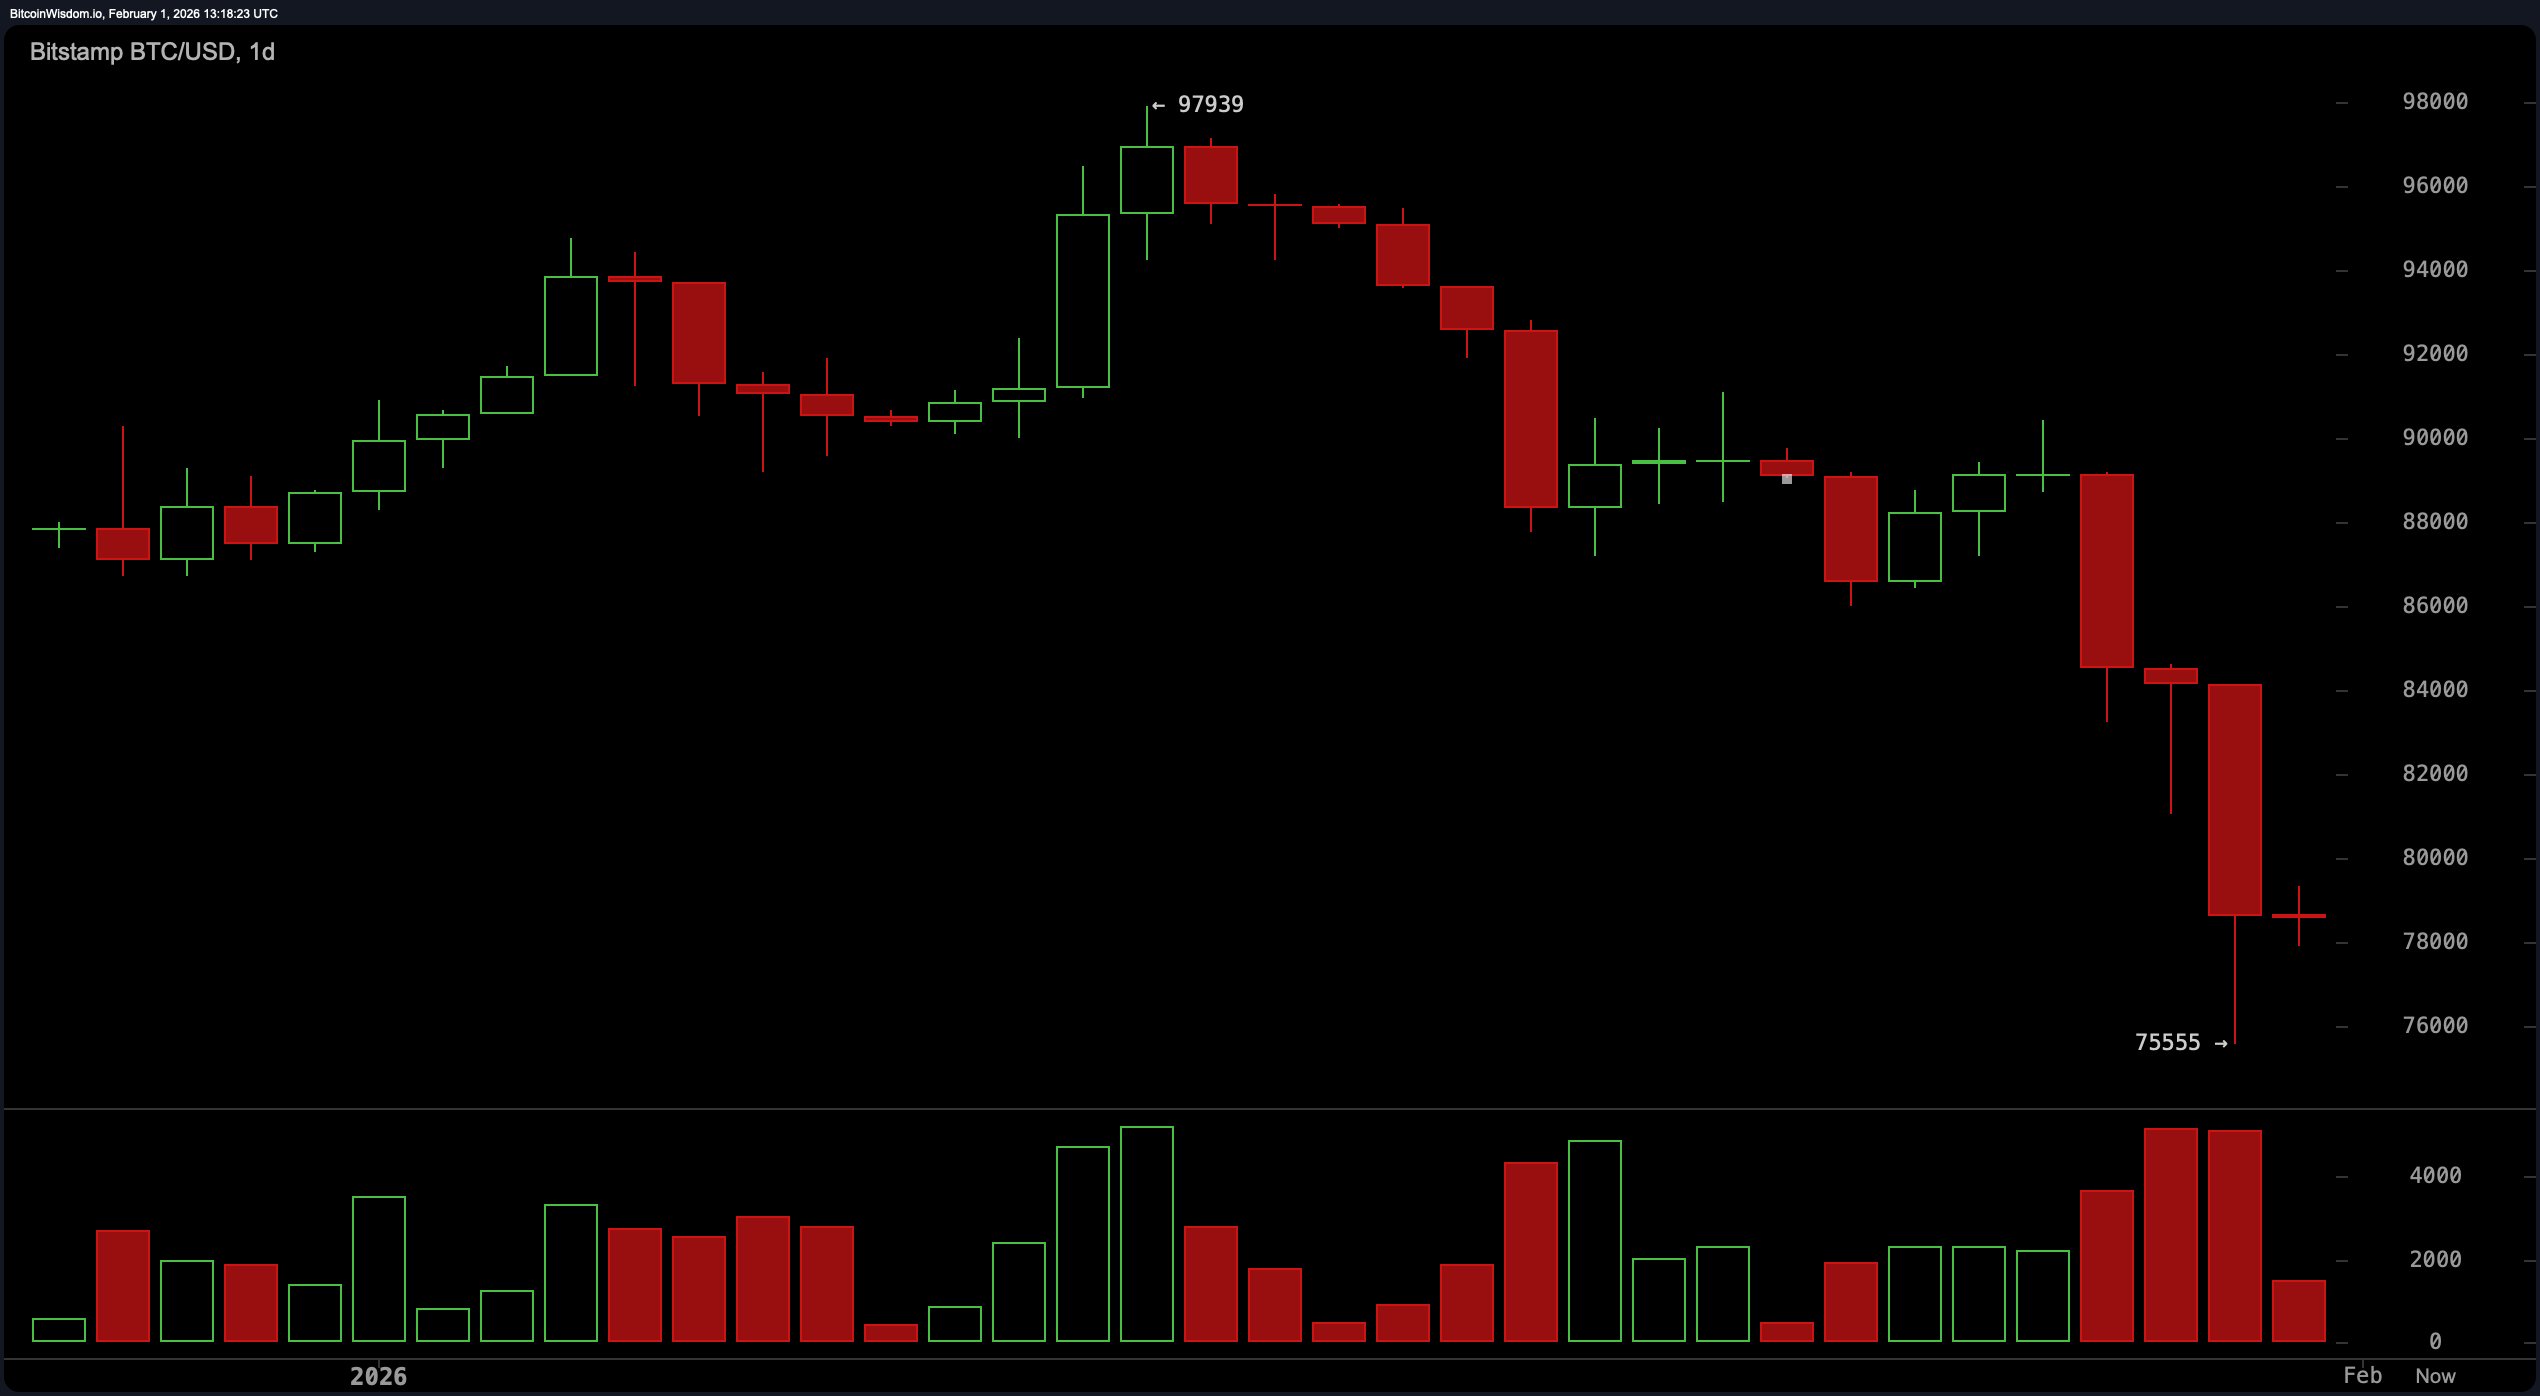
The daily chart tells a tale of bruised egos and broken levels. After collapsing through the $88,000–$90,000 range, bitcoin stages a dramatic nosedive into the $75,500 zone. This isn’t some slow bleed—it’s a classic liquidation-driven flush, confirmed by a spike in trading volume.
The result? A long wick southward and a hesitant stabilization on what looks like the first real demand zone. Traders dreaming of trend reversal better hope for a daily close above $86,000; anything less is just wishful thinking cloaked in hopium.
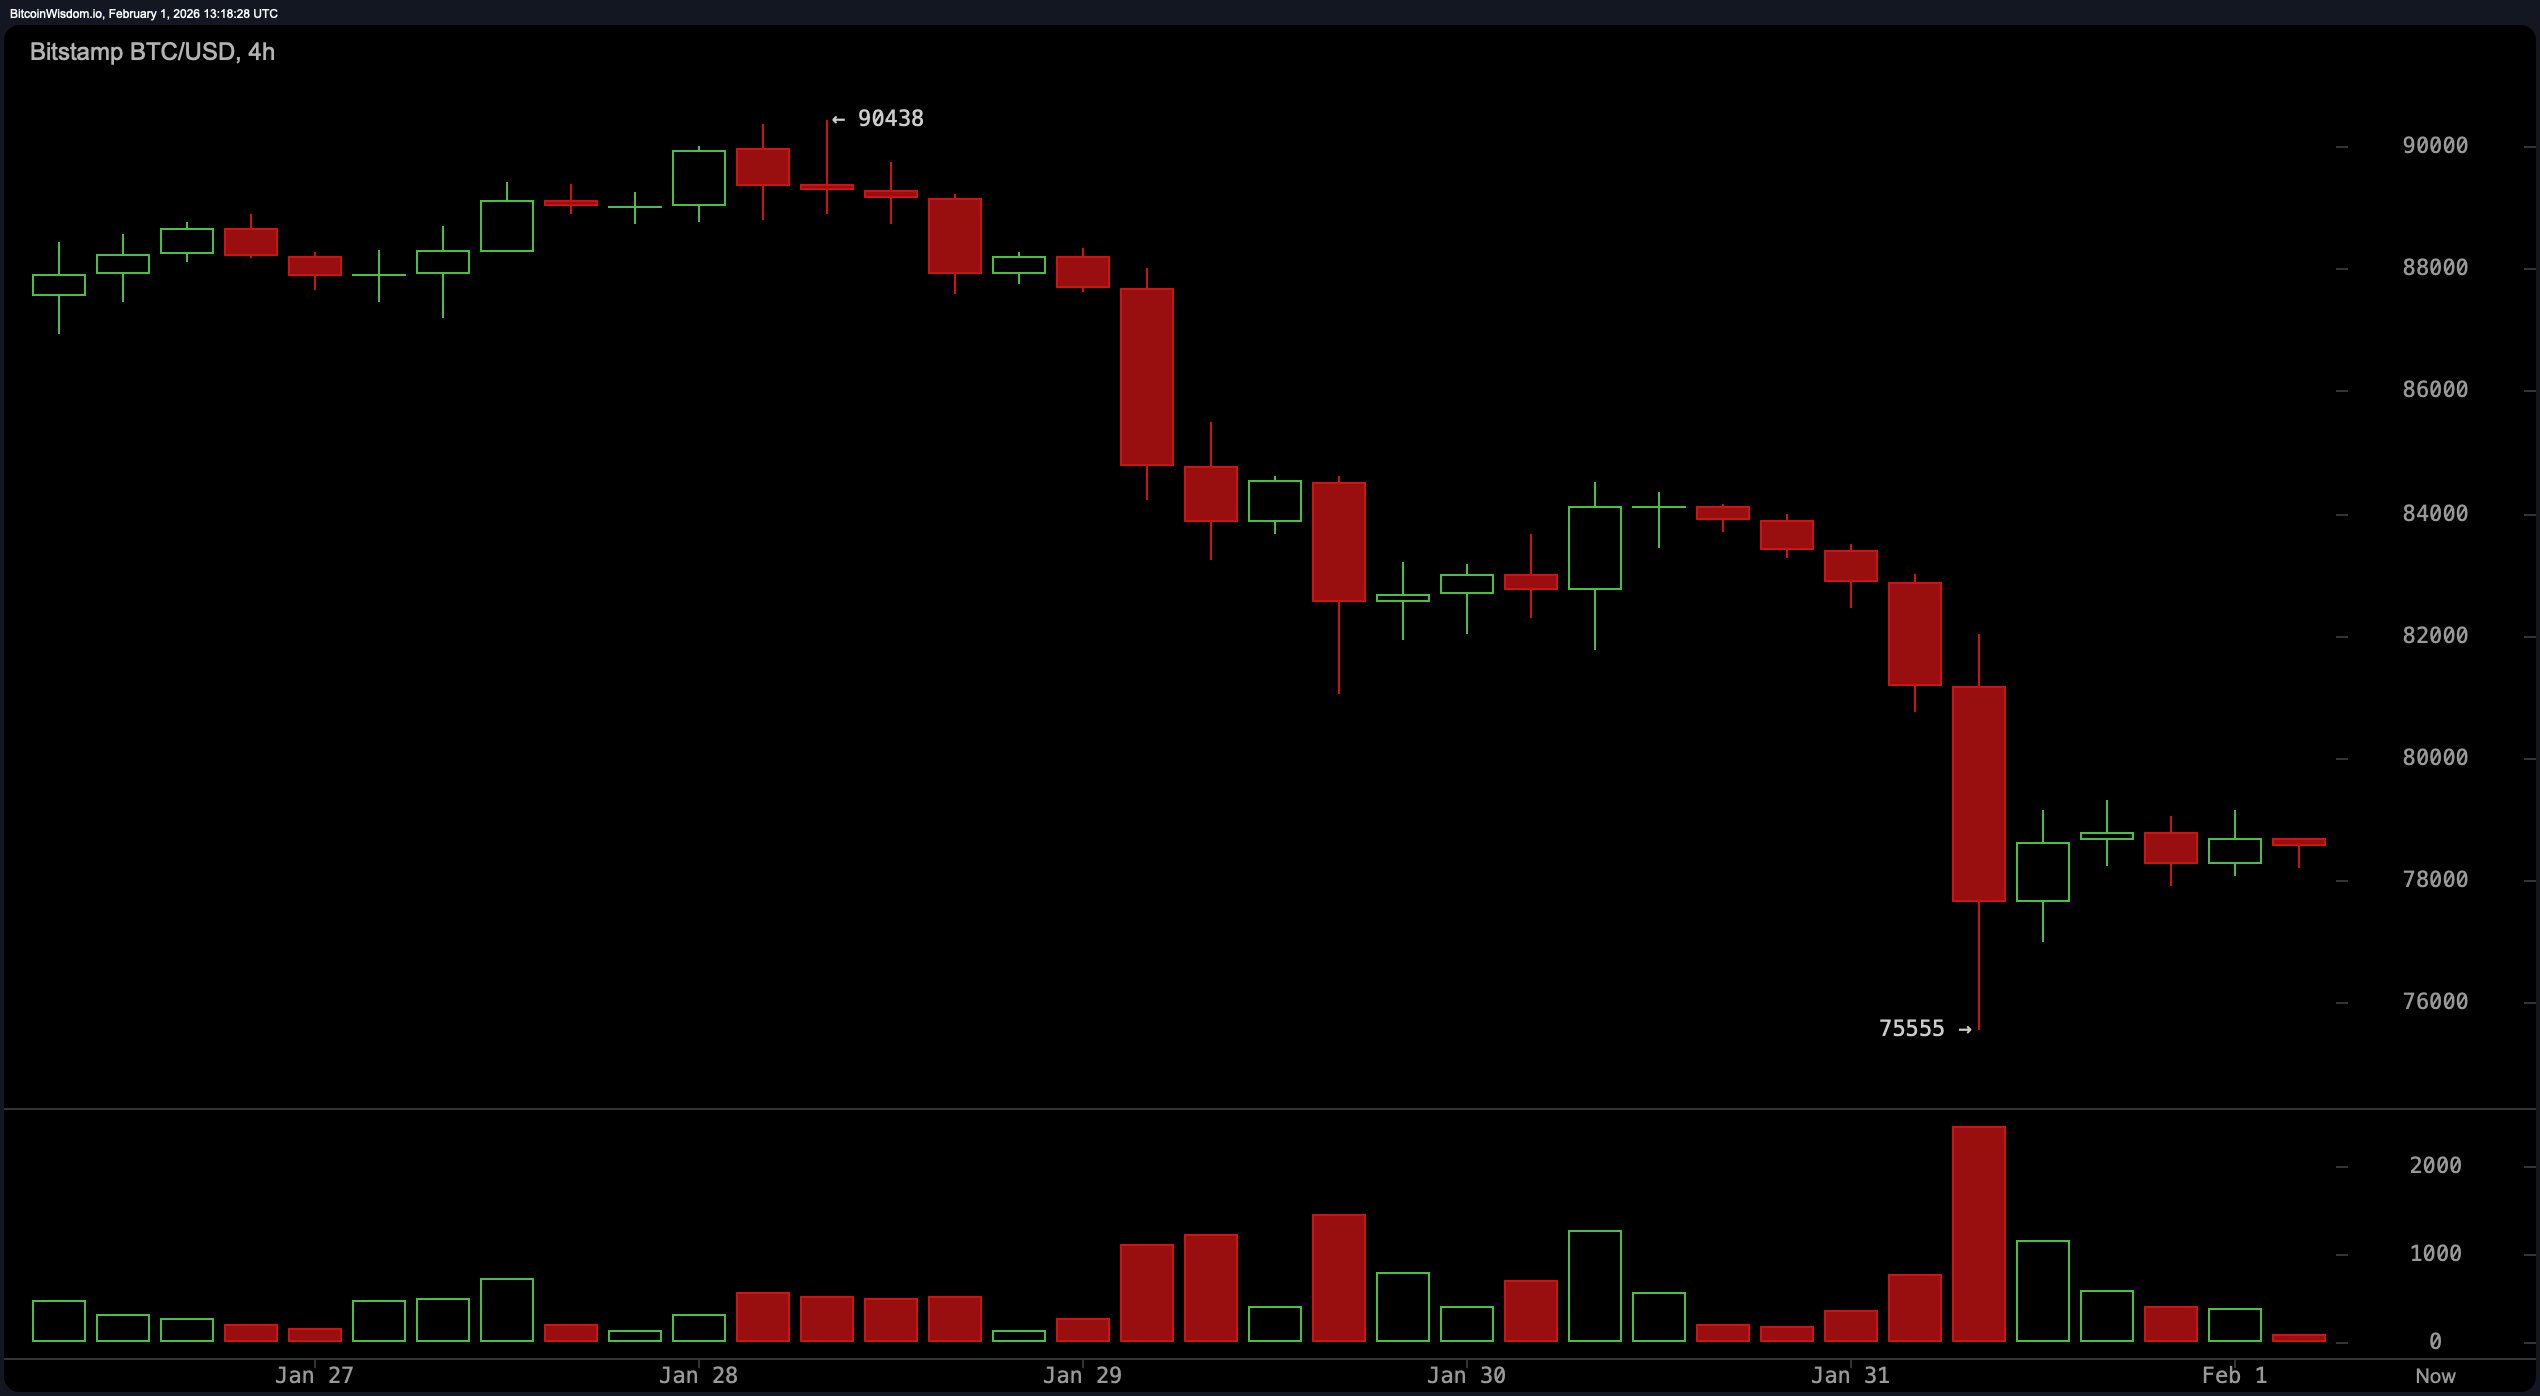
On the 4-hour chart, the aftermath looks like a therapy session: consolidative, indecisive, and full of emotional baggage. The price prints slightly higher lows, but they lack the kind of conviction that gets a rally out of bed in the morning. The volume at the bottom of the range shows sellers are taking a breather—for now. Key battlegrounds remain firmly entrenched at $76,000–$77,000 for those looking for a calculated entry, and $84,000 stands tall as the rejection-ready ex. Unless bitcoin convincingly re-establishes itself above $80,500, every pop looks suspiciously like bait.
Zooming in to the 1-hour chart, we find ourselves trapped in the twilight zone of crypto price action: neither here nor there. With bitcoin ping-ponging between $77,800 and $79,500, momentum flattens like last week’s soda. Buyers step in, sure—but follow-through is about as committed as a summer fling. Breakouts from this range need strong volume confirmation, or they’re just another fakeout waiting to embarrass late entries. Watch $80,500 on the upside and $77,200 on the downside for the next significant moves.

The oscillators aren’t exactly throwing a party either. The relative strength index ( RSI) languishes at 25, while the Stochastic oscillator is even more sluggish at 18. The commodity channel index (CCI) clocks in at −195, hinting at deep oversold conditions, but that’s a setup, not a guarantee. Meanwhile, the average directional index (ADX) at 30 says there’s just enough trend strength to keep things tricky. The momentum indicator, at a woeful −10,874, and the moving average convergence divergence ( MACD) level at −2,509, both suggest there’s still more weight pulling this asset down than lifting it.
As for moving averages (MAs), the situation reads like a graveyard of failed support. Every major exponential moving average (EMA) and simple moving average (SMA) from the 10-period to the 200-period sits high above the current price, waving from the rearview mirror. The 10-period EMA sits at $84,768, and the 200-period SMA tops out at $103,952—yikes. Until bitcoin reclaims some of these zones, the broader trend remains pinned under heavy resistance. Recovery isn’t off the table—but it dines alone for now.
Bull Verdict:
For the glass-half-full crowd, bitcoin is holding the line at a key demand zone. With oscillators flashing oversold and sellers showing signs of fatigue, a bounce is possible—especially if $80,500 is reclaimed with conviction. But until structure flips above $86,000, any upside move is a tactical maneuver, not a full-blown trend reversal.
Bear Verdict:
The trend is your frenemy—and right now, it’s still snarling. Essentially, bitcoin remains below every key moving average, and momentum indicators point south with no signs of exhaustion. Unless price reclaims $86,000 and brings volume to the party, rallies are likely to get faded faster than a meme coin in a bear market.
FAQ ❓
- Where is bitcoin’s key support level now? Bitcoin is holding support between $75,500 and $76,000.
- What resistance levels could cap bitcoin’s rebound?Overhead resistance lies between $84,000 and $86,000.
- Is bitcoin in an uptrend or downtrend? Bitcoin remains in a short-term downtrend across all major timeframes.
- What level changes the bearish outlook?A sustained move above $86,000 with strong volume would shift the bias.