
Bitcoin is preparing to test key resistance levels within the Donchian Channel, signaling potential for further upward movement.
For context, Bitcoin ($BTC) has seen a 0.9% increase in the last 24 hours, currently trading at approximately $88,911. The price fluctuated between a low of $87,315.18 and a high of $89,394.00 during this period. However, over the past 7 days, Bitcoin has seen a 0.7% decline, showing loss of buyer momentum in this timeframe.
$BTC has also faced a slight decline of 6.3% over the past 14 days, and a 0.8% drop in the last month. With a market capitalization of $1.77 trillion, which is up 0.89%, and a circulating supply of 19.98 million tokens, Bitcoin continues to dominate the crypto space.
Its 24-hour trading volume stands at $44.07 billion, also up by 6.56%, indicating surging market activity. This recent price surge brings Bitcoin closer to the $89K mark, with traders keeping an eye on whether it can sustain this growth in the near term. Can Bitcoin break key resistance levels?
Bitcoin Price Prediction
On technical charts, Bitcoin is currently trading within a defined range. Notably, the price recently tested and bounced off the lower boundary of the Donchian Channel, which sits at $85,960, acting as immediate support.
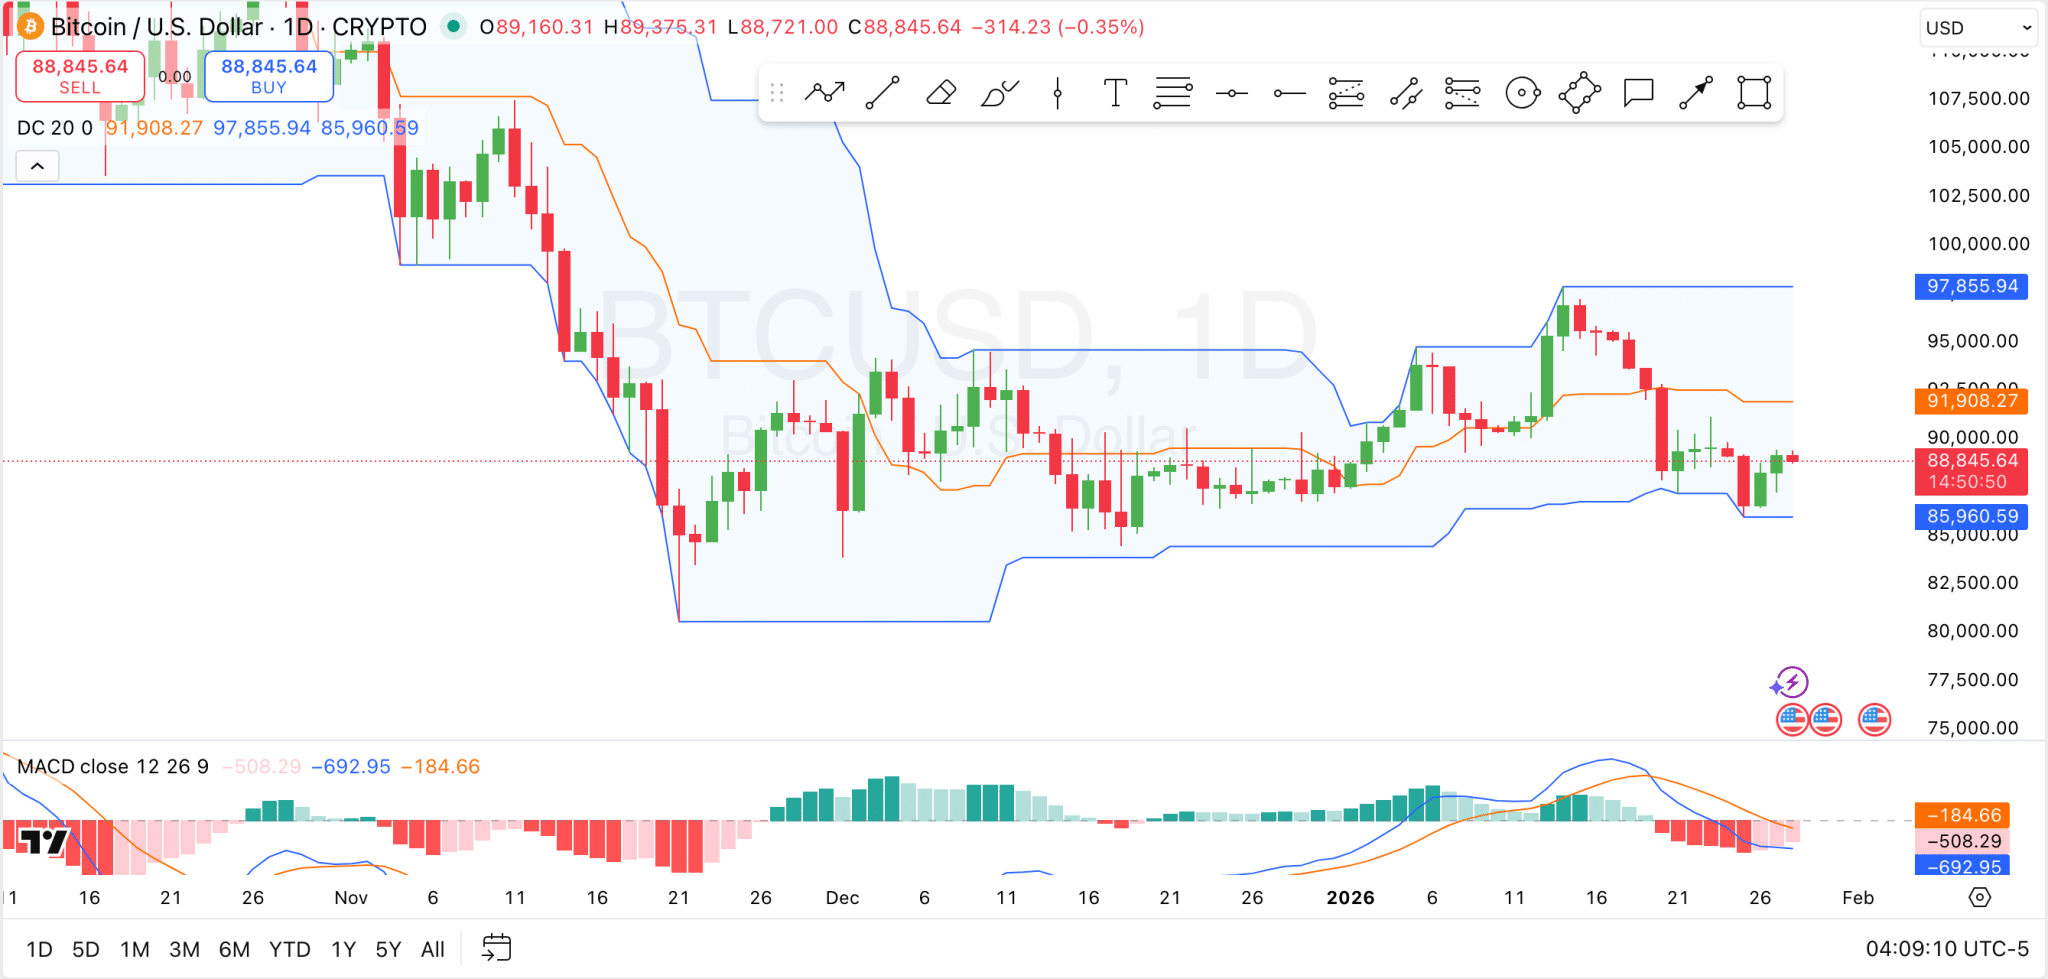
This level is now serving as a crucial floor, and if Bitcoin fails to hold above it, we could see further declines toward the next support zone. On the upside, immediate resistance exists at $91,908, the middle band of the Donchian Channel.
Bitcoin has struggled to break this resistance level in recent attempts, indicating a potential ceiling that traders should monitor closely. If Bitcoin manages to break above the resistance at $91,908, it could lead to a continuation of the upward movement, targeting the upper band at $97,855.
The MACD indicator shows a bearish trend, with the MACD line below the signal line and the histogram showing a negative value of 508.29. The MACD histogram is currently narrowing, indicating that the downward momentum is weakening. However, the negative MACD readings suggest that Bitcoin has not yet flipped into a strong bullish phase. A crossover of the MACD line above the signal line could suggest a potential bullish reversal in the coming days.
Bitcoin Liquidation Data
Meanwhile, the Bitcoin liquidation data shows significant liquidation events across multiple time frames. Over the past hour, a total of $258.73K in liquidations occurred, with the majority of these being long positions ($210.39K), while short positions accounted for $48.34K.
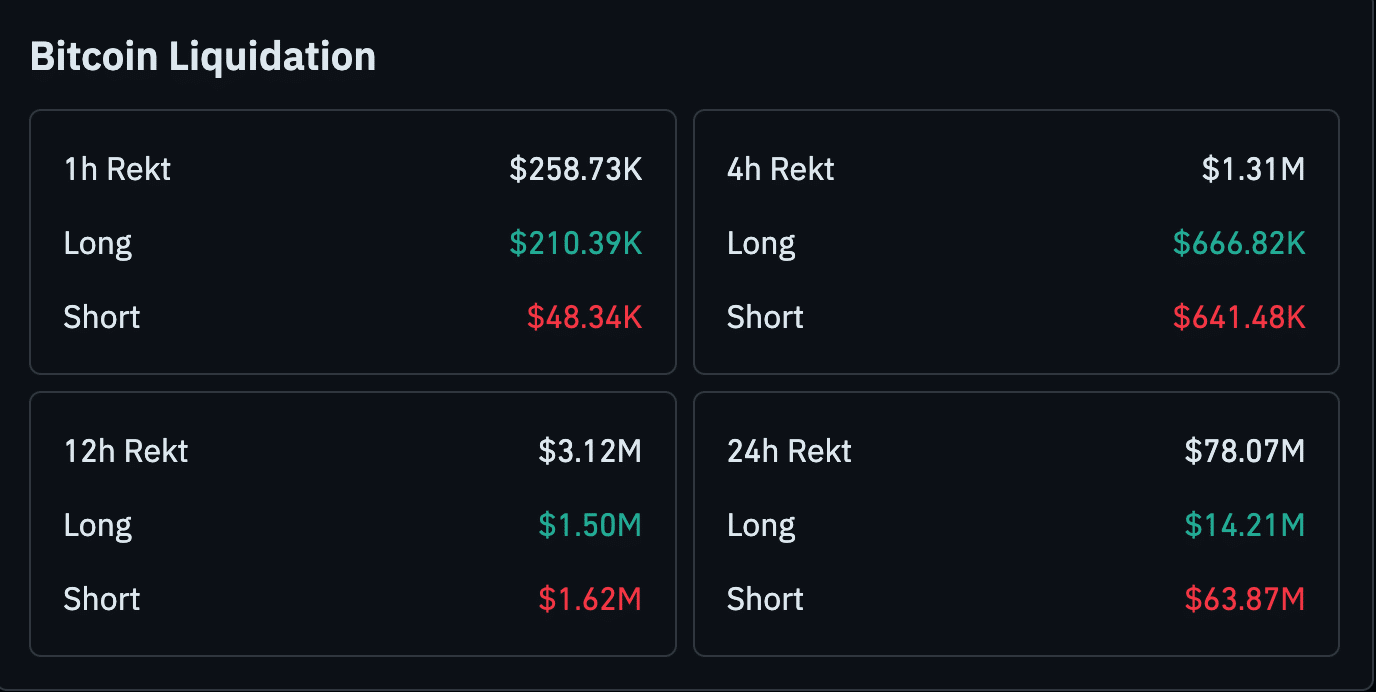
This trend continues with more substantial figures in the 4-hour and 12-hour periods, where liquidations reached $1.31 million and $3.12 million, respectively. Notably, the 24-hour liquidation figures are considerably higher, with a total of $78.07 million in rekt positions. Of this, $63.87 million stemmed from liquidated short positions, while only $14.21 million came from long positions.