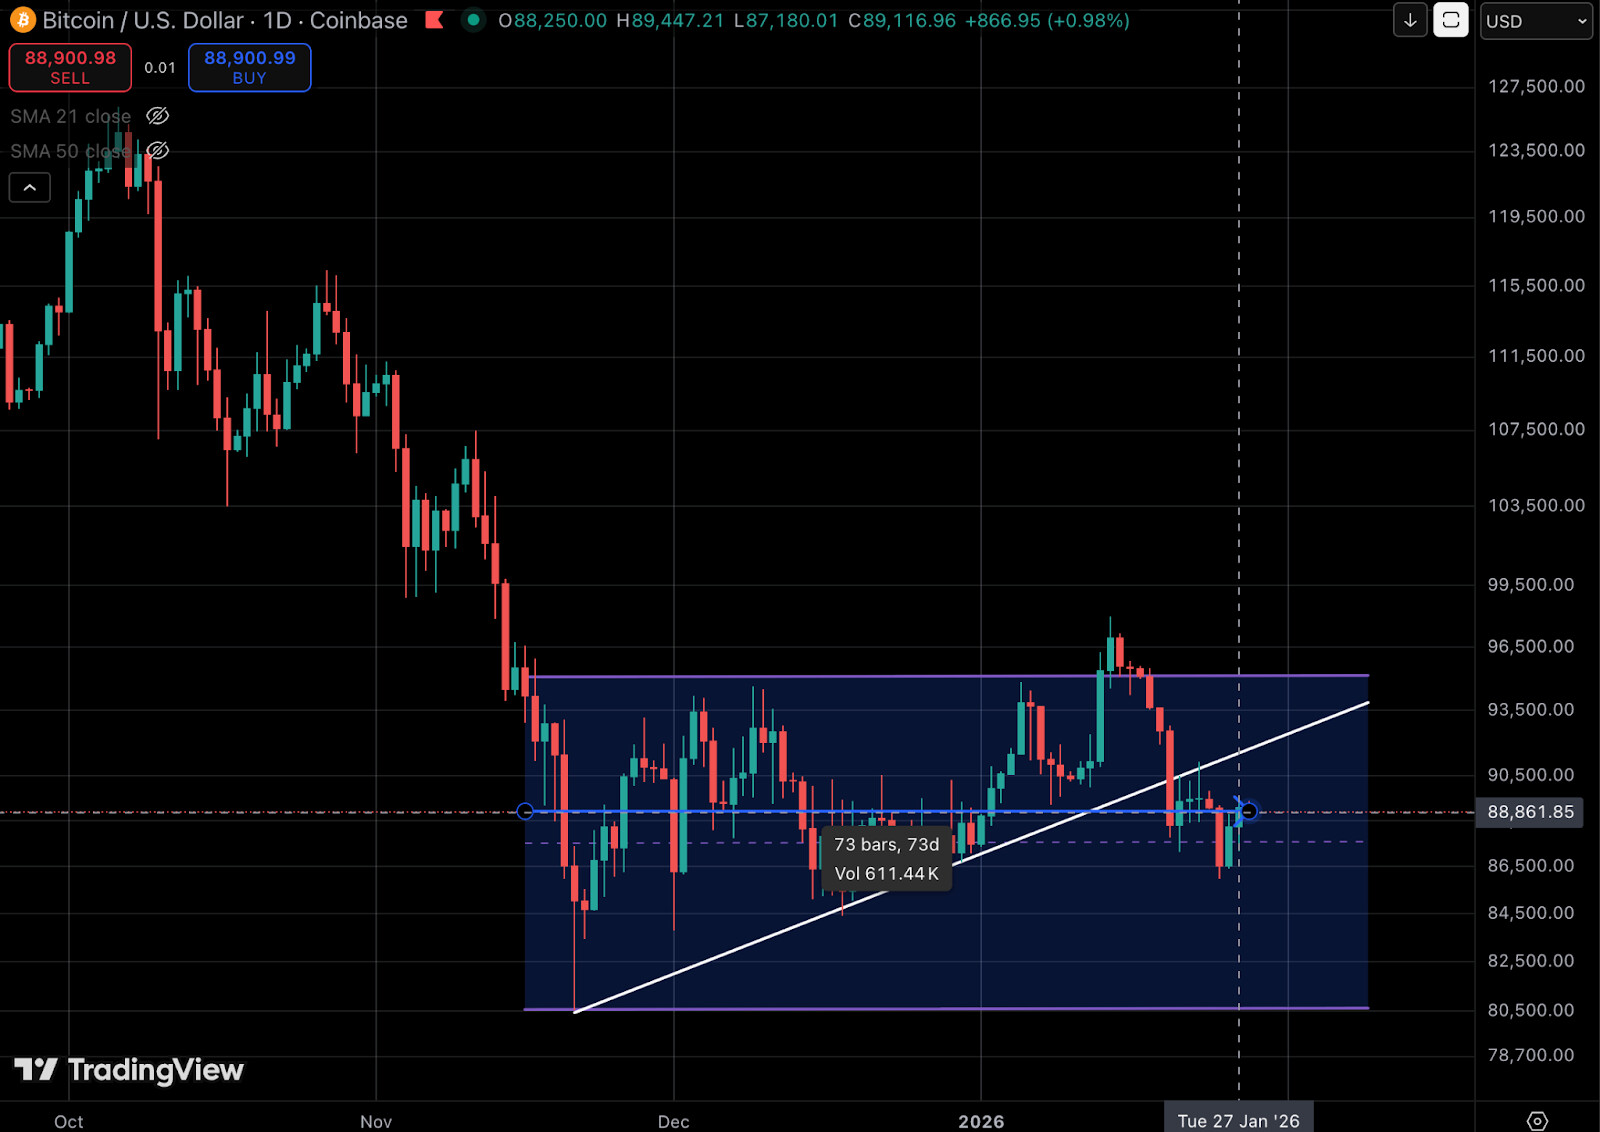
Bitcoin has been compressed within a clear range between $80.5K and $95K for 73 days now. The ranging market has also been characterized by unusually low volatility, especially when you compare to traditionally less volatile assets like gold and silver.
Sentiment has been bleak ever since the liquidation event of October 10th and this tight zone with muted price action has brought a sense of apathy among market participants. That said, volatility indicators are flashing signals that this level of compression is historically rare, often preceding sharp directional moves because markets tend to resolve extended periods of calm with expansion.
Volatility Measures Showing Extremes
Bitcoin is often associated with its immense volatility and it remains so on an absolute basis. However, as time has passed, that degree of volatility has been coming down dramatically as $BTC becomes a more mature, institutionally adopted asset with deeper liquidity. In fact, on a volatility adjusted basis, it’s actually increasingly comparable to certain mega cap tech stocks like Nvidia, Tesla and Meta.
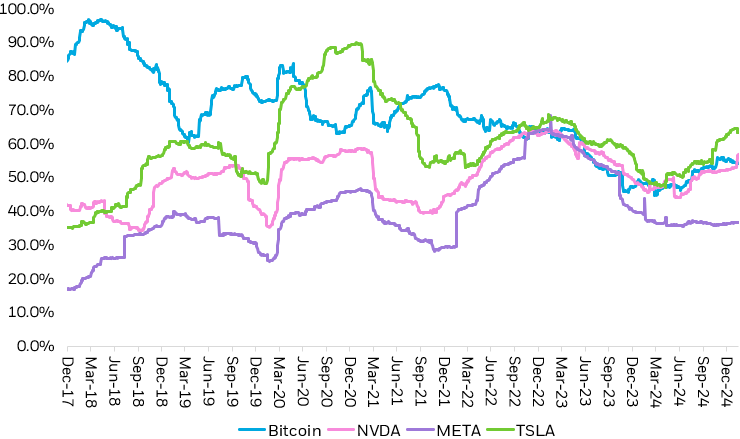
Source: Ishares
As of this writing Bitcoin’s annualized volatility stands at 34.06%, down well from the triple digits it once was not so long ago.
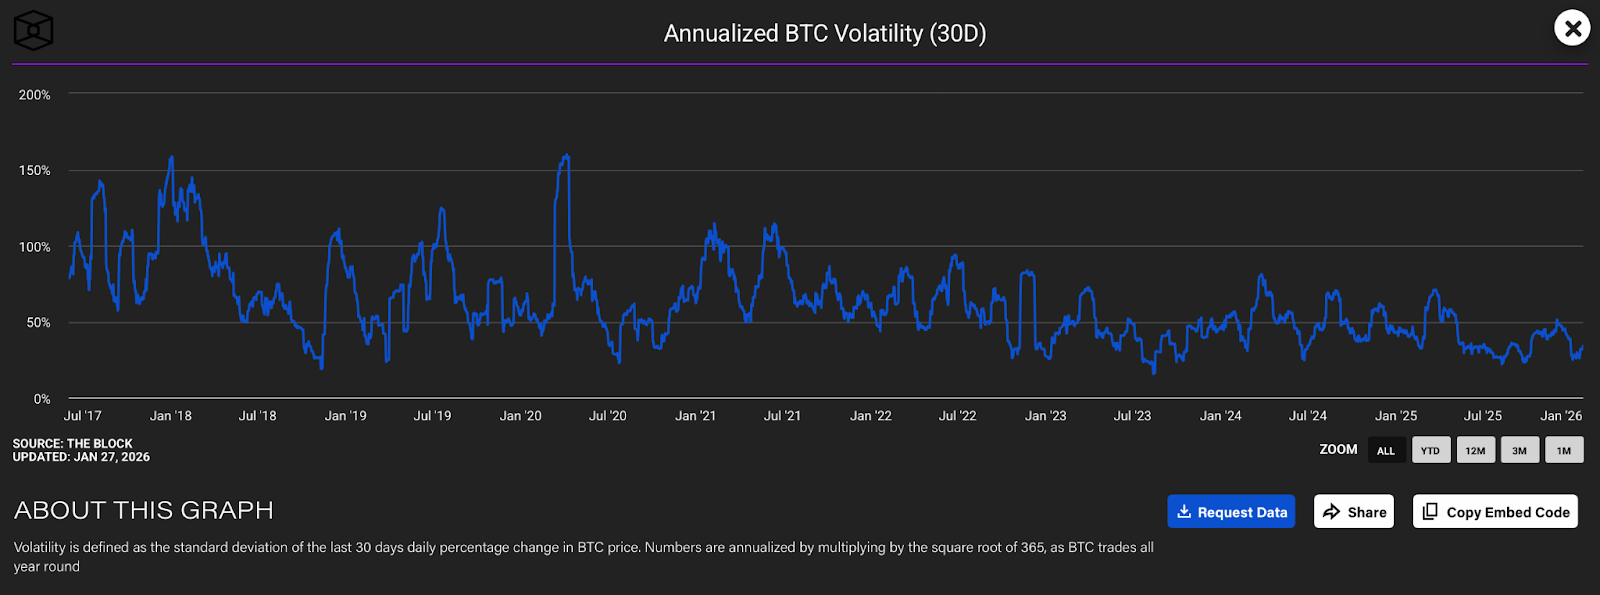
What is striking is that Bitcoin’s historical volatility is tightening further in the short term as price remains constricted in the narrow range. This is reflected in the 30-day realized volatility metric, which measures the standard deviation of $BTC’s daily returns over a rolling 30-day window and annualizes the result.
Since November 16th last year, when $BTC entered the current range, this 30-day realized volatility has declined from 2.06% to 1.66%. Long periods of volatility suppression like this are historically uncommon for Bitcoin, making this especially notable, not because of what has already happened, but for the likelihood of volatility expansion and directional resolution that typically occurs after an extended lull.
Another indicator reinforcing the ongoing compression is Bitcoin’s Sharpe ratio, which measures risk-adjusted returns by comparing excess returns to realized volatility. In simple terms, it tells us whether the volatility investors are taking on is being adequately compensated by returns.
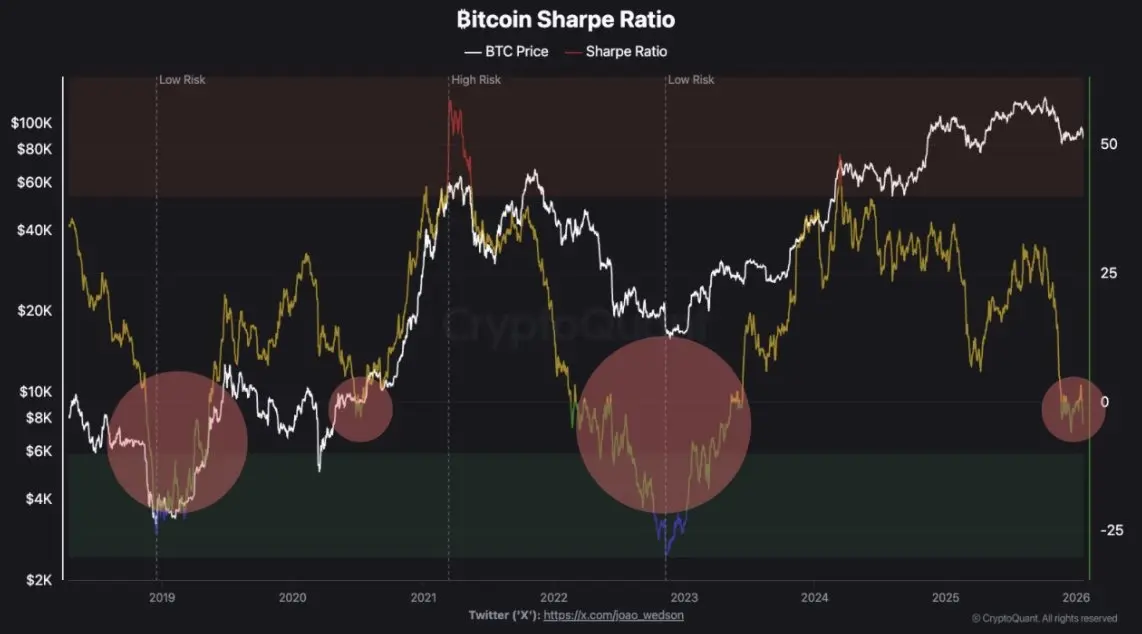
As shown in the chart, Bitcoin’s Sharpe ratio has once again fallen to levels historically associated with major market bottoms. These troughs typically emerge when volatility remains elevated relative to returns, or when returns stagnate while volatility contracts, both characteristics of late-stage consolidations and sentiment exhaustion.
What’s important here is context. Low Sharpe ratio readings do not mark precise bottoms, nor do they preclude further downside. During the 2022 bear market, Bitcoin’s Sharpe ratio remained deeply depressed for extended periods even as price continued to grind lower. However, these regimes have consistently coincided with risk-reward resets, where downside momentum weakens and the market transitions away from impulsive trend behavior.
Taken together with historically low realized volatility and prolonged range-bound price action, the depressed Sharpe ratio adds another layer of evidence that Bitcoin is operating in a compressed, low-conviction environment. These conditions tend to draw attention not because they guarantee an immediate reversal, but because they reflect a market where volatility has been suppressed for long enough that the probability of regime change begins to rise.
Liquidity and Positioning Building Quietly
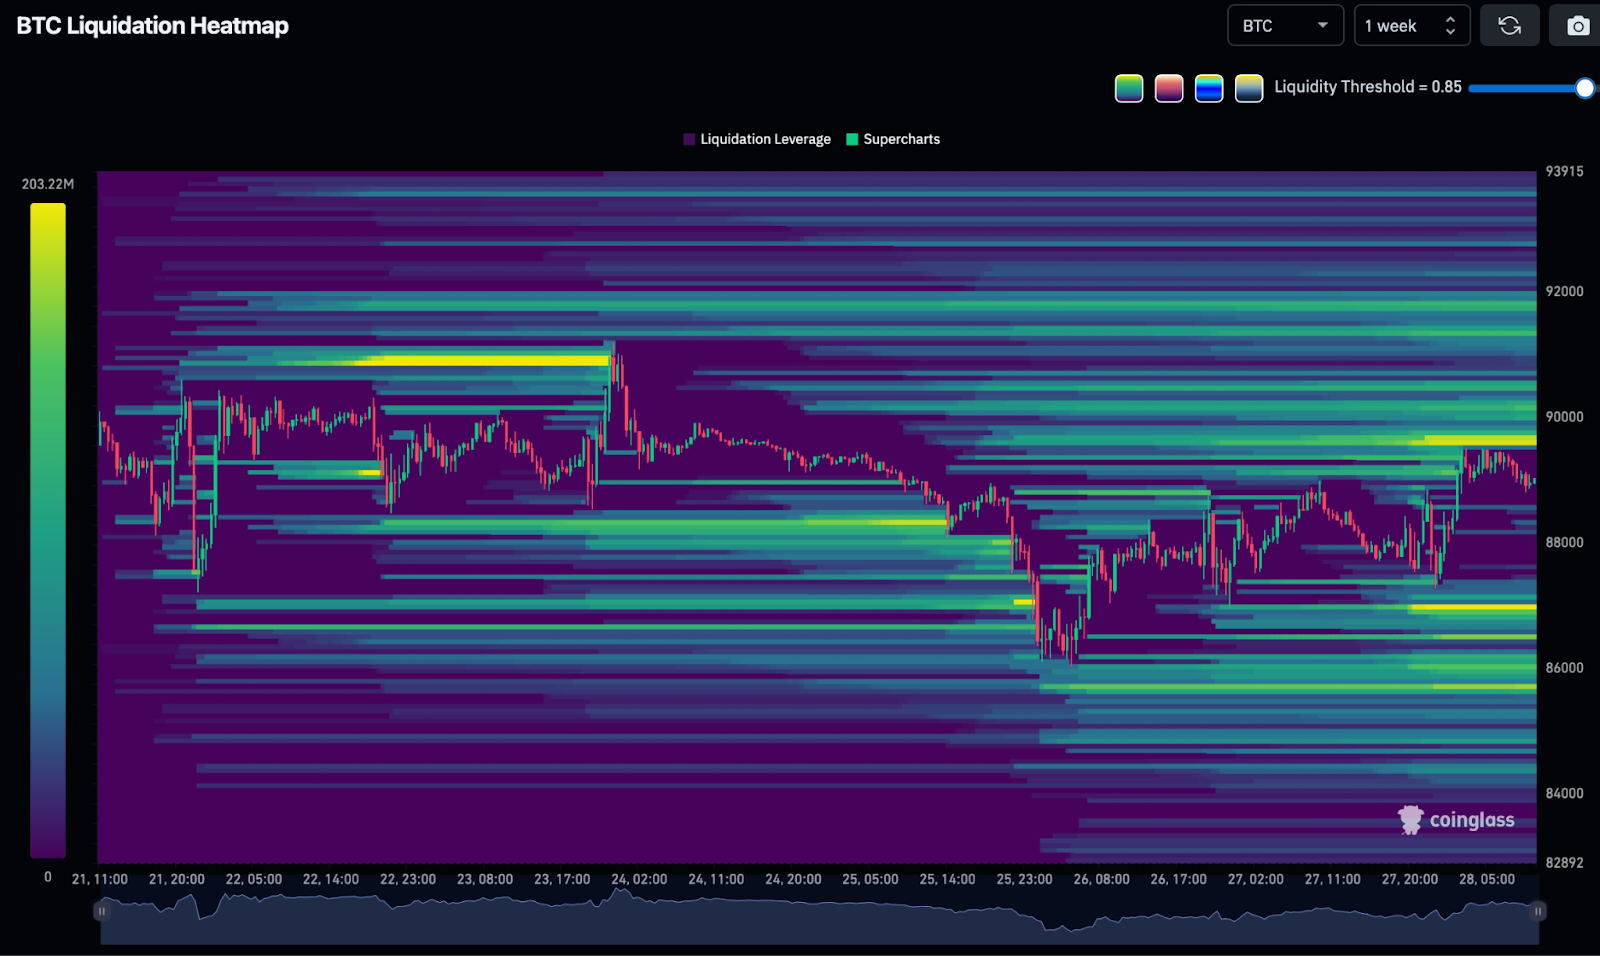
Prolonged tight ranges tend to allow liquidity and positioning to build quietly beneath the surface, and this is clearly reflected in the 1-week $BTC liquidation heatmap. On the upside, a dense concentration of liquidation liquidity is visible between $91,500 and $93,000, suggesting a buildup of short positioning that has yet to be tested.
On the downside, liquidity clusters are notably thicker between $88,000 and $86,000, with additional depth extending toward the mid-$85,000s, pointing to leveraged long exposure accumulating below the range.
As price continues to oscillate without resolution, these zones become more concentrated, increasing the likelihood that a decisive move will trigger cascading liquidations once either boundary is breached. In this context, the tight range is allowing leverage and liquidity to stack asymmetrically, setting the stage for amplified follow-through when price ultimately escapes the consolidation.
Signals Traders Are Watching for Confirmation
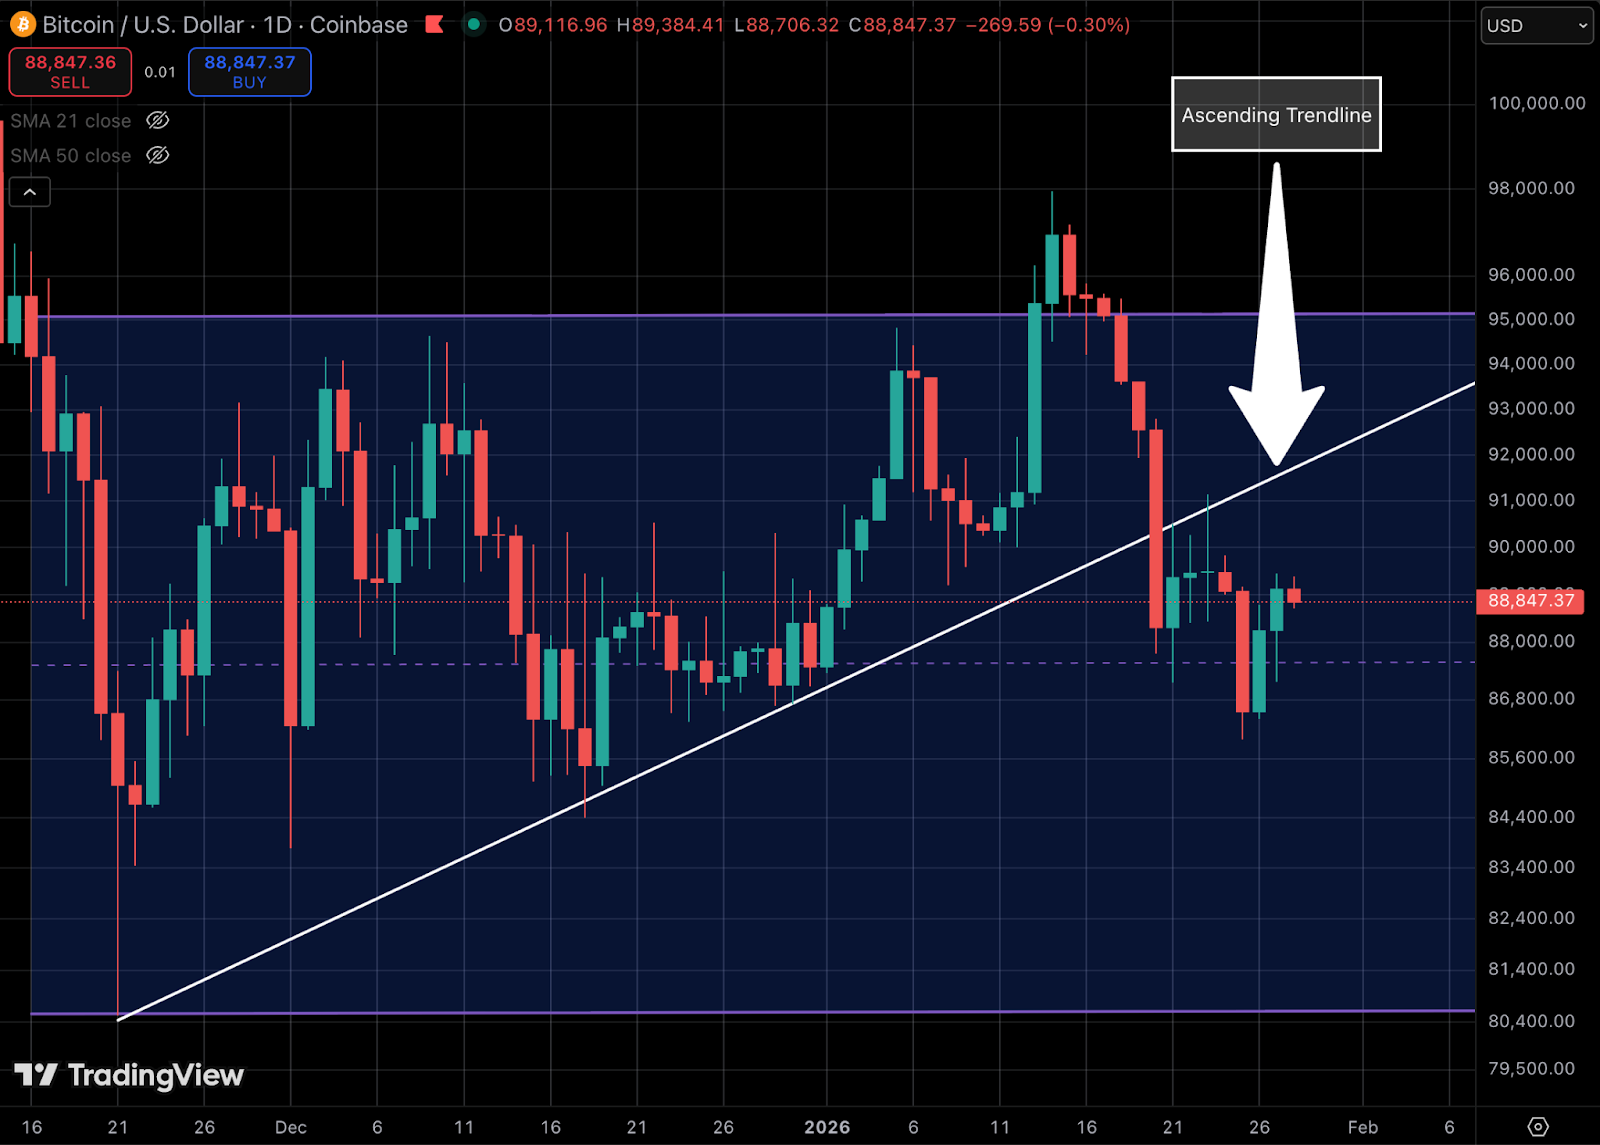
The first area to suggest a positive trend reversal for $BTC would be reclaiming the ascending trendline within the parallel channel. This higher low formation was in play from 21st November all the way until a break of structure on 20th January. A reclaim and retest of this zone with high volumes would suggest a trend shift but a continued rejection at this level would imply that sellers remain in control.