
With a price tag of $87,867, bitcoin isn’t exactly shy about taking up space on the market cap leaderboard—still clocking in at a dominant $1.75 trillion. Meanwhile, its 24-hour trading volume surged to $40.97 billion, all while swinging in a tight intraday range between $87,180 and $88,763. But don’t let the narrow price band fool you—beneath the surface, indicators are throwing sass and shade in equal measure.
Bitcoin Chart Outlook
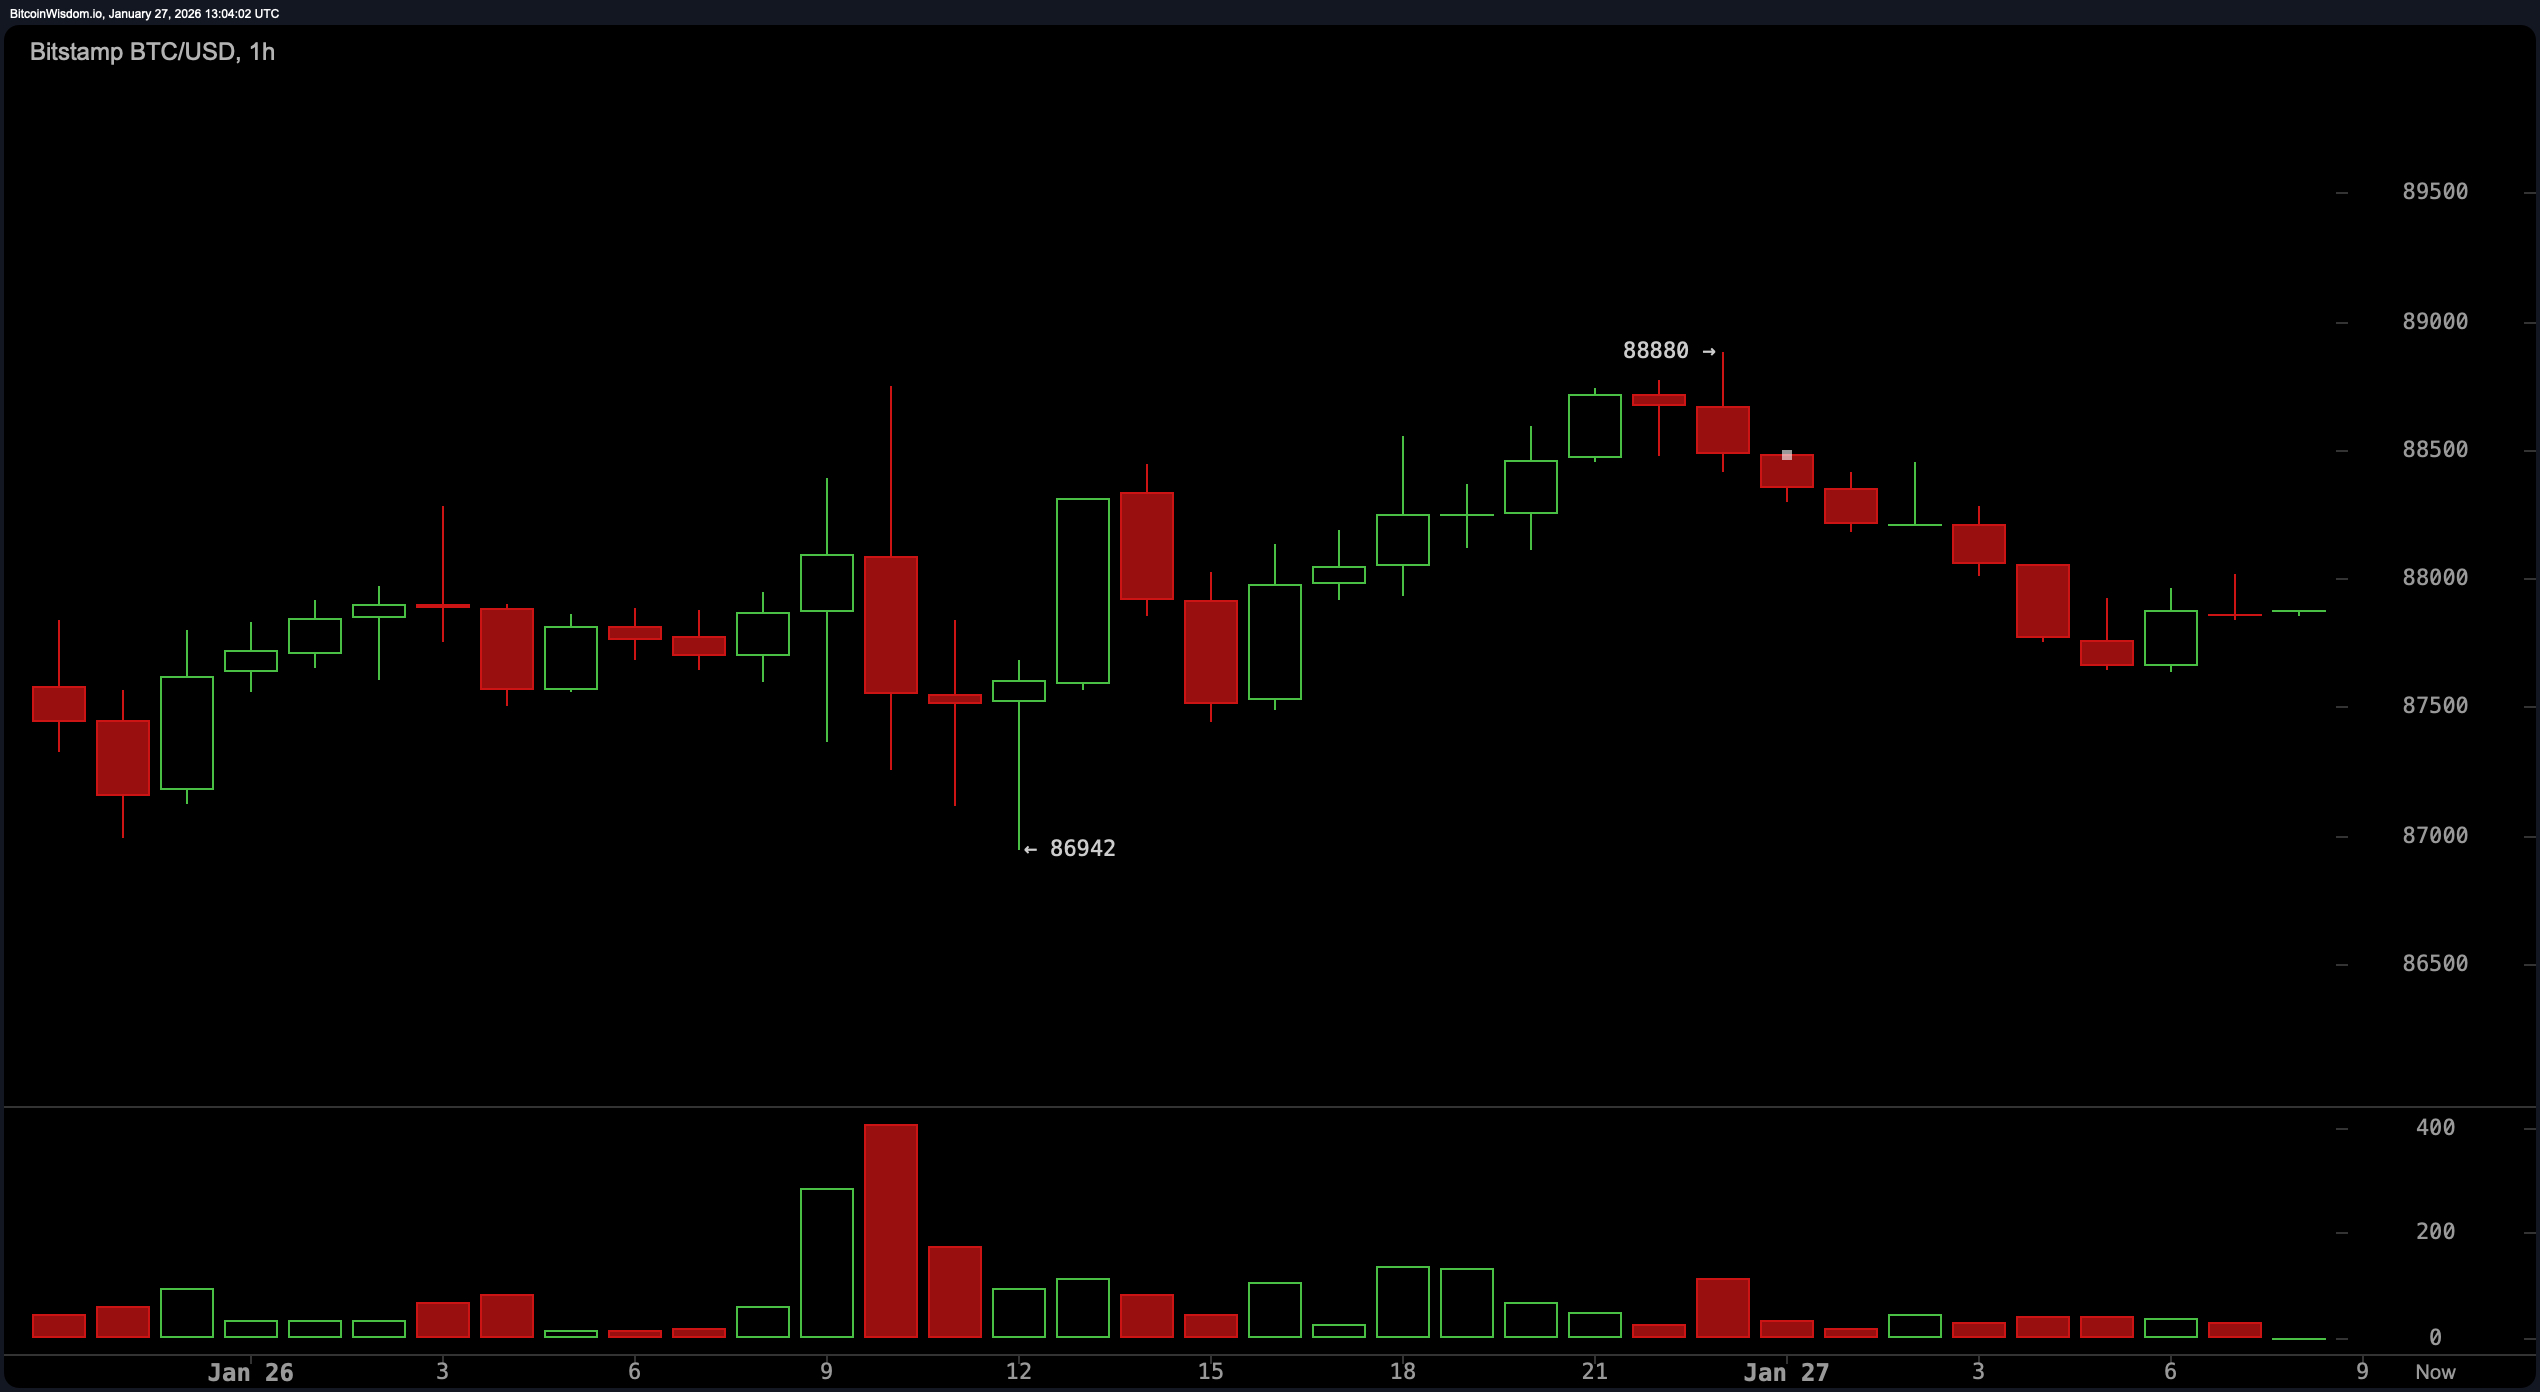
Bitcoin‘s hourly chart signals are tapping the brakes after a brisk bounce from a local bottom at $86,942 to a modest high of $88,880. The momentum has since waned, with small-bodied candles and lower volume pointing to indecision.
The technical cliff notes? It’s a delicate dance near $88,800—any bullish break above that level might send prices flirting with $89,500, while a stumble below $87,800 threatens a retreat back to the $86,000 neighborhood. The micro-trend has slid into a shallow downtrend, hinting at exhaustion among short-term bulls.
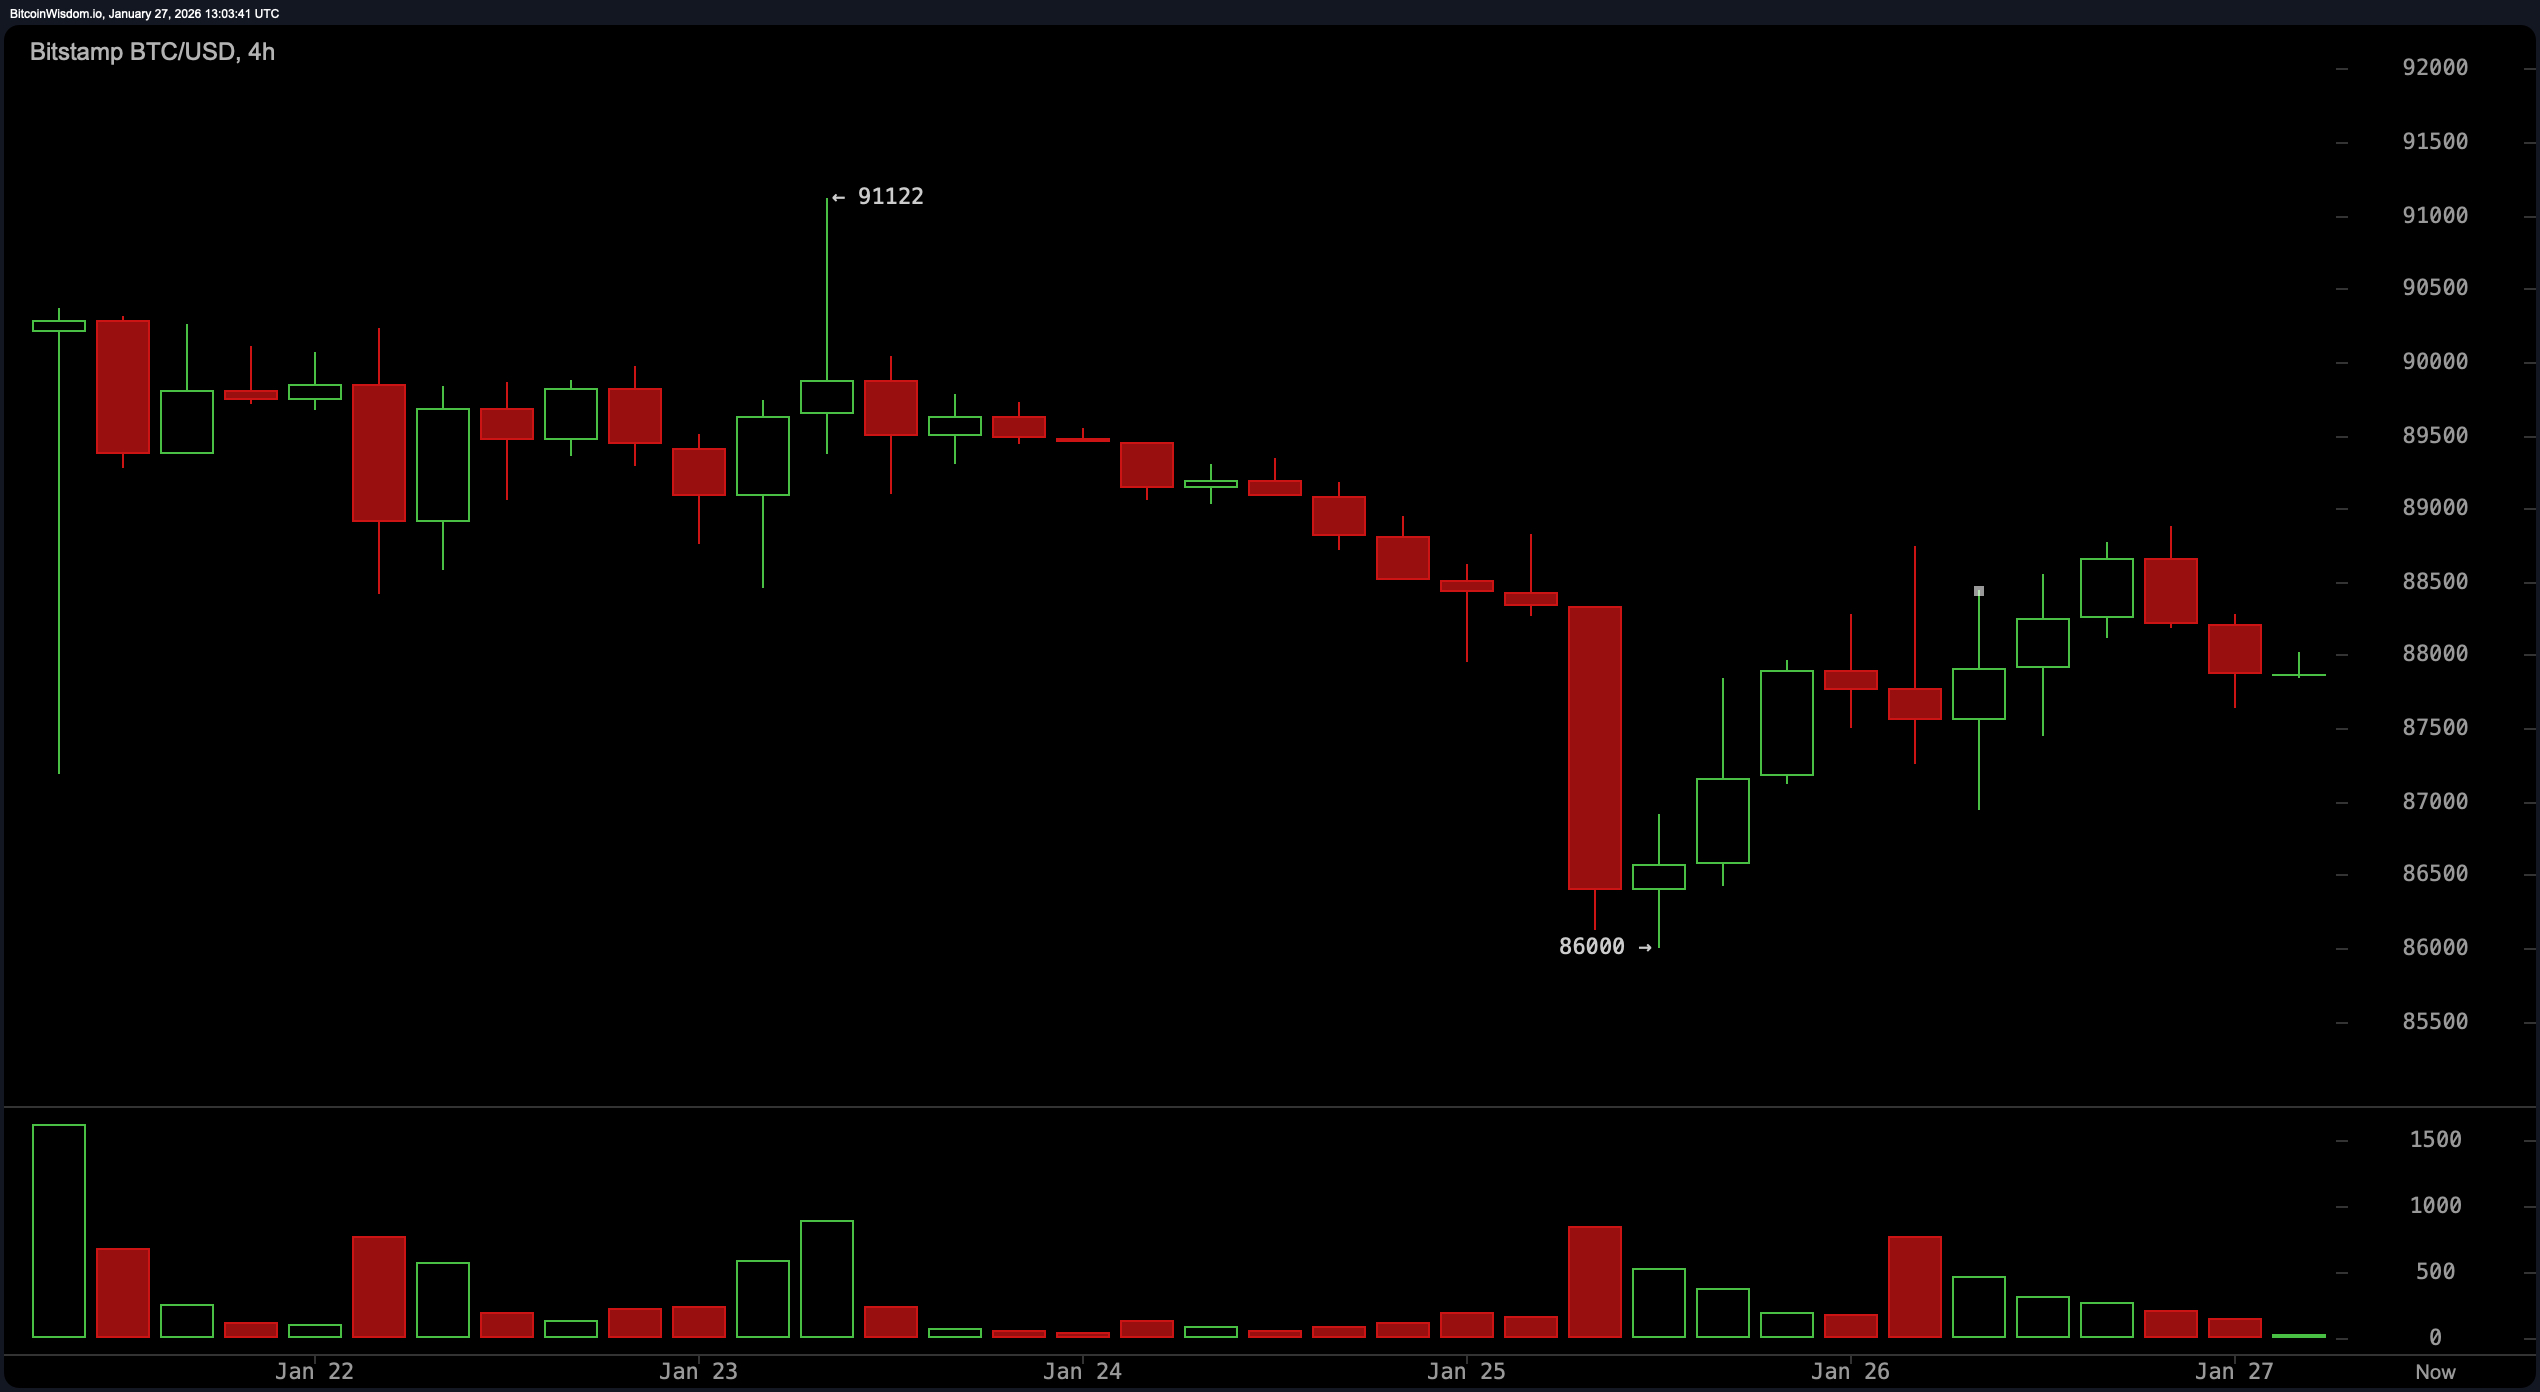
Over on the 4-hour chart, the mood is sideways-to-optimistic, though the optimism feels a bit like a forced smile. A fierce selloff down to $86,000 was quickly met with a rebound, yet lower highs are still the reigning fashion—suggesting the uptrend may be more wishful thinking than reality. The price now loiters between $87,500 and $88,800, tightening like a spring. Should bitcoin breach $89,000 with conviction (and volume to match), there’s room to revisit the $91,000 region. Conversely, any clean break under $87,500 and we’re heading back toward $86,000 territory—perhaps with a dramatic flair.
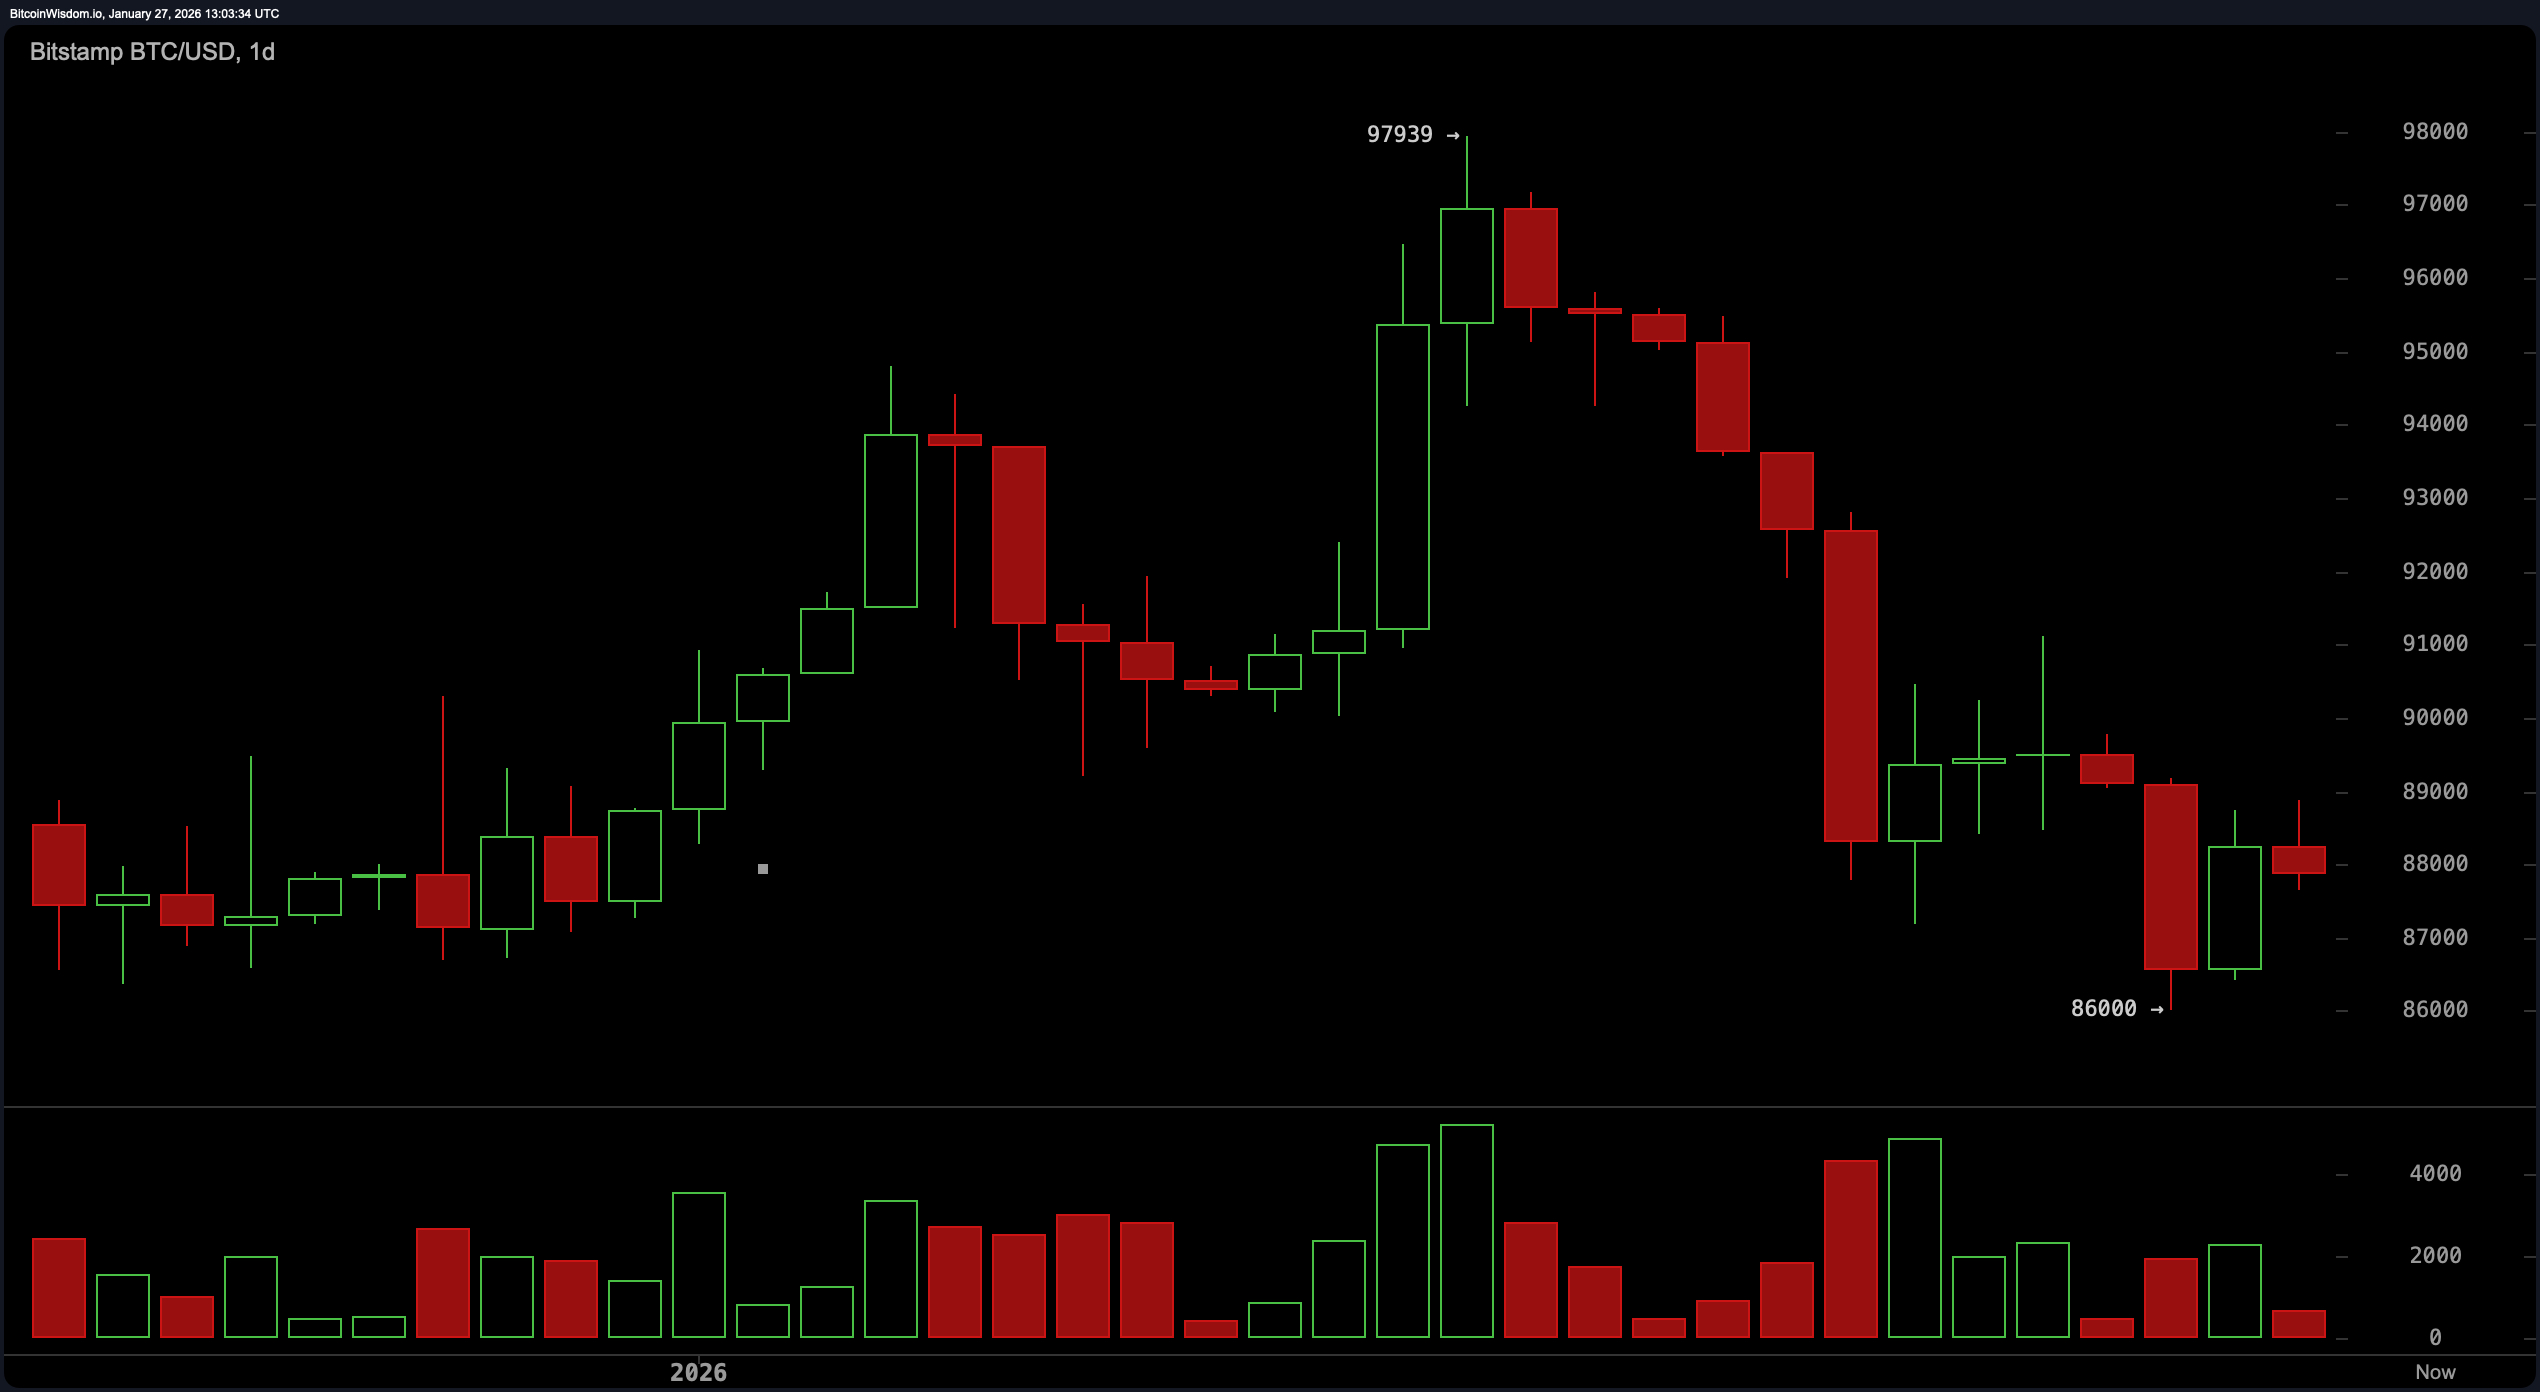
The daily chart paints a broader picture of discontent. After tagging a local high near $97,939, bitcoin faced a cascade of red, heavy- volume candles, signaling distribution and potential capitulation. The price now huddles around the $87,000–$89,000 zone, struggling to reclaim any meaningful ground. The structure is shaping into a textbook bearish pattern—lower highs, lower lows, and enough downward pressure to make a chartist wince. Short of a convincing rally above $90,000, any enthusiasm should be tempered with a hefty dose of realism.
Now for the real diva: the indicators. Oscillators are in full neutral mode, except for momentum, which is throwing a lone signal toward upward pressure—though likely just a tease. The relative strength index ( RSI) is lounging at 41, still shy of any real conviction. The Stochastic oscillator is near a nap at 13, and the commodity channel index (CCI) drags in at –90. Meanwhile, the moving average convergence divergence ( MACD) level sits at –762, spelling bearish sentiment more boldly than a Wall Street headline.
Moving averages? A sea of red flags. All major exponential moving averages (EMAs) and simple moving averages (SMAs) from the 10-period to the 200-period are showing bearish tendencies. The 10-period EMA at $89,379 and the 10-period SMA at $89,462 are both positioned well above the current price, confirming downward momentum. The longer-term 200-period simple moving average casts a shadow all the way from $104,835. Translation: until bitcoin musters the strength to claw back above these averages, it’s stuck playing defense in its own half of the field.
Bull Verdict:
Should bitcoin break above $89,000 with rising volume and confirm strength above the $90,000 mark, a push toward $91,000 and beyond remains plausible. Momentum is subtly shifting, and if buyers step up, this could mark the beginning of a short-term recovery leg within the broader downtrend.
Bear Verdict:
With all key moving averages towering above the current price and bearish structures dominating across timeframes, bitcoin remains under significant downward pressure. A breakdown below $87,500, especially on volume, risks dragging price action back to the $86,000 zone or lower, extending the bearish trajectory.
FAQ 🐂🐻
- Where is bitcoin trading now? Bitcoin is currently priced at $87,867, hovering in a narrow range between $87,180 and $88,763.
- Is bitcoin showing bullish or bearish signals today?Technical charts show a bearish bias with fading momentum and resistance across key moving averages.
- What levels should traders watch near-term?Watch $89,000 for a potential breakout and $87,500 for signs of further downside.
- How is bitcoin’s volume trending today?The 24-hour volume sits at $40.97 billion, with lower timeframes showing decreasing participation.