
Neither buyers nor sellers are dominating on the market today, according to CoinStats.
$BTC/USD
The rate of Bitcoin ($BTC) is almost unchanged since yesterday's bar's closure.
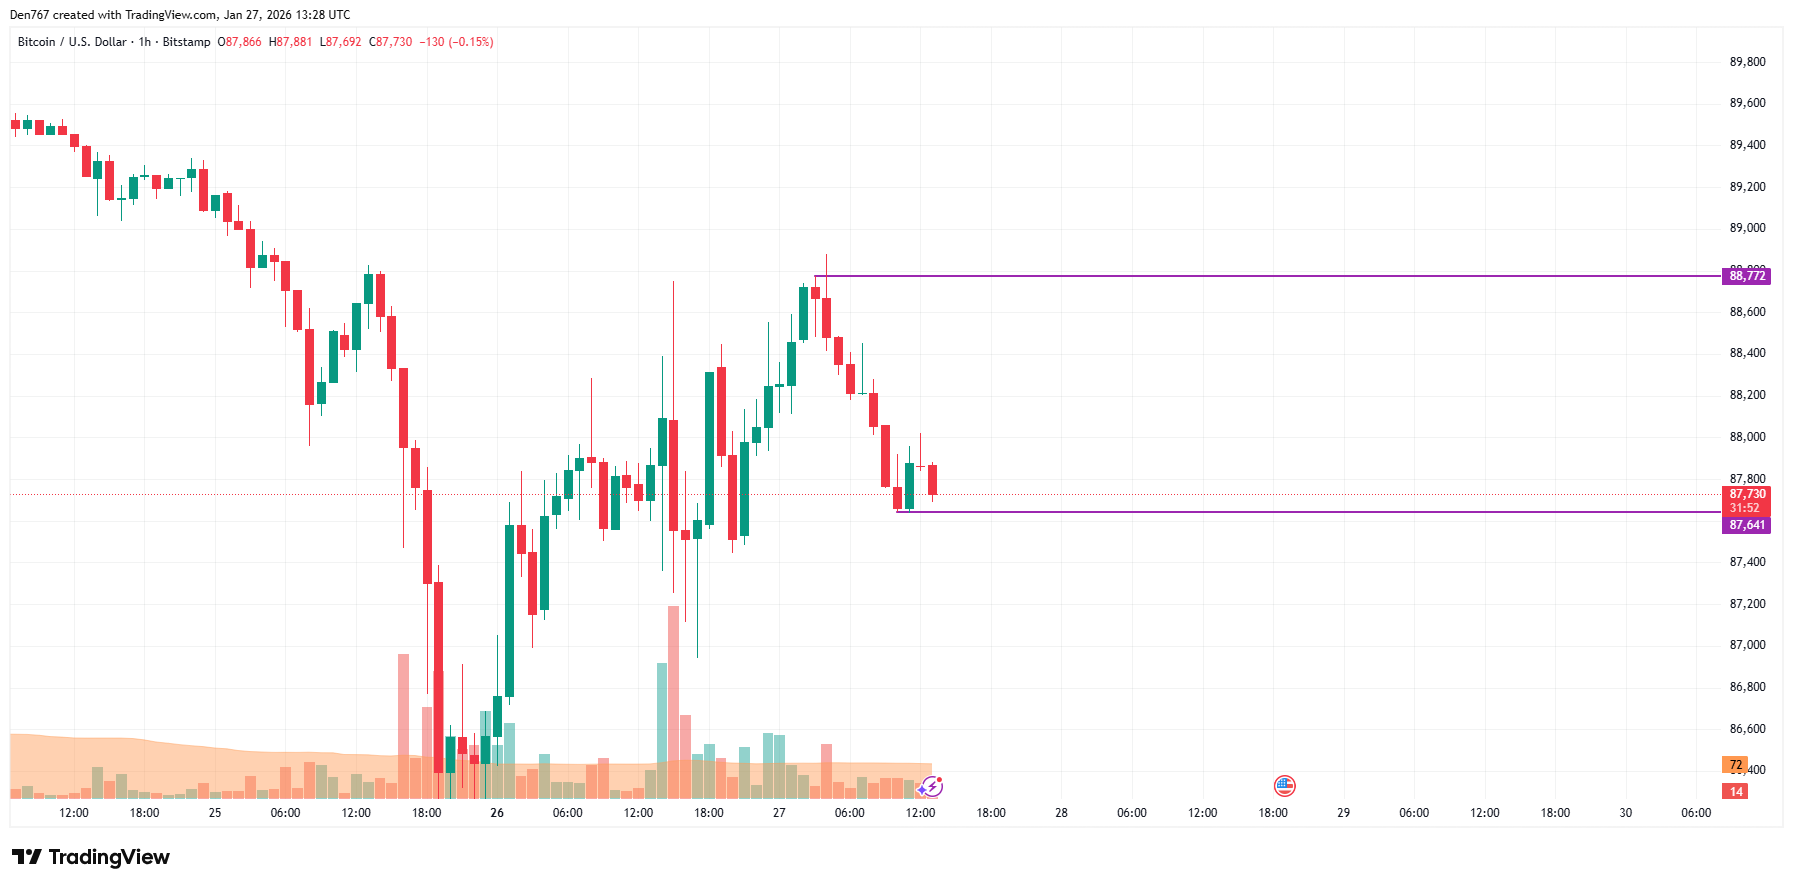
On the hourly chart, the price of $BTC is going down after a false breakout of the local resistance at $88,772. If a breakout of the local support occurs, one can expect a test of the $87,000 zone soon.

On the longer time frame, the rate of the main crypto is within yesterday's bar, which means there are low chances of seeing sharp moves.
However, if the decline continues to the support, traders may witness a more profound drop to the $82,000-$84,000 range.
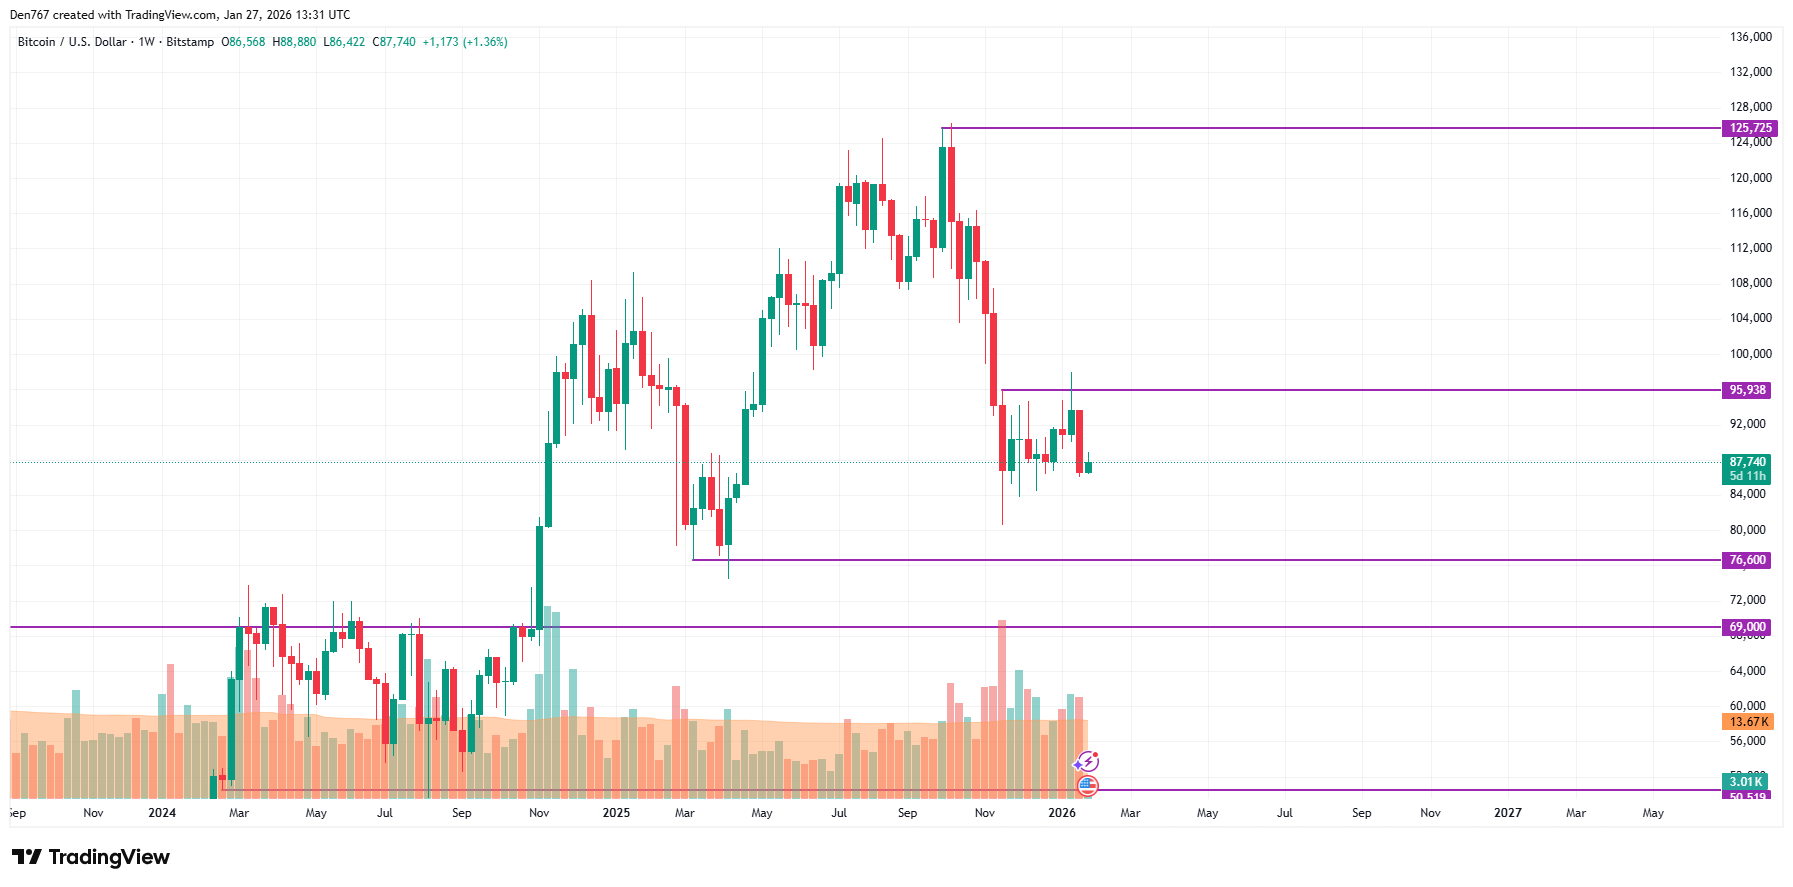
From the midterm point of view, one should wait until the weekly bar closes. If it happens below $86,000, the accumulated energy might be enough for a test of the $80,000 zone.
Bitcoin is trading at $87,760 at press time.