
Bitcoin saw choppy trade after a sharp dip and rebound, with bulls defending a key support zone while indicators stayed bearish.
Bitcoin traded modestly lower over the past 24 hours, slipping about 1.0% to around $87,814 after a sharp mid-session selloff and a subsequent rebound. Price action shows BTC holding relatively steady near the high-$88,000s earlier in the session before breaking down aggressively toward the $86,000 area.
Notably, the chart flags $86,000–$86,125 as the key support band. A clean breakdown below that zone would shift focus to lower supports, while buyers will likely need to reclaim the $88,500–$88,800 region to signal a stronger recovery back into the prior range.
The performance table adds broader context: BTC is down about 5.2% over 7 days and 4.6% in the past 14 days. The 30-day period remains slightly positive, suggesting the latest drop fits within a short-term pullback rather than a clean trend reversal. Can price defend the $86,000 floor on the next retest?
Bitcoin Price Prediction
Bitcoin’s daily chart shows the crypto has recently broken below the 0.786 Fibonacci retracement near 87,311. The price is now trying to stabilize and find support at this level. This 0.786 zone is acting as the first key support, and it aligns with the idea that buyers are attempting to defend the late-stage retracement level from the prior upswing (roughly $84,441 to $97,856).
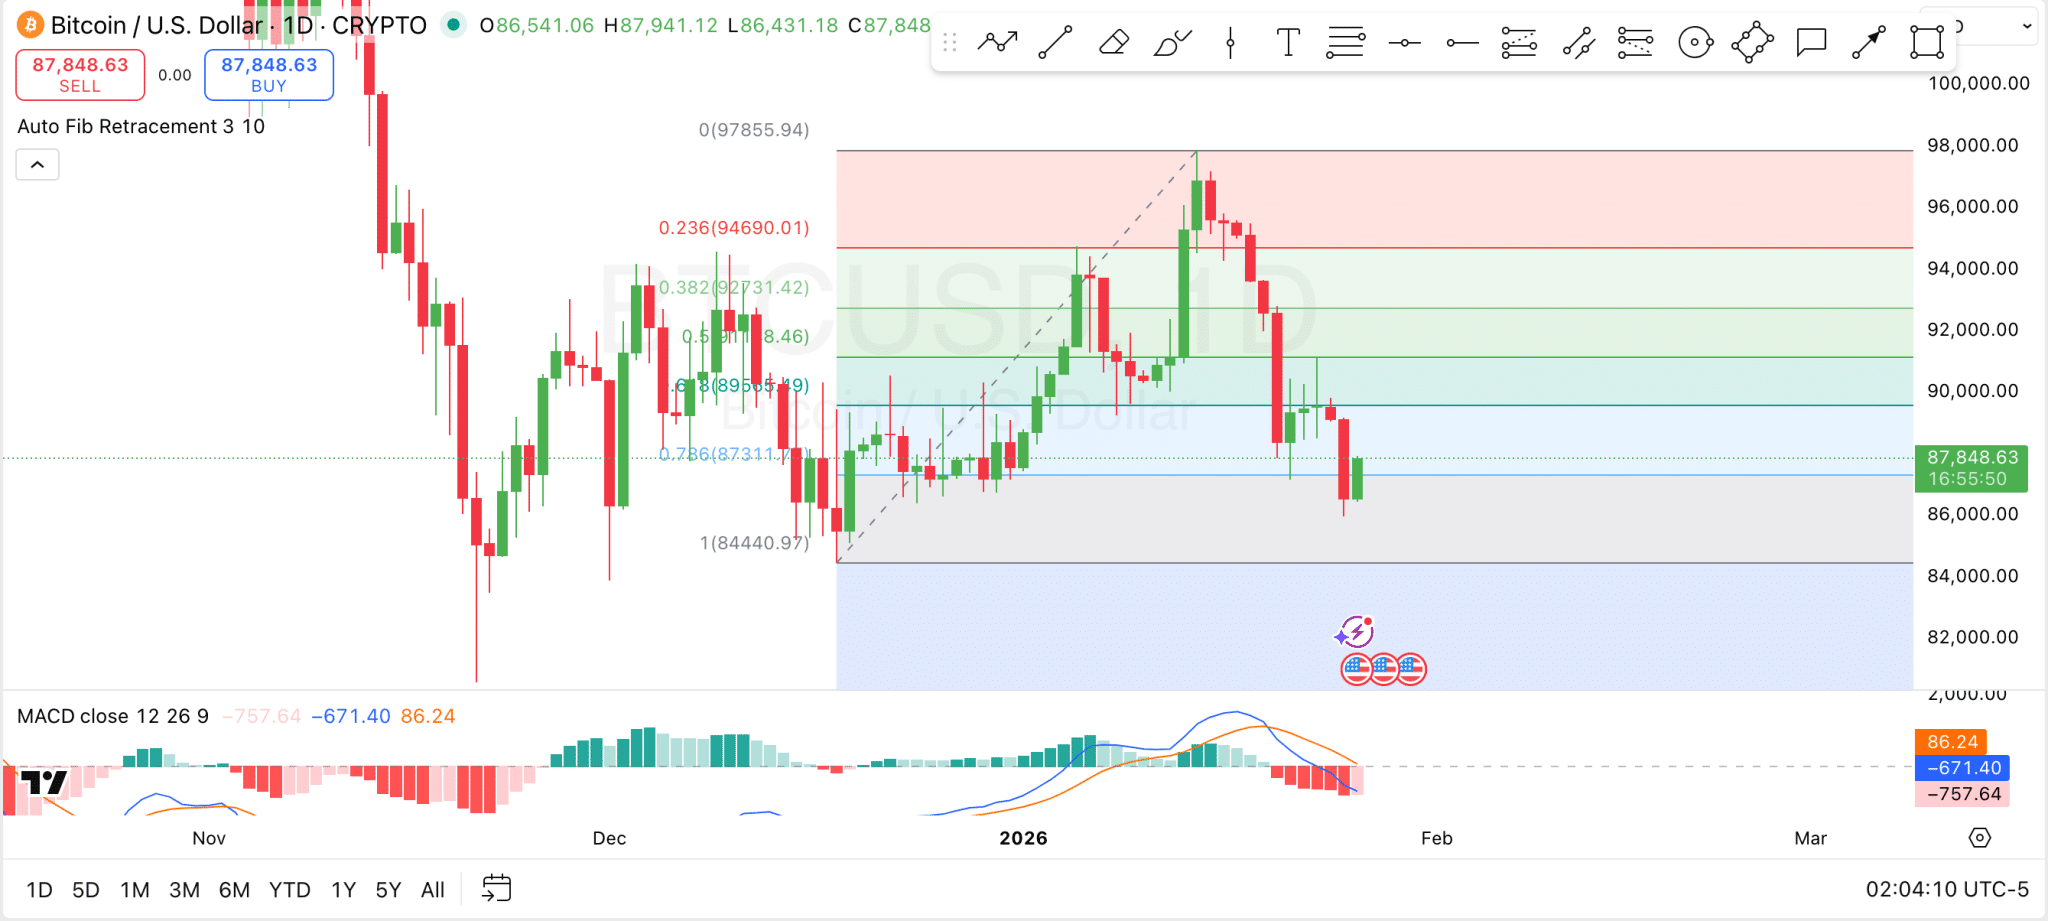
If BTC fails to hold this band, the chart opens room toward the prior swing low near $84,441, which becomes the next major downside reference. On the upside, the Fib ladder highlights clear recovery hurdles at $89,565 (0.618), then $91,148 (0.5) and $92,731 (0.382), levels that may attract selling if price rebounds.
Meanwhile, momentum indicators still reflect bearish control. Specifically, the MACD is in negative territory, with the histogram also below the zero line. This indicates downside momentum remains dominant despite the small bounce.
For the pullback pressure to ease meaningfully, traders typically look for the histogram to start contracting toward zero and for the MACD line to begin curling back up toward a bullish crossover.
Bitcoin Breaking Out of Key Flag?
On the social commentary end, analyst Ali Martinez said on X that Bitcoin was “breaking out of a flag” on an inverted 4-hour chart. This points to a technical setup that typically suggests a continuation move once price clears a consolidation channel.
The accompanying graphic shows BTC trading inside a downward-sloping flag, a tight range marked by parallel trend lines, before pushing toward the $86,388 area. In Martinez’s view, this confirmed breakout could shift attention to lower targets, with the chart highlighting $69,500 as the next level.