
Bitcoin faces renewed technical pressure as a veteran trader flags a completed bear channel, warning that downside risk remains dominant unless a critical price level is decisively reclaimed.
Peter Brandt Highlights Bearish Bitcoin Structure With $93K Key Invalidation Level
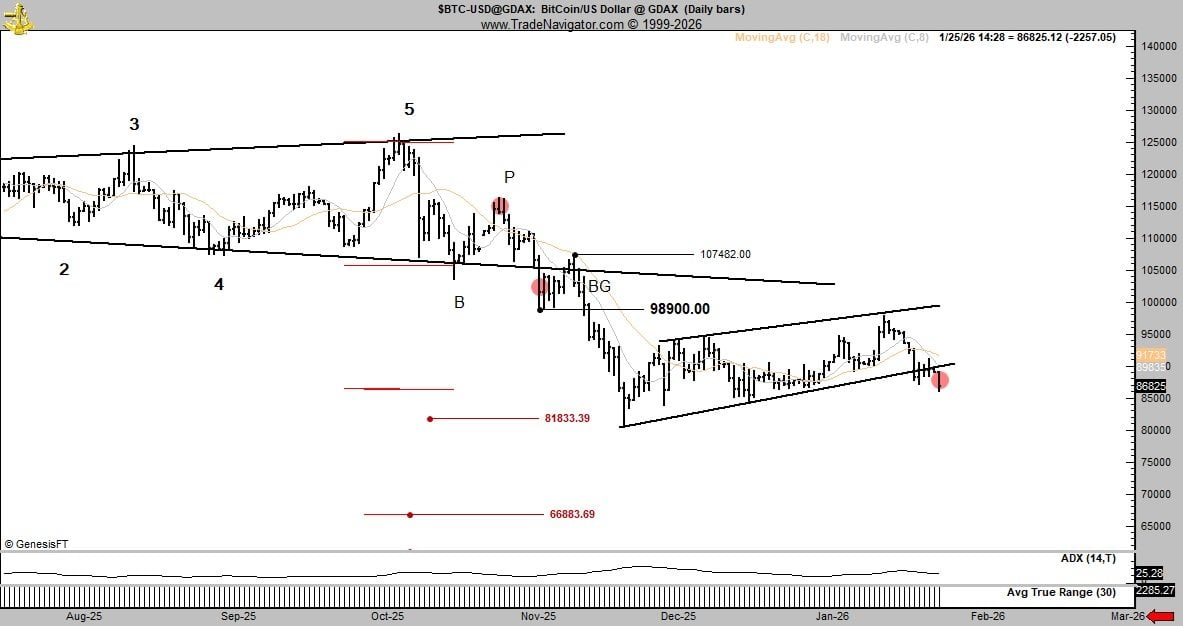
Peter Brandt, a veteran trader and chart analyst, shared on social media platform X on Jan. 25, 2026, a technical warning on bitcoin, pointing to a completed bear channel and signaling that recent price action continues to favor downside risk unless key levels are recovered.
He said:
“Yet another sell signal in bitcoin as a bear channel has been completed.”
“Remember that charts can always morph. Price needs to reclaim $93K to negate,” he added.
The comment reflected Brandt’s long-standing reliance on classical charting techniques, where completed bear channels frequently imply continuation pressure rather than immediate reversal. His emphasis on morphing charts highlighted the adaptive nature of technical analysis, particularly in volatile markets such as bitcoin, where patterns can fail or reverse rapidly. The chart associated with his post showed price trading below declining moving averages and capped by a longer-term descending trendline near $107,482. A former support zone around $98,900 appeared to have flipped into resistance, while a narrower rising structure into January failed, reinforcing the broader bearish framework unless price can reclaim the $93,000 threshold.
Read more: Peter Brandt Says $58K–$62K Is Where Bitcoin Is Likely Headed
Brandt has also recently outlined a deeper downside scenario while openly acknowledging the uncertainty inherent in market forecasting. The veteran trader and chart analyst posted on social media platform X on Jan. 19:
“$58K to $62K is where I think it is going.”
“If it does not go there, I will not be ashamed, so I do not need to see you trolls screen shot this in the future. I am wrong 50% of the time. It does not bother me to be wrong,” he further shared. That statement underscored his probabilistic approach to chart analysis, where projections are framed as possibilities rather than predictions. The lower price range he referenced aligns with historical support zones visible on longer-term charts and with measured-move targets derived from prior breakdown structures.
While such levels would imply significant downside from current prices, bitcoin has previously invalidated similar bearish projections through abrupt trend reversals driven by liquidity shifts, derivatives positioning resets, and renewed spot demand. These countervailing forces illustrate that Brandt’s scenarios function as risk markers within a broader analytical framework rather than definitive outcomes.
FAQ ⏰
-
What sell signal did Peter Brandt identify on bitcoin?
He pointed to a completed bear channel signaling continued downside risk. -
Why is $93,000 important for bitcoin’s chart?
Brandt said reclaiming $93K would negate the current bearish structure. -
What technical levels are acting as resistance for bitcoin?
Declining moving averages and resistance near $98,900 and $107,482 are capping price. -
What downside support zones were highlighted?
The chart marked potential support near $81,833 and $66,883.