
Bitcoin is testing key Bollinger Band resistance, with traders awaiting a breakout for bullish momentum or a potential retracement.
Bitcoin (BTC) has experienced some fluctuations in recent hours, with the price hovering just below the $90,000 mark. The chart shows a series of up-and-down movements, with Bitcoin briefly testing a high of around $90,159 before retreating below $89,500. This volatility came after a week marked by mixed signals in the market, as Bitcoin failed to sustain upward momentum despite positive developments in regional equities and a weakening U.S. dollar.
The price movements from the chart indicate Bitcoin’s ongoing struggle to break and close above the $90,000 resistance zone. Notably, Bitcoin’s price action over the past week has shown some significant volatility, with a decline of 6.4% in the last 7 days. On a 14-day basis, Bitcoin is down by 3%, further confirming the lack of a strong upward trend.
Traders will now be looking for a breakout above $90,000 for further confirmation of bullish momentum or a possible decline.
Where is Bitcoin Headed?
In the latest 4-hour chart for Bitcoin, the price shows consolidation between the upper and lower bands of the Bollinger Bands. The price briefly tested the middle band at $89,704, indicating initial resistance. However, the first-born crypto has pulled back toward the lower band based at $88,302, signaling a possible lack of momentum to break higher.
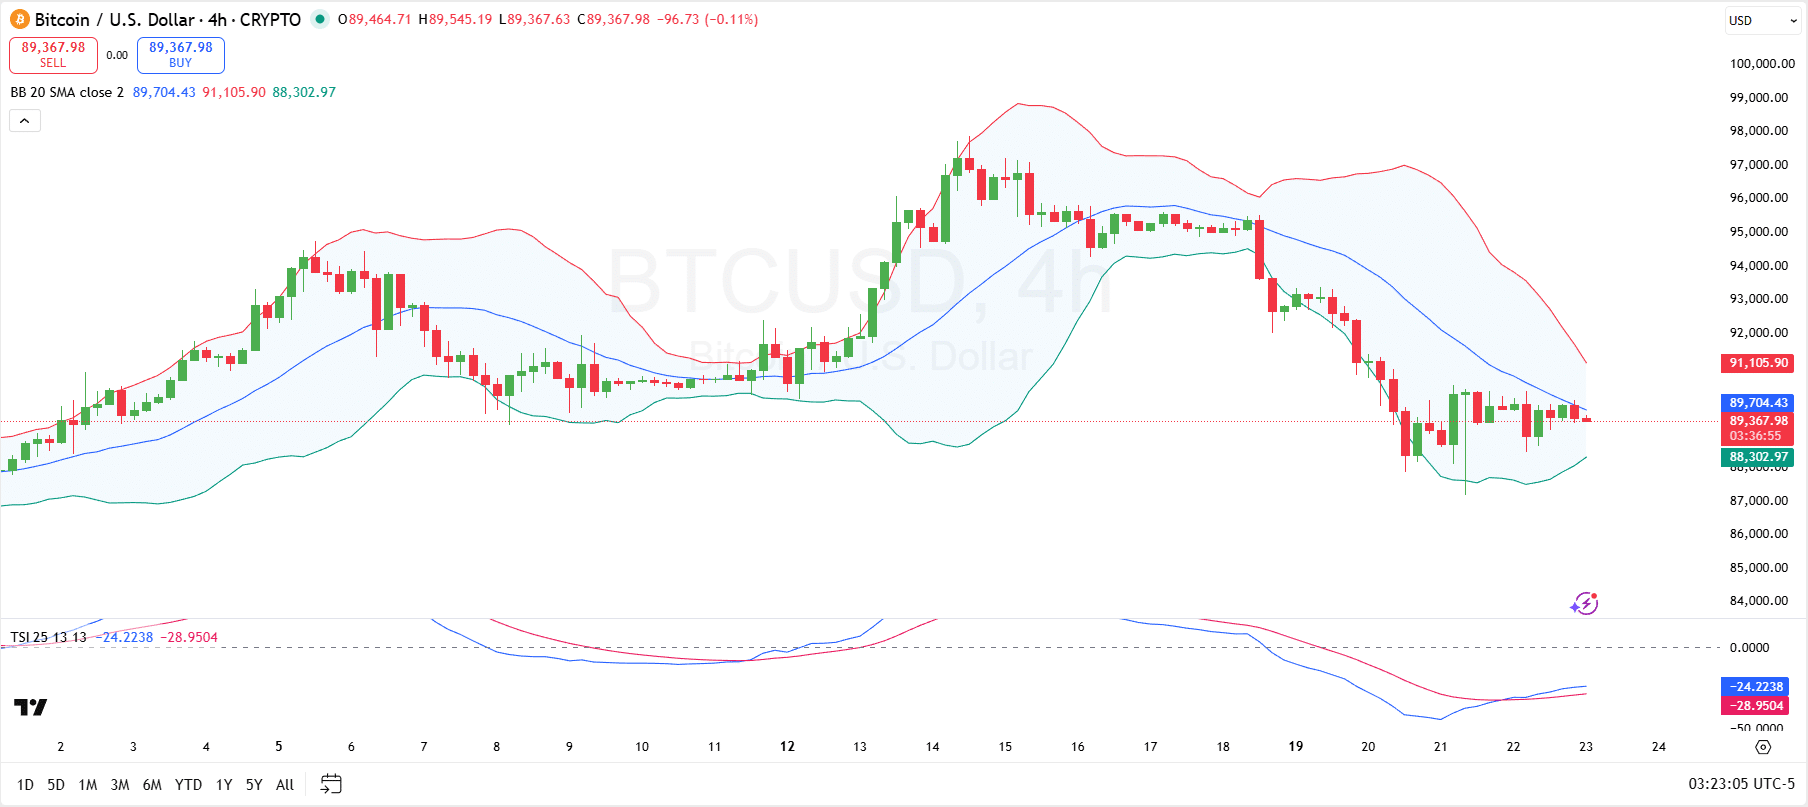
If Bitcoin fails to breach the middle band and close above it, it could face a retracement to the lower band, representing immediate support. Traders will closely watch this range for any decisive price action.
In addition to the Bollinger Bands, the True Strength Index indicator shows negative values, with the blue line crossing above the red line. This confirms that bearish momentum has persisted but is shifting in the short term. For a bullish reversal to occur, the TSI would need to flip to positive territory.
Overall, a break above the resistance level at the middle band could launch BTC to the upper Bollinger Band at $91,105.
Analyst Points at Potential $135,000 Surge
Looking elsewhere, analyst Trader Tardigrade recently pointed out on X that Bitcoin has been following a distinct Zig-zag pattern on the weekly chart. This pattern features alternating bullish and bearish movements, where upward rallies meet subsequent pullbacks, creating a back-and-forth movement.

Tardigrade suggests that if this pattern persists, Bitcoin could experience another surge following its current consolidation phase, potentially targeting higher levels like above $135,000. However, if the pattern continues to follow the expected course, a correction could follow, pushing Bitcoin back down to test support zones around $112,000.