
Bitcoin’s price edged slightly below $90,000 to rest at $89,962, with a market capitalization of $1.79 trillion and around $54.29 billion in 24-hour trading volume. The intraday trading range spanned from $87,304 to $90,295, pointing to a tense standoff between buyers and sellers. The market is teetering on the edge of direction, and frankly, bitcoin isn’t in the mood to make up its mind just yet.
Bitcoin Chart Outlook
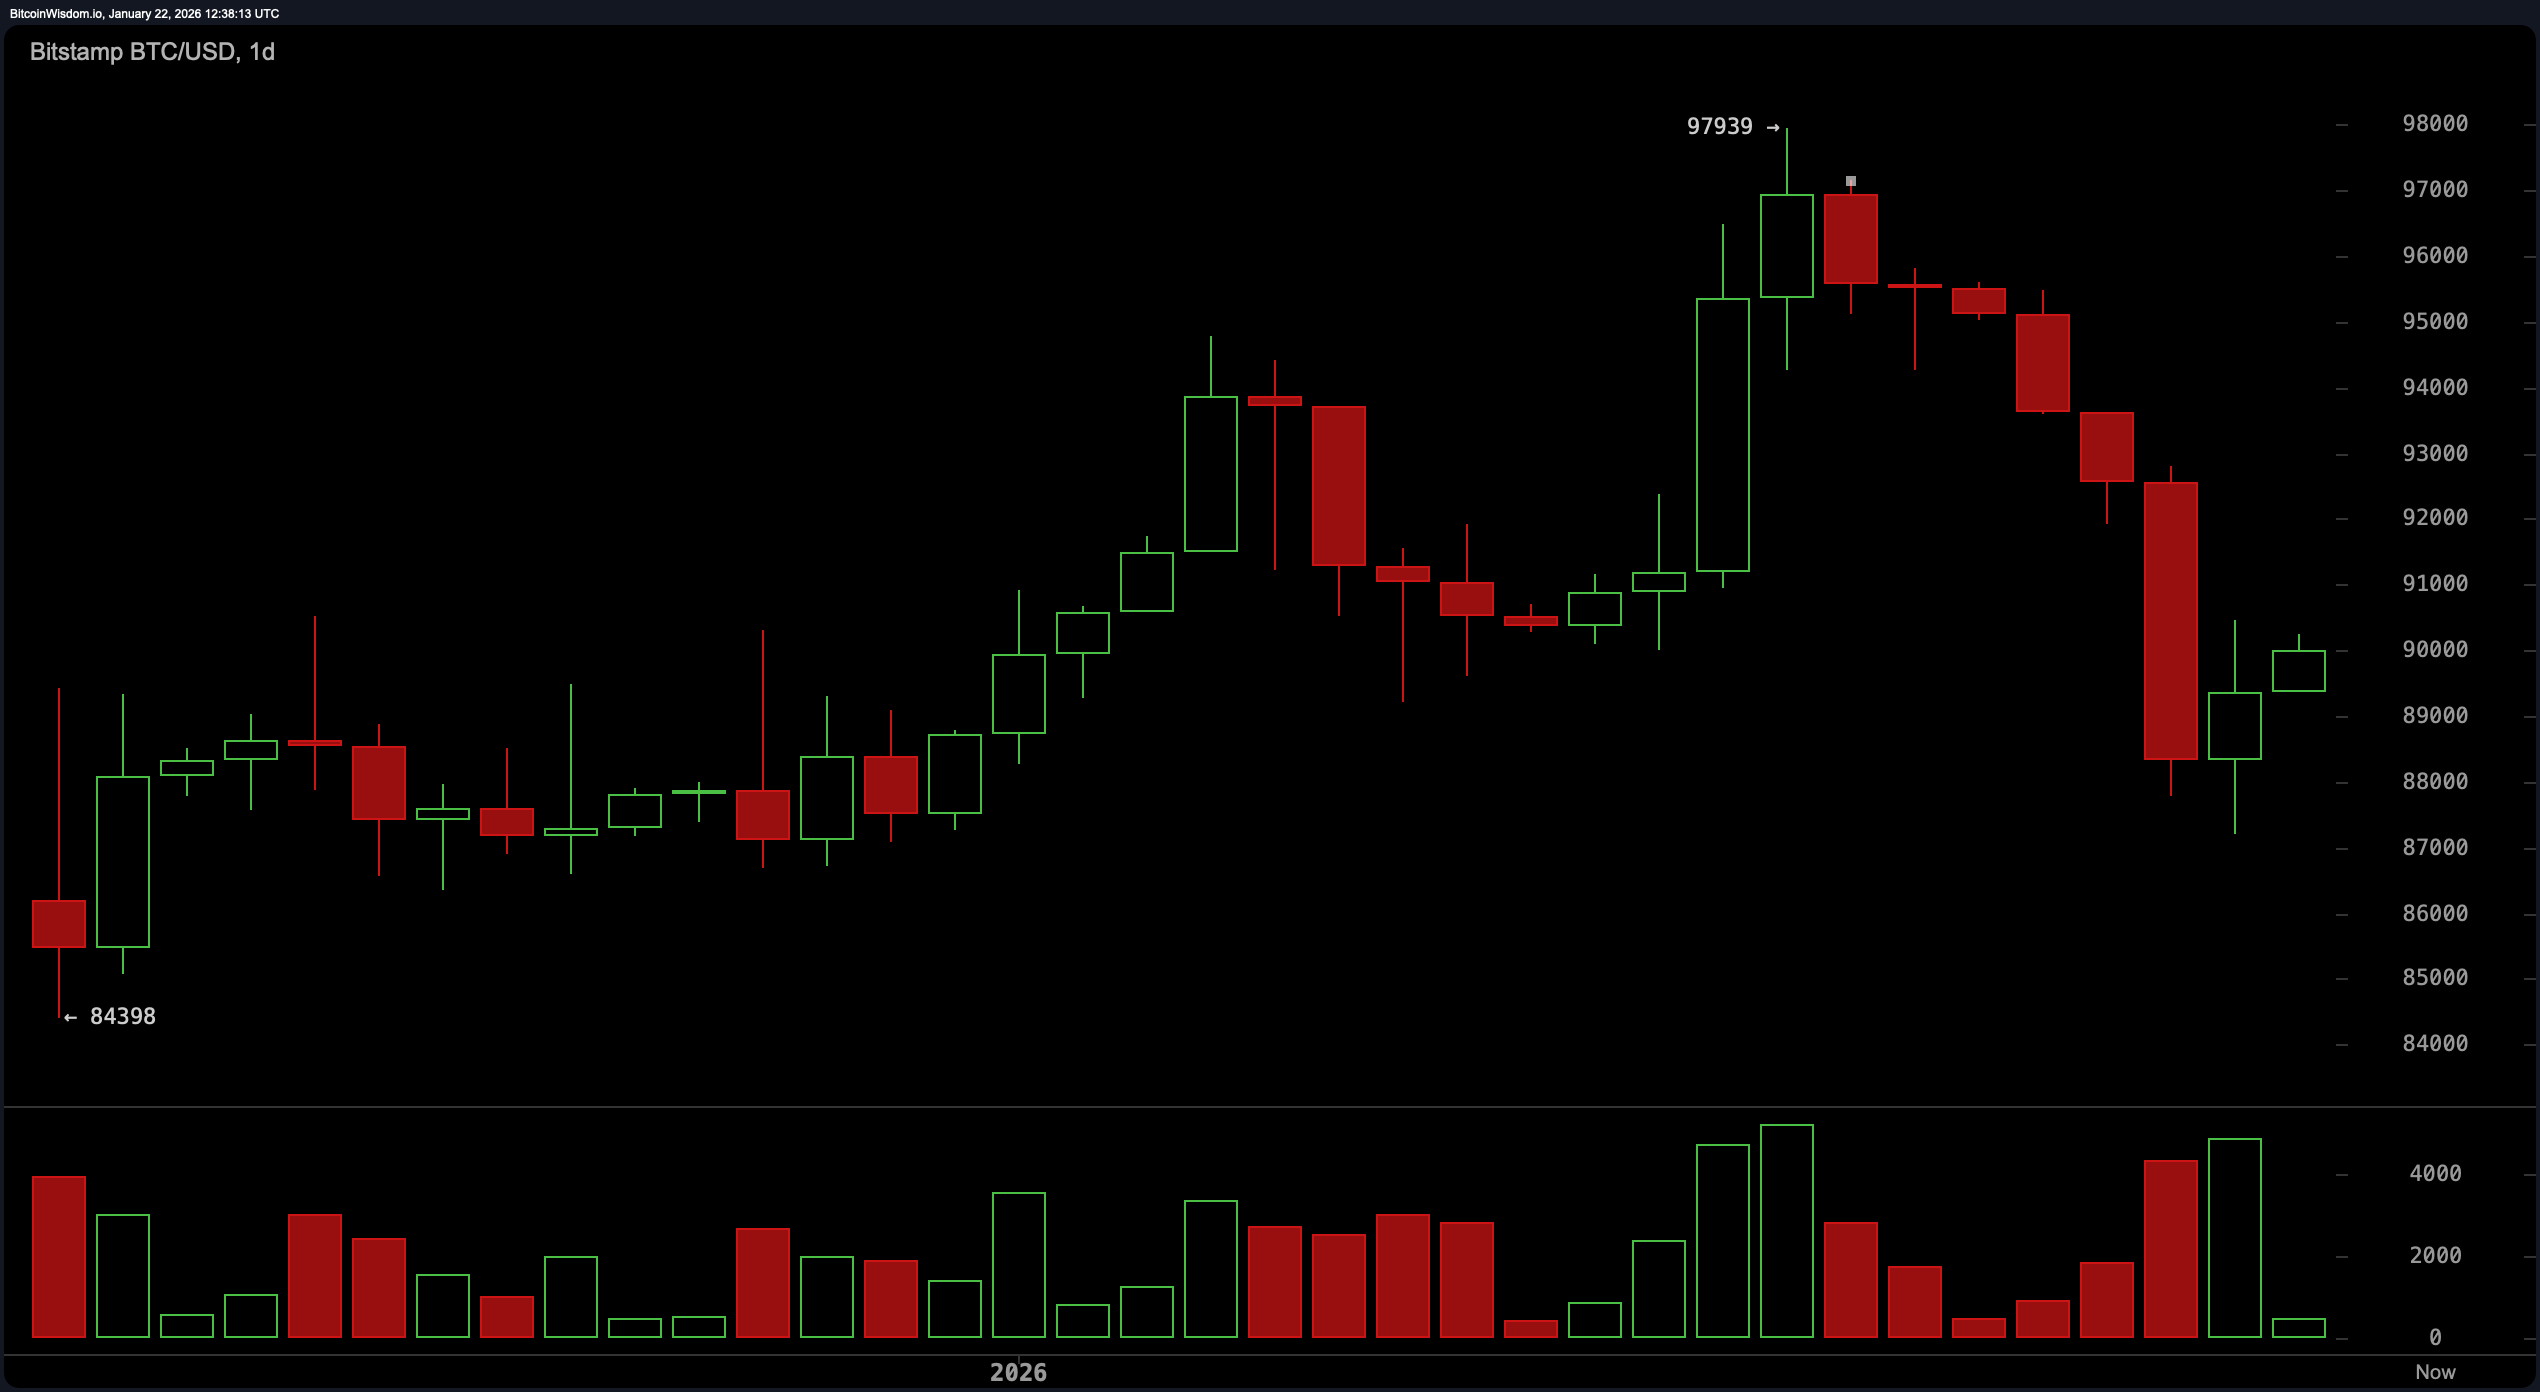
Across the daily chart, the mood has shifted from exuberance to caution. Bitcoin rallied impressively to $97,939 before faceplanting into a red candle meltdown that dragged it down to sub-$88,000 territory. That pullback occurred with heavy volume, signaling panic—or possibly capitulation—from leveraged hands.
Support is clinging to the $87,000–$88,000 zone, which previously held during a bounce. Resistance now looms overhead at $93,000–$94,000, a flip from old support, while $97,939 remains the swing-high ceiling for any future aspirations.
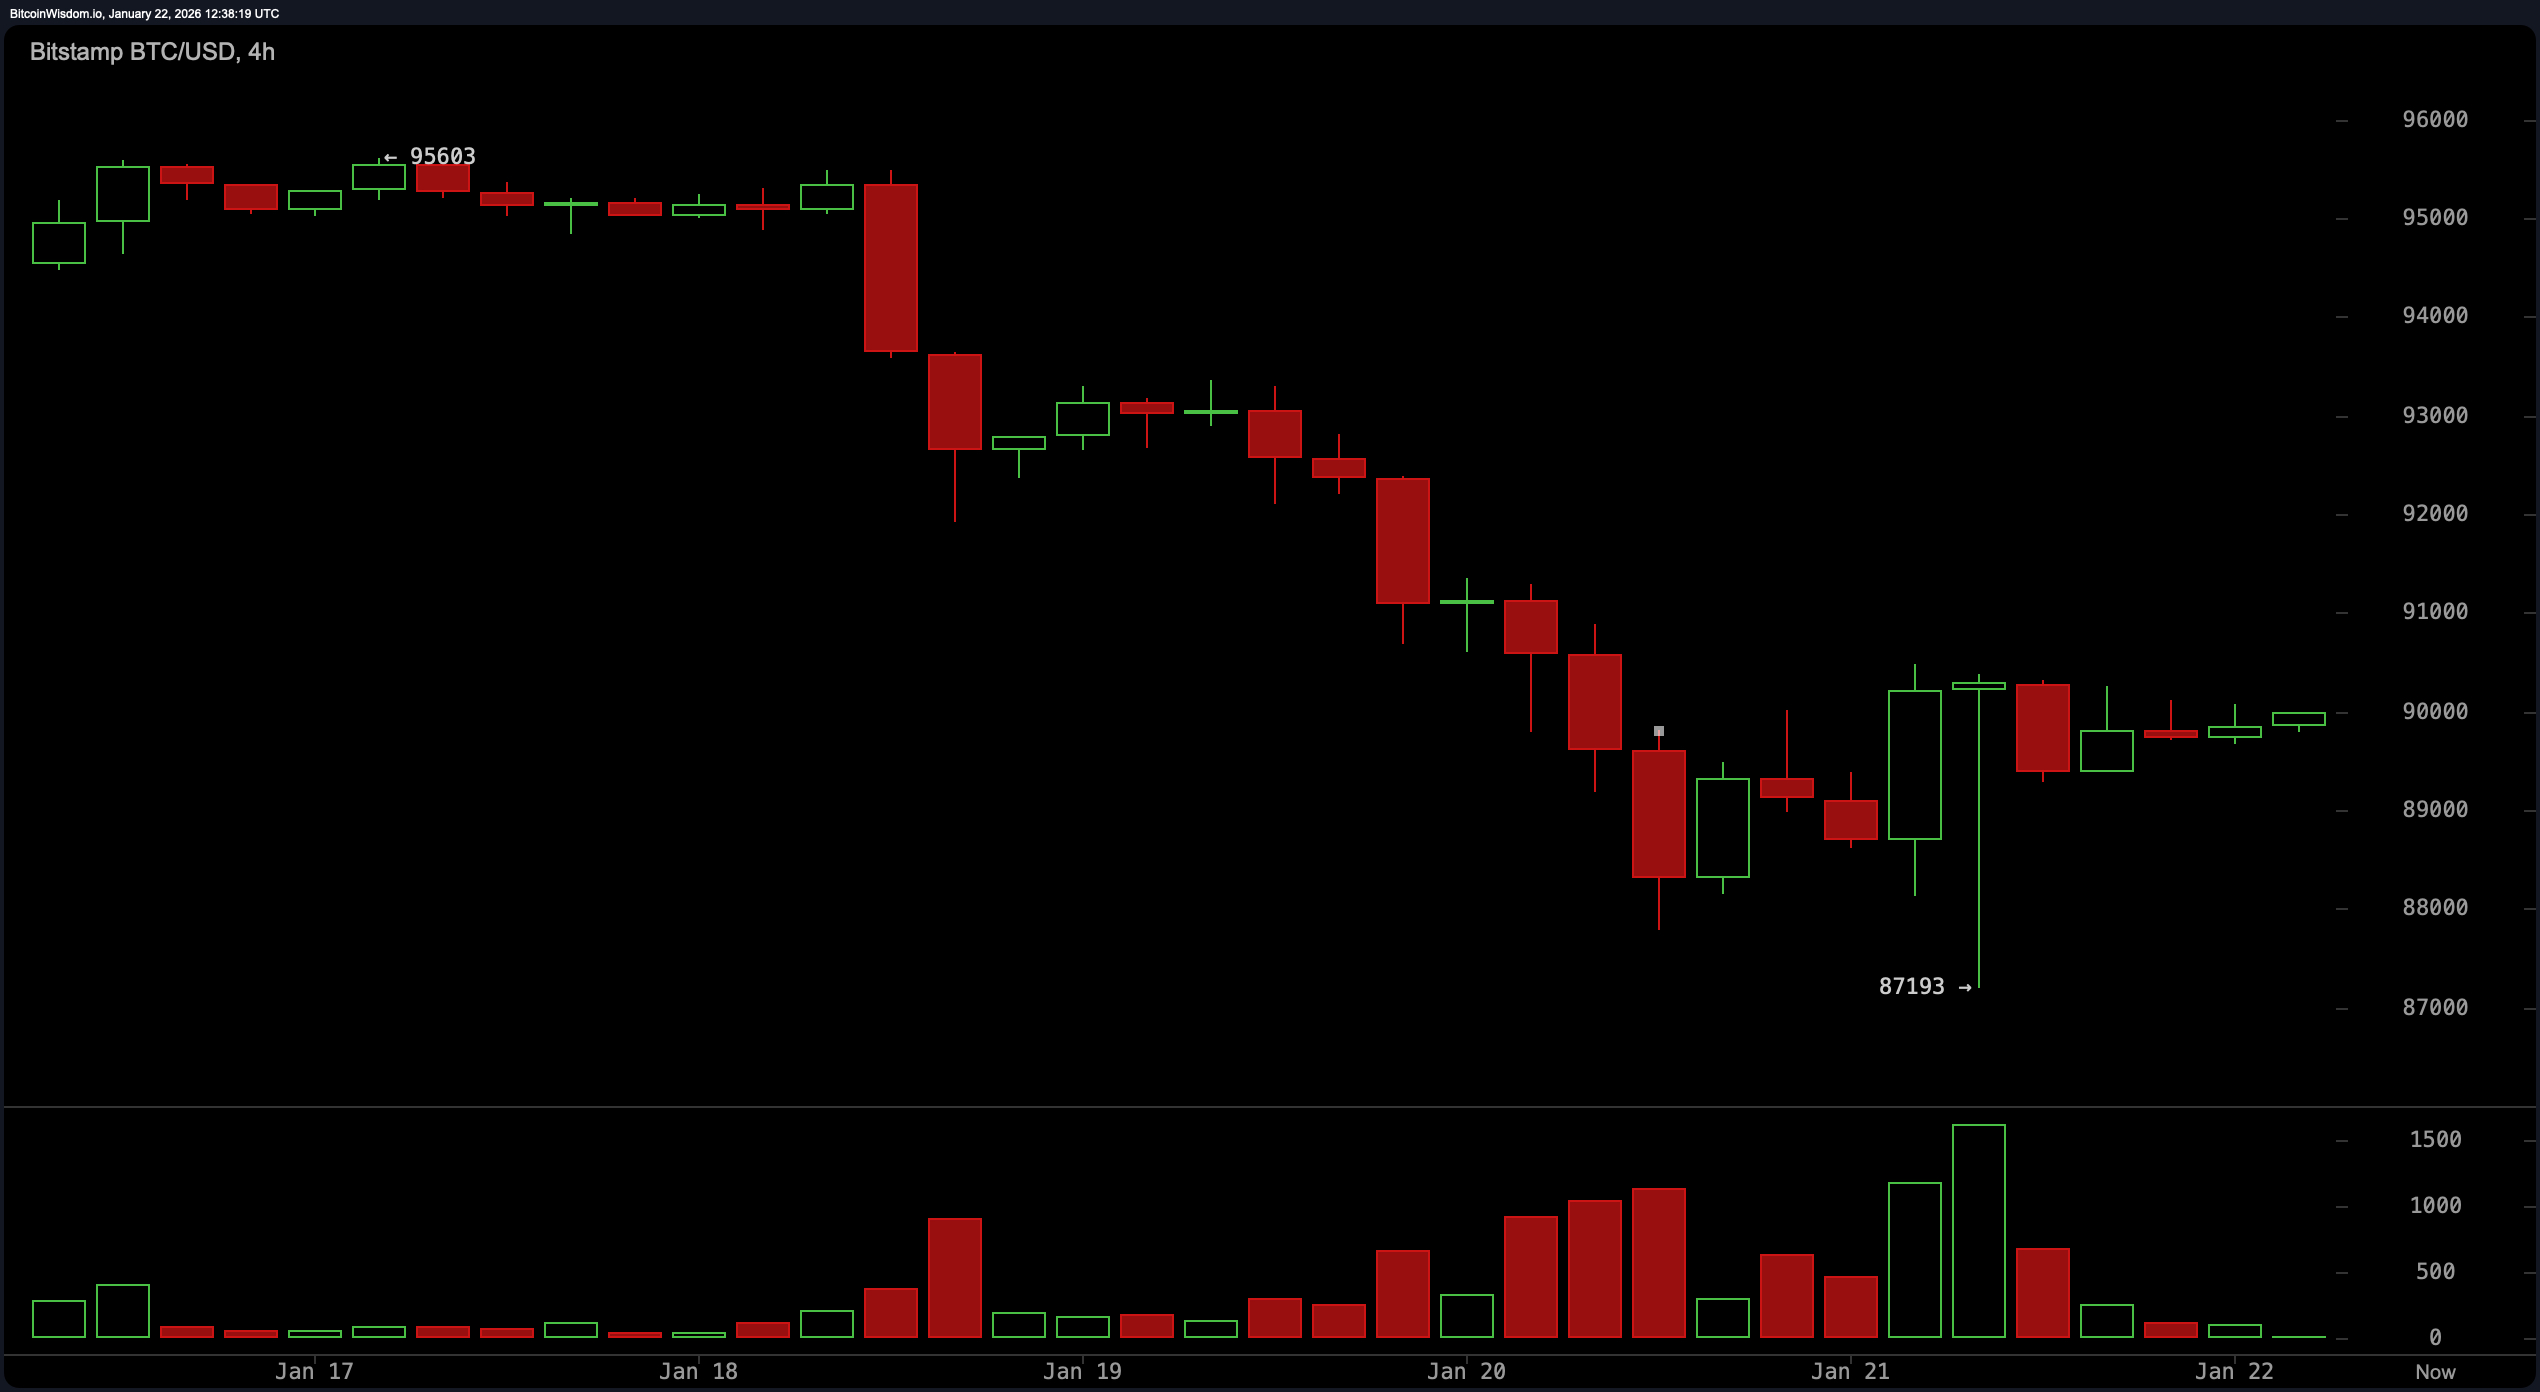
The 4-hour chart tells a tale of a tired market trying to catch its breath. Bitcoin has been cascading down from $95,603 and found some footing at $87,193, which seems to be acting as a short-term base. A flurry of buy volume accompanied the bounce, hinting that smart money might be testing the waters. The current movement is a sideways shuffle around $88,000–$90,000, a consolidation zone that could become a launchpad—or a trap. A clean break above $90,500 with strong volume could signal renewed upside interest, while any wobble back below $88,000 would paint a bleaker picture.
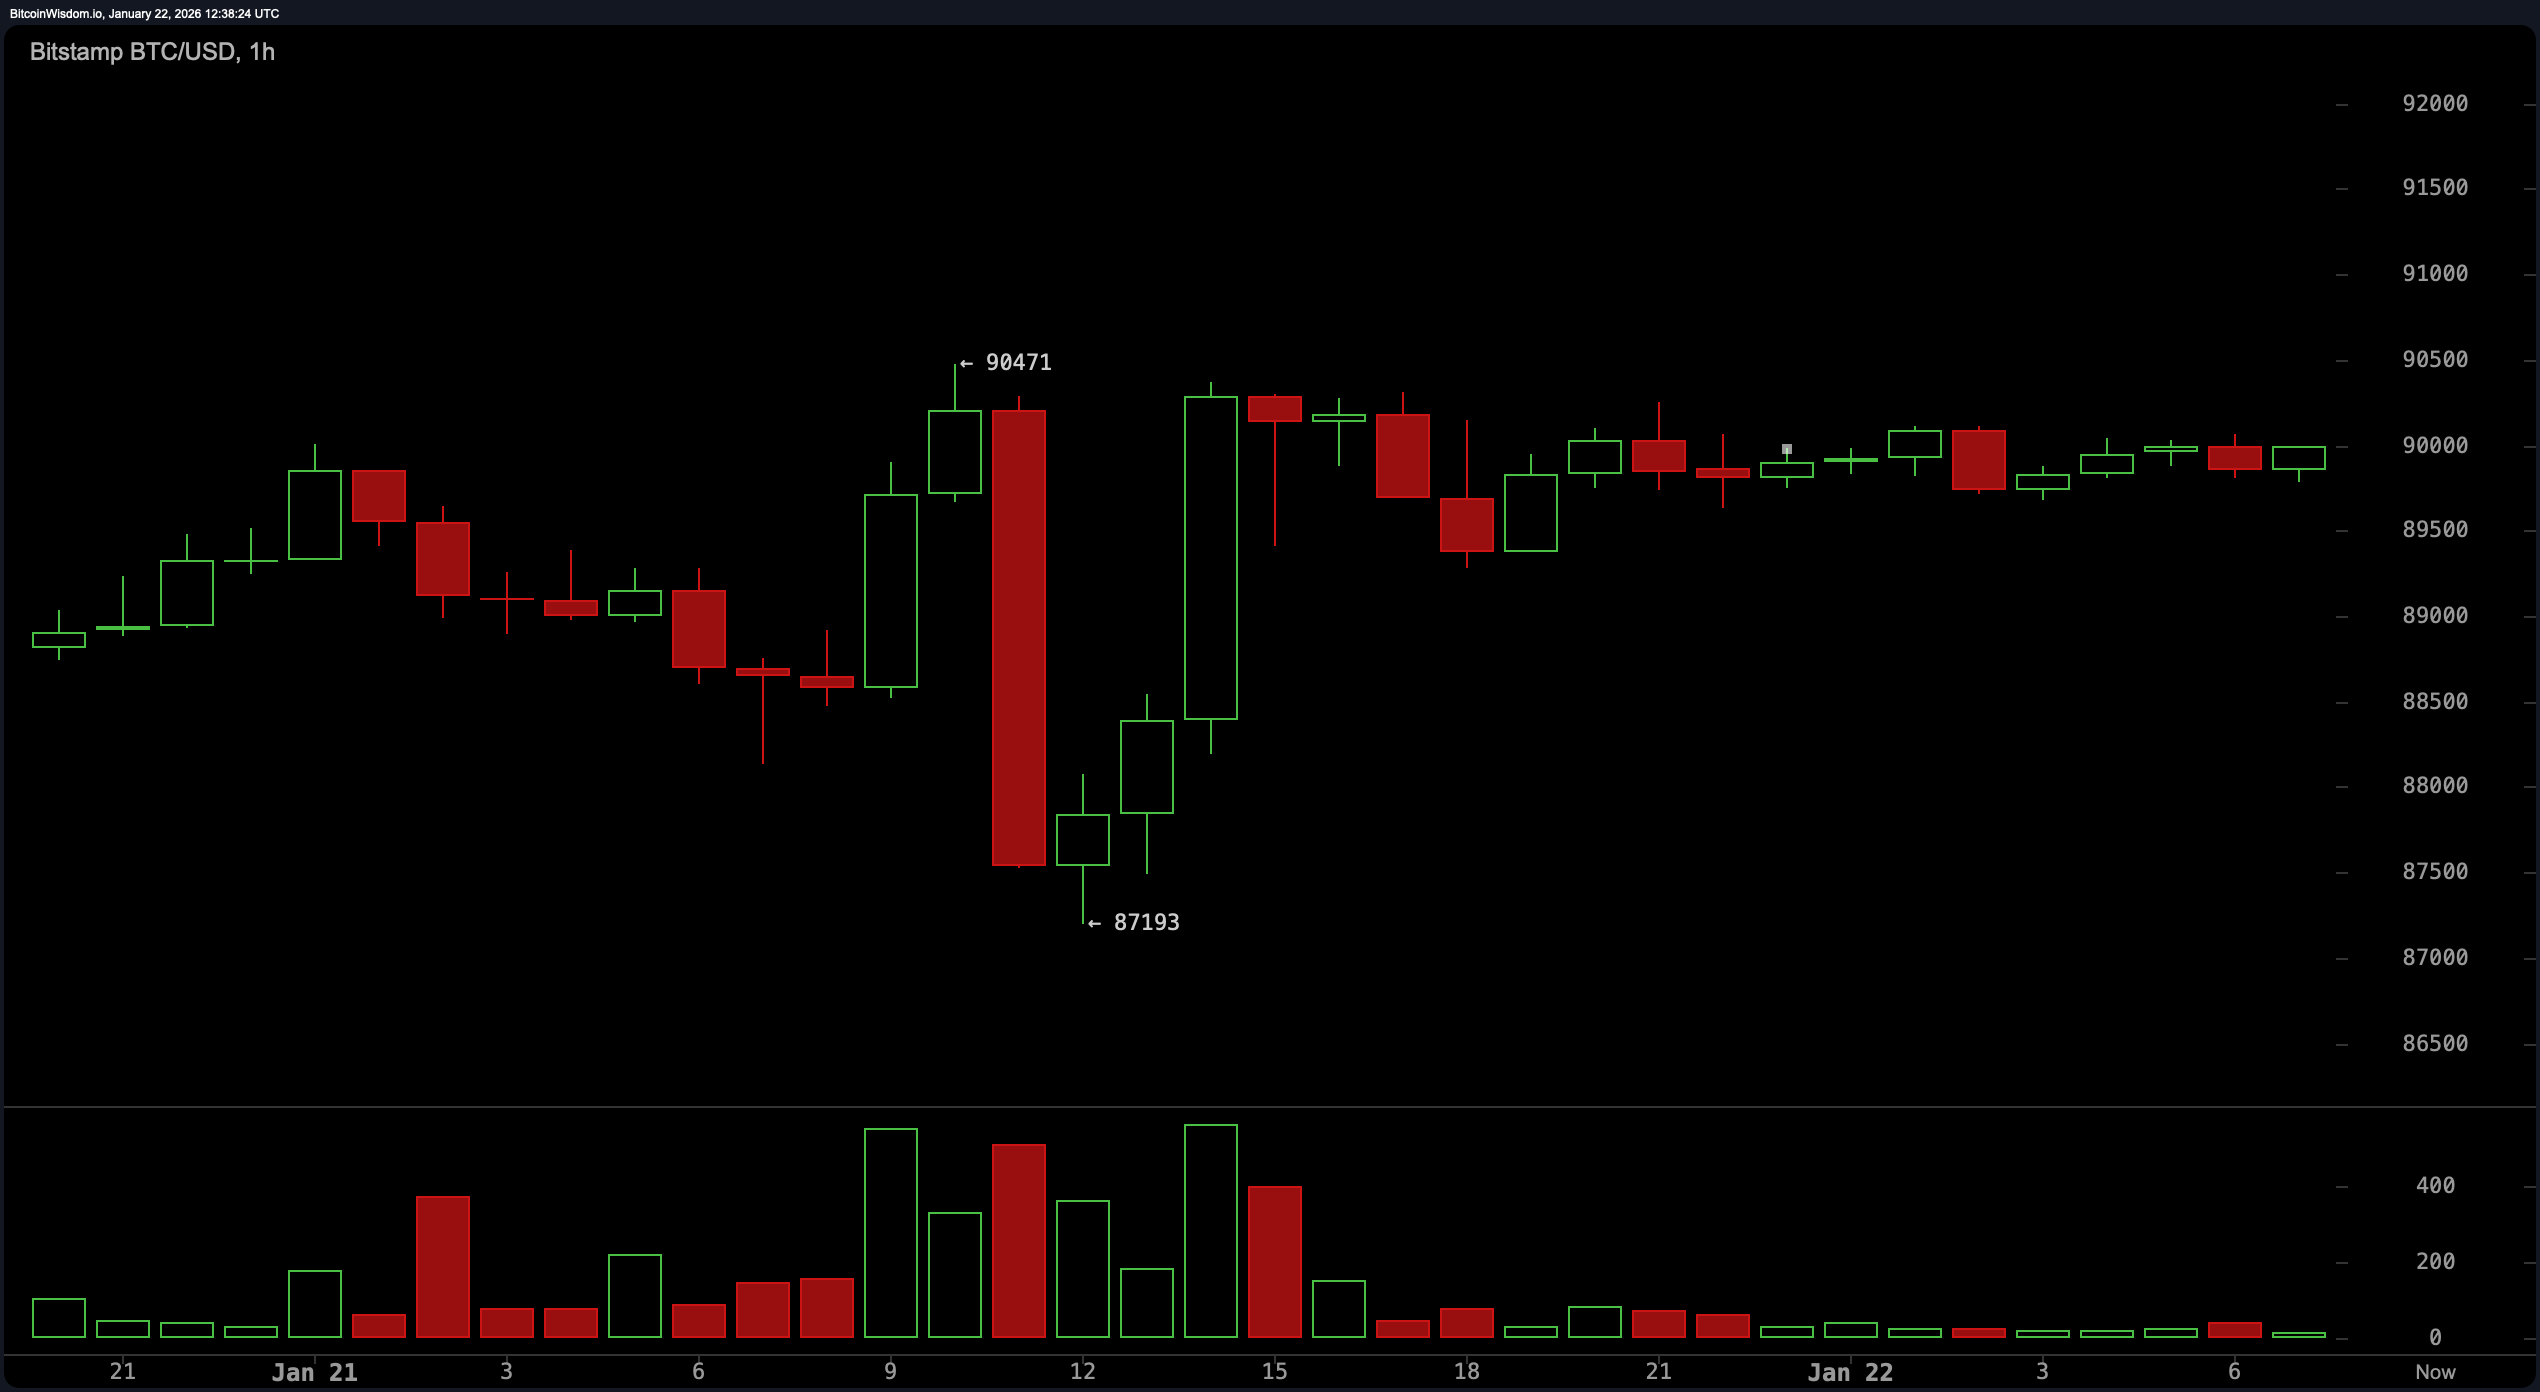
On the 1-hour chart, the volatility dial is cranked to eleven. A sharp wick stabbed down to $87,193, only to reverse just as fiercely back above $90,000—a classic move to shake out the weak hands. Bitcoin has since settled into a choppy limbo between $89,000 and $90,500, oscillating with the kind of indecision that traders both love and loathe. The candle at $90,471 suggests overhead rejection, hinting at resistance that’s still very much in play. Volume will be the make-or-break factor in determining if this tight range resolves up or down.
Looking at the technical indicators, it’s a masterclass in market neutrality with a splash of confusion. The relative strength index ( RSI) sits at 45, while the Stochastic oscillator is down at 17—both indicating a market too tired to commit to a narrative. The commodity channel index (CCI) is sulking at −82, the average directional index (ADX) is at 29, and the Awesome oscillator remains positive but non-committal at 691. Momentum is flashing a positive −1,246 (yes, negative momentum suggesting a positive tilt—markets love to confuse), while the moving average convergence divergence ( MACD) level reads 240, skewed to the downside.
Moving averages? Oh, they’re not feeling optimistic. All of them—whether you fancy exponential or simple—are clustered well above the current price and leaning into downward pressure. From the exponential moving average (EMA) and simple moving average (SMA) on the 10-period through the 200-period, every single one is flashing a bearish signal. The 10-day EMA stands at 91,660 and the 200-day SMA towers at 105,442. If bitcoin wants to reclaim its bullish sparkle, it’ll have to climb over a serious wall of average resistance first.
Bull Verdict:
If bitcoin manages to hold the $88,000 level and break convincingly above $90,500 with volume to match, we could be witnessing the formation of a higher low in a broader bullish continuation pattern. The recent pullback may just be a healthy reset, shaking out the overzealous before a renewed run toward the $93,000–$94,000 resistance. Until proven otherwise, the bulls still have a leg to stand on—though they’re balancing on it like it’s a tightrope.
Bear Verdict:
Despite the high- volume bounce, the inability to reclaim even the 10-period exponential moving average suggests bitcoin is still on the defensive. Every major moving average is stacked overhead like a descending ladder, and any break below $87,000 opens the door to retesting $84,000 or worse. Unless momentum shifts dramatically, this market looks more like it’s coiling for another leg down than preparing for liftoff.
FAQ ❓
- What is bitcoin’s price today, Jan. 22, 2026? Bitcoin is trading at $89,962 with high volatility in the $87,304–$90,295 range.
- Is bitcoin in a bullish or bearish trend right now? Bitcoin is consolidating sideways with mixed signals and resistance near $94,000.
- What are the key bitcoin support and resistance levels?Support sits at $87,000–$88,000, while resistance stands firm at $93,000–$94,000.
- Are technical indicators showing strength or weakness for bitcoin?Most moving averages and the MACD ( moving average convergence divergence) suggest weakness, while momentum and volume hint at potential recovery.