
Bitcoin defends key support amid short-term volatility, with an analyst indicating that recent pullbacks are a result of temporary de-risking.
Bitcoin ($BTC) is currently trading just above $89,000, experiencing a notable 5% drop in the past 24 hours. The daily chart shows significant volatility with $BTC moving in a range between $87,901 and $92,258 during the day.
The recent decline is attributable to geopolitical risks and a bond market selloff, which have contributed to investor caution across various asset classes, including cryptos. As a result, $BTC has faced some downward pressure, and despite a brief recovery from the low, it is still holding below the $90,000 psychological mark.
Bitcoin has decreased 6.6% over the past 7 days, signaling ongoing challenges in the market despite strong fundamentals. However, the crypto firstborn has remained resilient in the longer term, up 0.7% over the past 30 days.
Traders will be keeping an eye on the $89,000 to $90,000 range for signs of support and whether Bitcoin can regain momentum. Where next for Bitcoin?
What’s Next for $BTC?
Notably, CryptosRus, an analyst on X, recently analyzed the Bitcoin pullbacks between 2025 and 2026, emphasizing that these price drops align with macro-level shocks related to tariffs and trade tensions. The key examples cited by CryptosRus include the April 2025 drop, where sweeping tariffs triggered a 12% decrease in Bitcoin’s price.

Similarly, in October 2025, the escalation of the U.S.–China trade conflict caused another significant pullback, with Bitcoin dropping around 8%. Lastly, the January 2026 decline occurred amid rising trade risks between the U.S. and Europe, leading to a 7% drop in Bitcoin’s price.
These occurrences highlight Bitcoin’s sensitivity to broader economic policies. They position it as a macro-sensitive risk asset impacted by changes in growth expectations, interest rates, and liquidity.
However, despite these price movements, CryptosRus points out an important detail: exchange netflows have not shown sustained dumping during these sell-offs. While there were temporary bursts of inflows during market drops, these were short-lived, indicating that the market quickly absorbed the selling pressure.
CryptosRus suggests that this behavior reflects temporary de-risking by market participants rather than a structural breakdown in demand for Bitcoin. If exchange inflows were to remain consistently high, this would signal a more significant shift in market sentiment. For now, the volatility appears to be driven by macro-level policy shocks, rather than an indication of the end of the Bitcoin cycle.
Bitcoin Technical Analysis
Looking at TradingView, price action has been testing the Bollinger Bands, with the price recently approaching the lower band around $87,645 and subsequently bouncing before touching it. The Relative Strength Index is currently at 43.07, indicating that Bitcoin is now moving towards neutral territory.
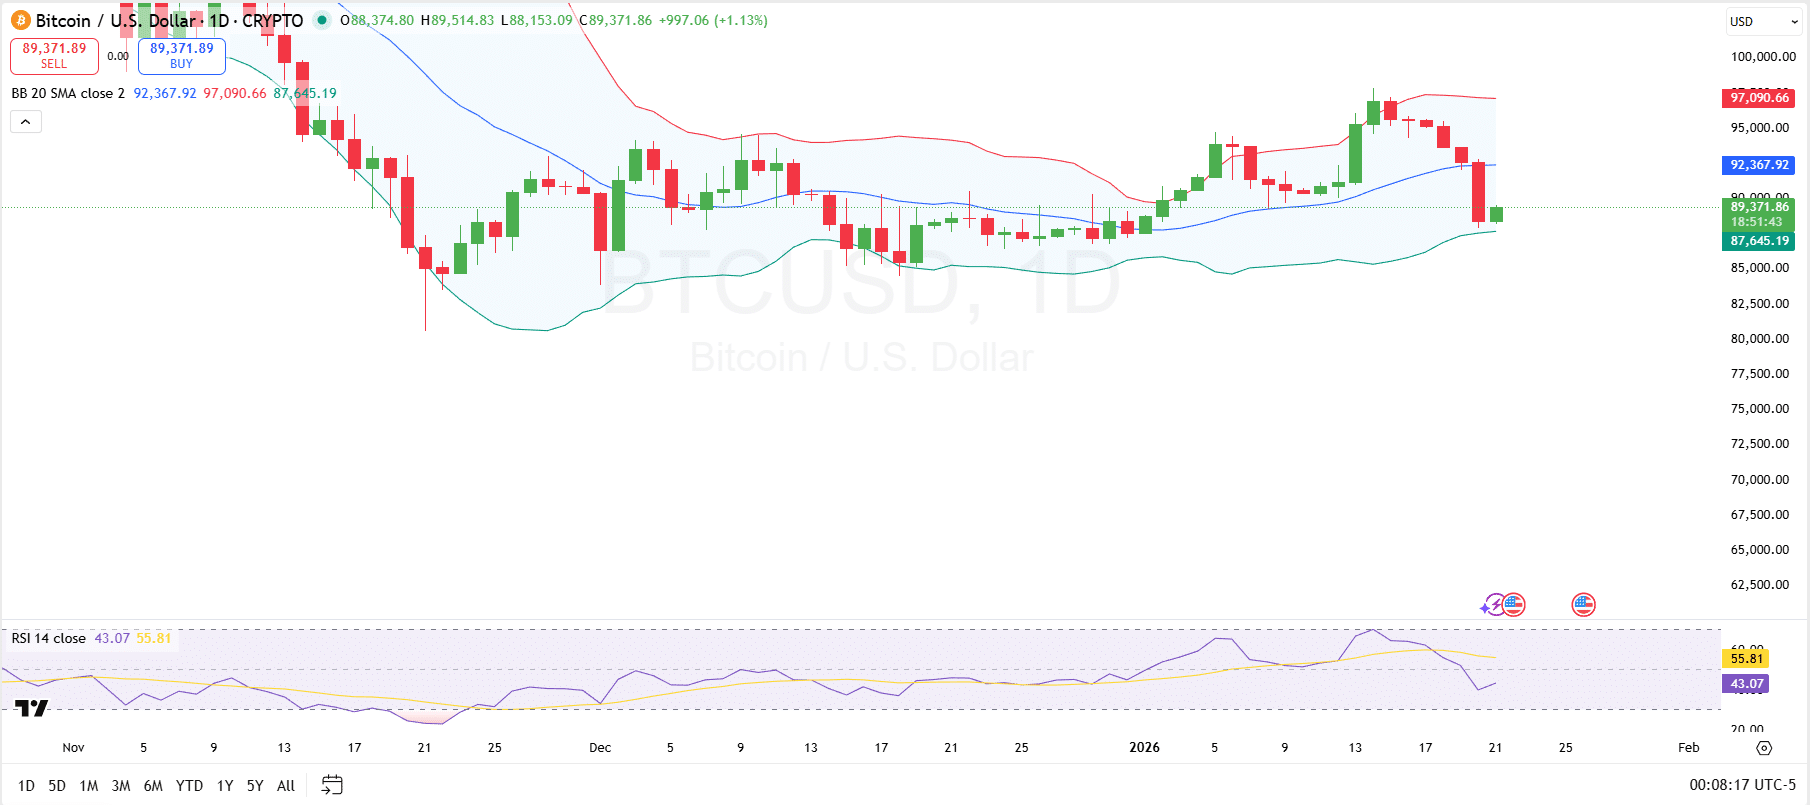
If the price manages to hold above the support found at $87,800 and break through the middle band near $92,367, it could be a signal for renewed buying pressure. Conversely, if Bitcoin fails to maintain its support at these levels, the downside risk remains, potentially testing the $87,645 and lower levels.
As the price moves above the middle band, it would indicate that buying momentum is gaining strength, potentially pushing the price toward the upper Bollinger Band near $97,081.