
Bitcoin is currently priced at $92,970, with a formidable market cap of $1.85 trillion. Over the past 24 hours, it has moved within an intraday range of $91,917 to $95,467 on a trading volume of $41.72 billion. If bitcoin were a poker player, it just might be bluffing—trading sideways after an intense hand, daring the market to call.
Bitcoin Chart Outlook
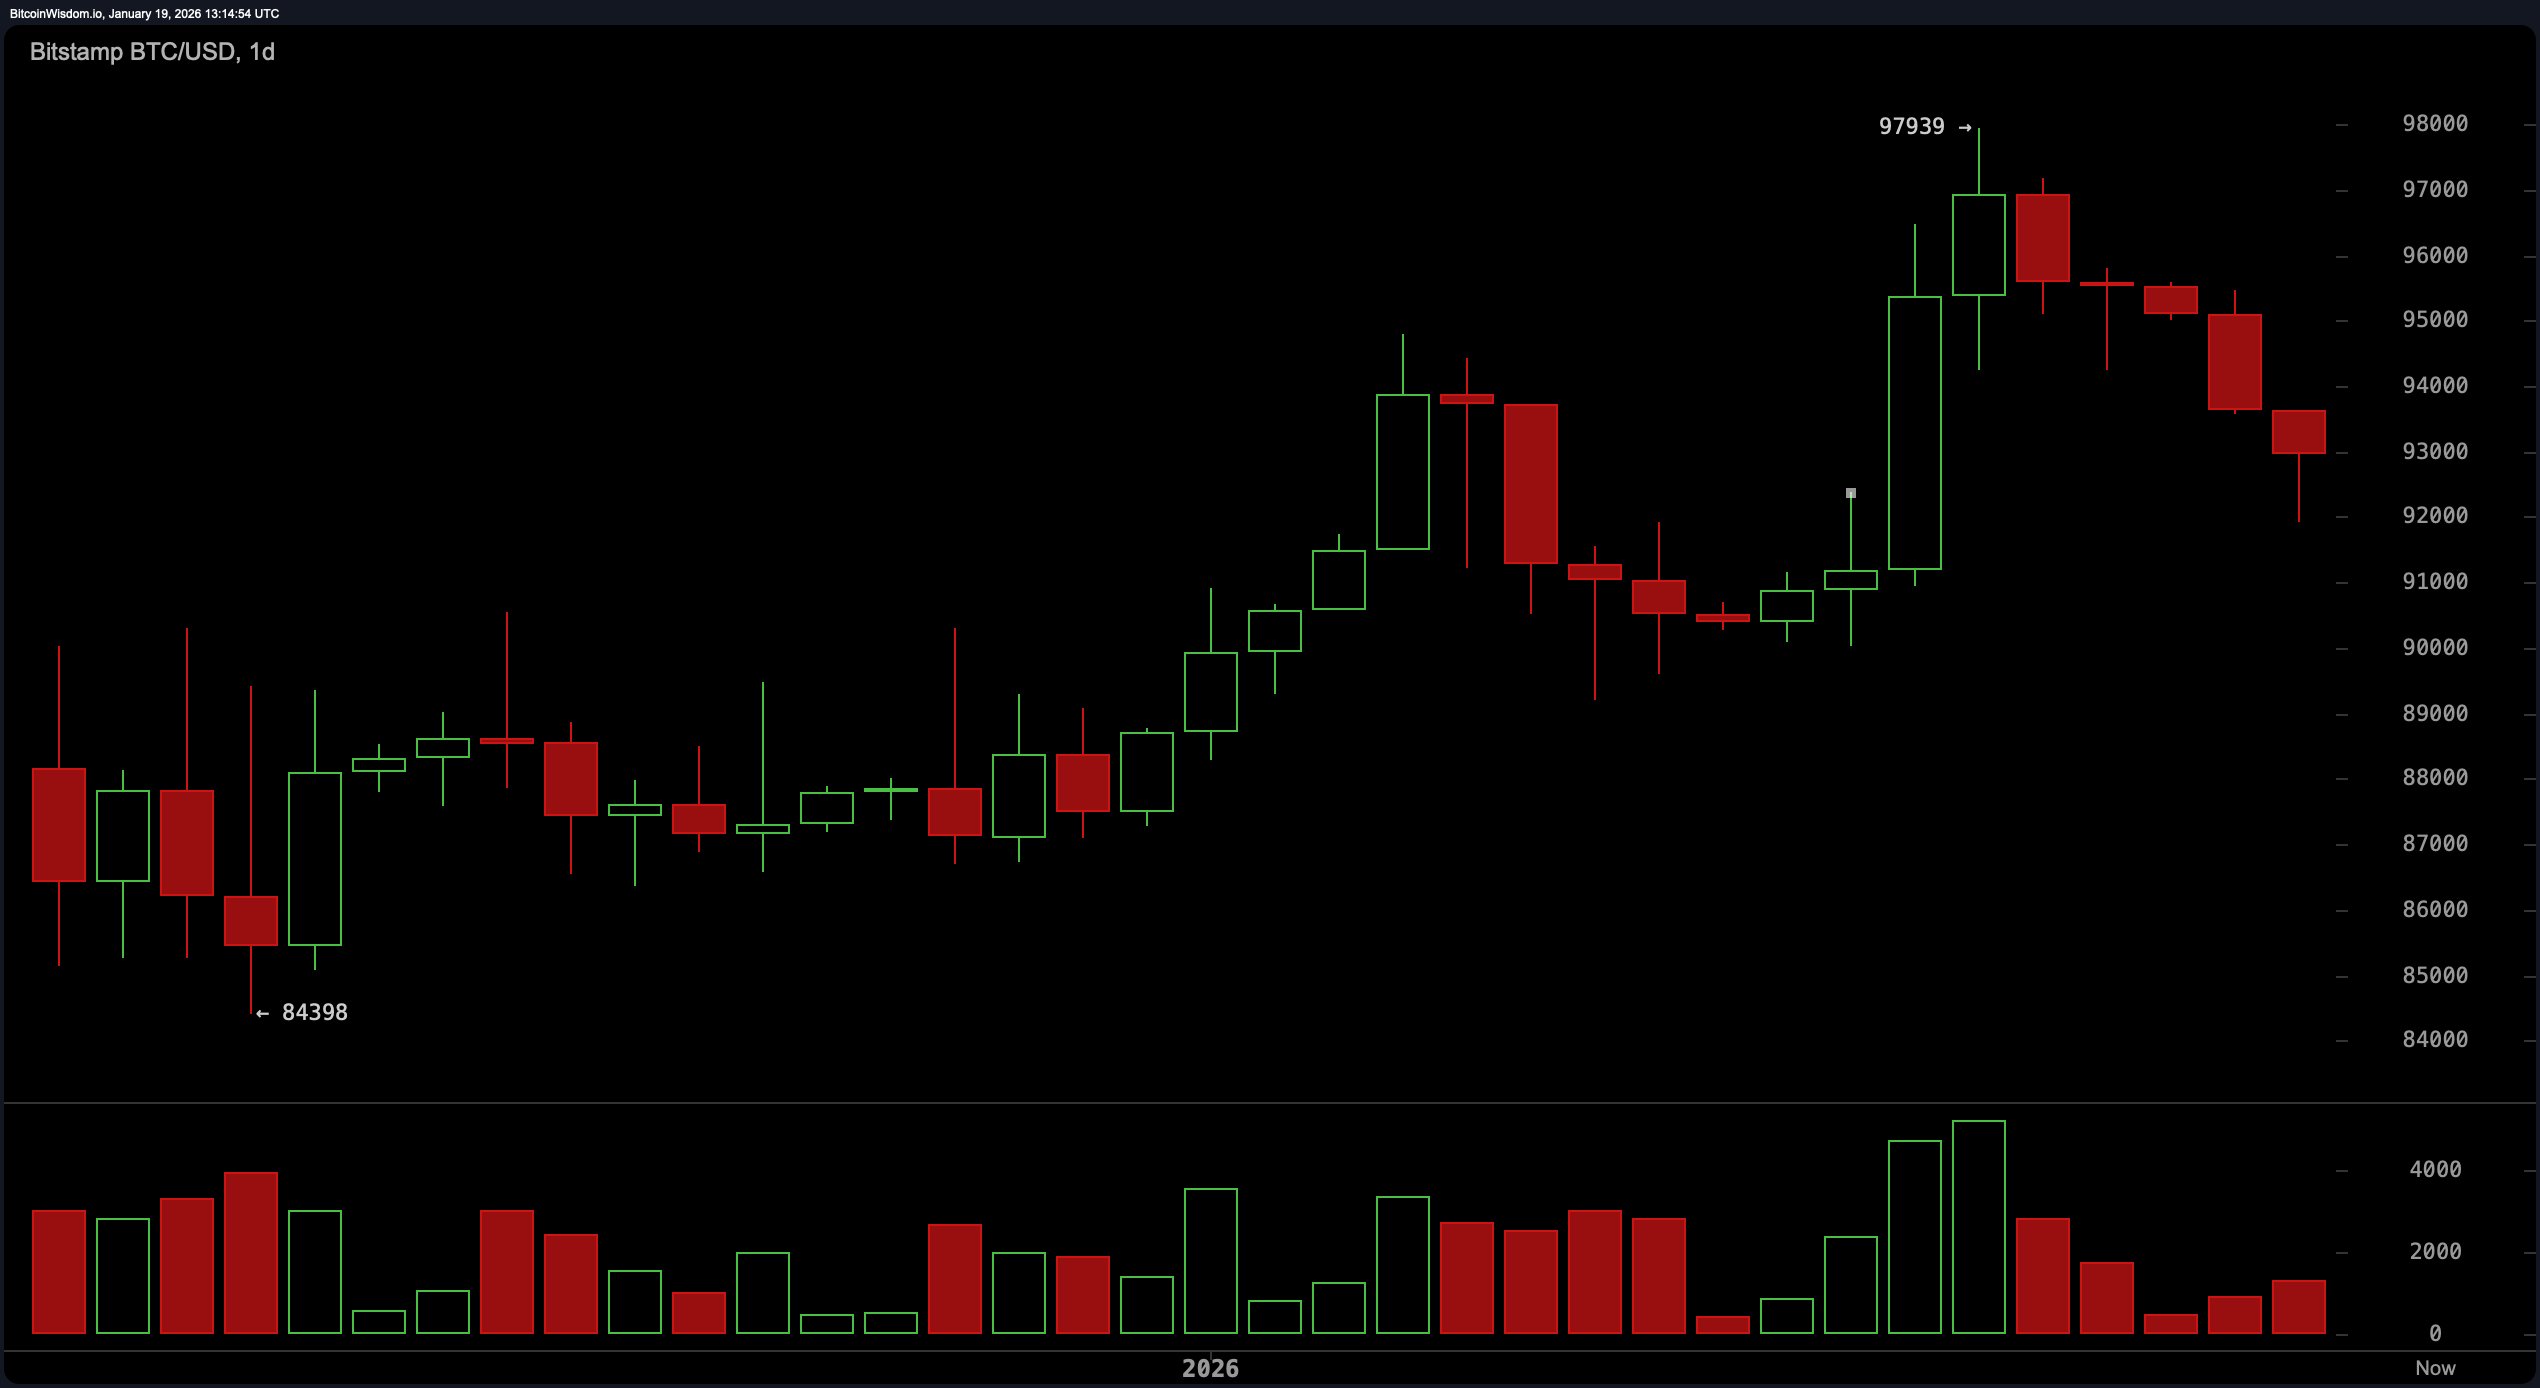
After a euphoric rally that climaxed near $97,939, the daily chart is waving a yellow flag. Three successive red candles have stepped in to break the bullish fever, suggesting the party hats have been tucked away and a consolidation hangover is underway.
The support zone between $91,000 and $92,000 is holding the fort—for now. Still, the absence of bullish follow-through near the top confirms a textbook retracement phase, with resistance lurking in the $97,000 to $98,000 neighborhood.
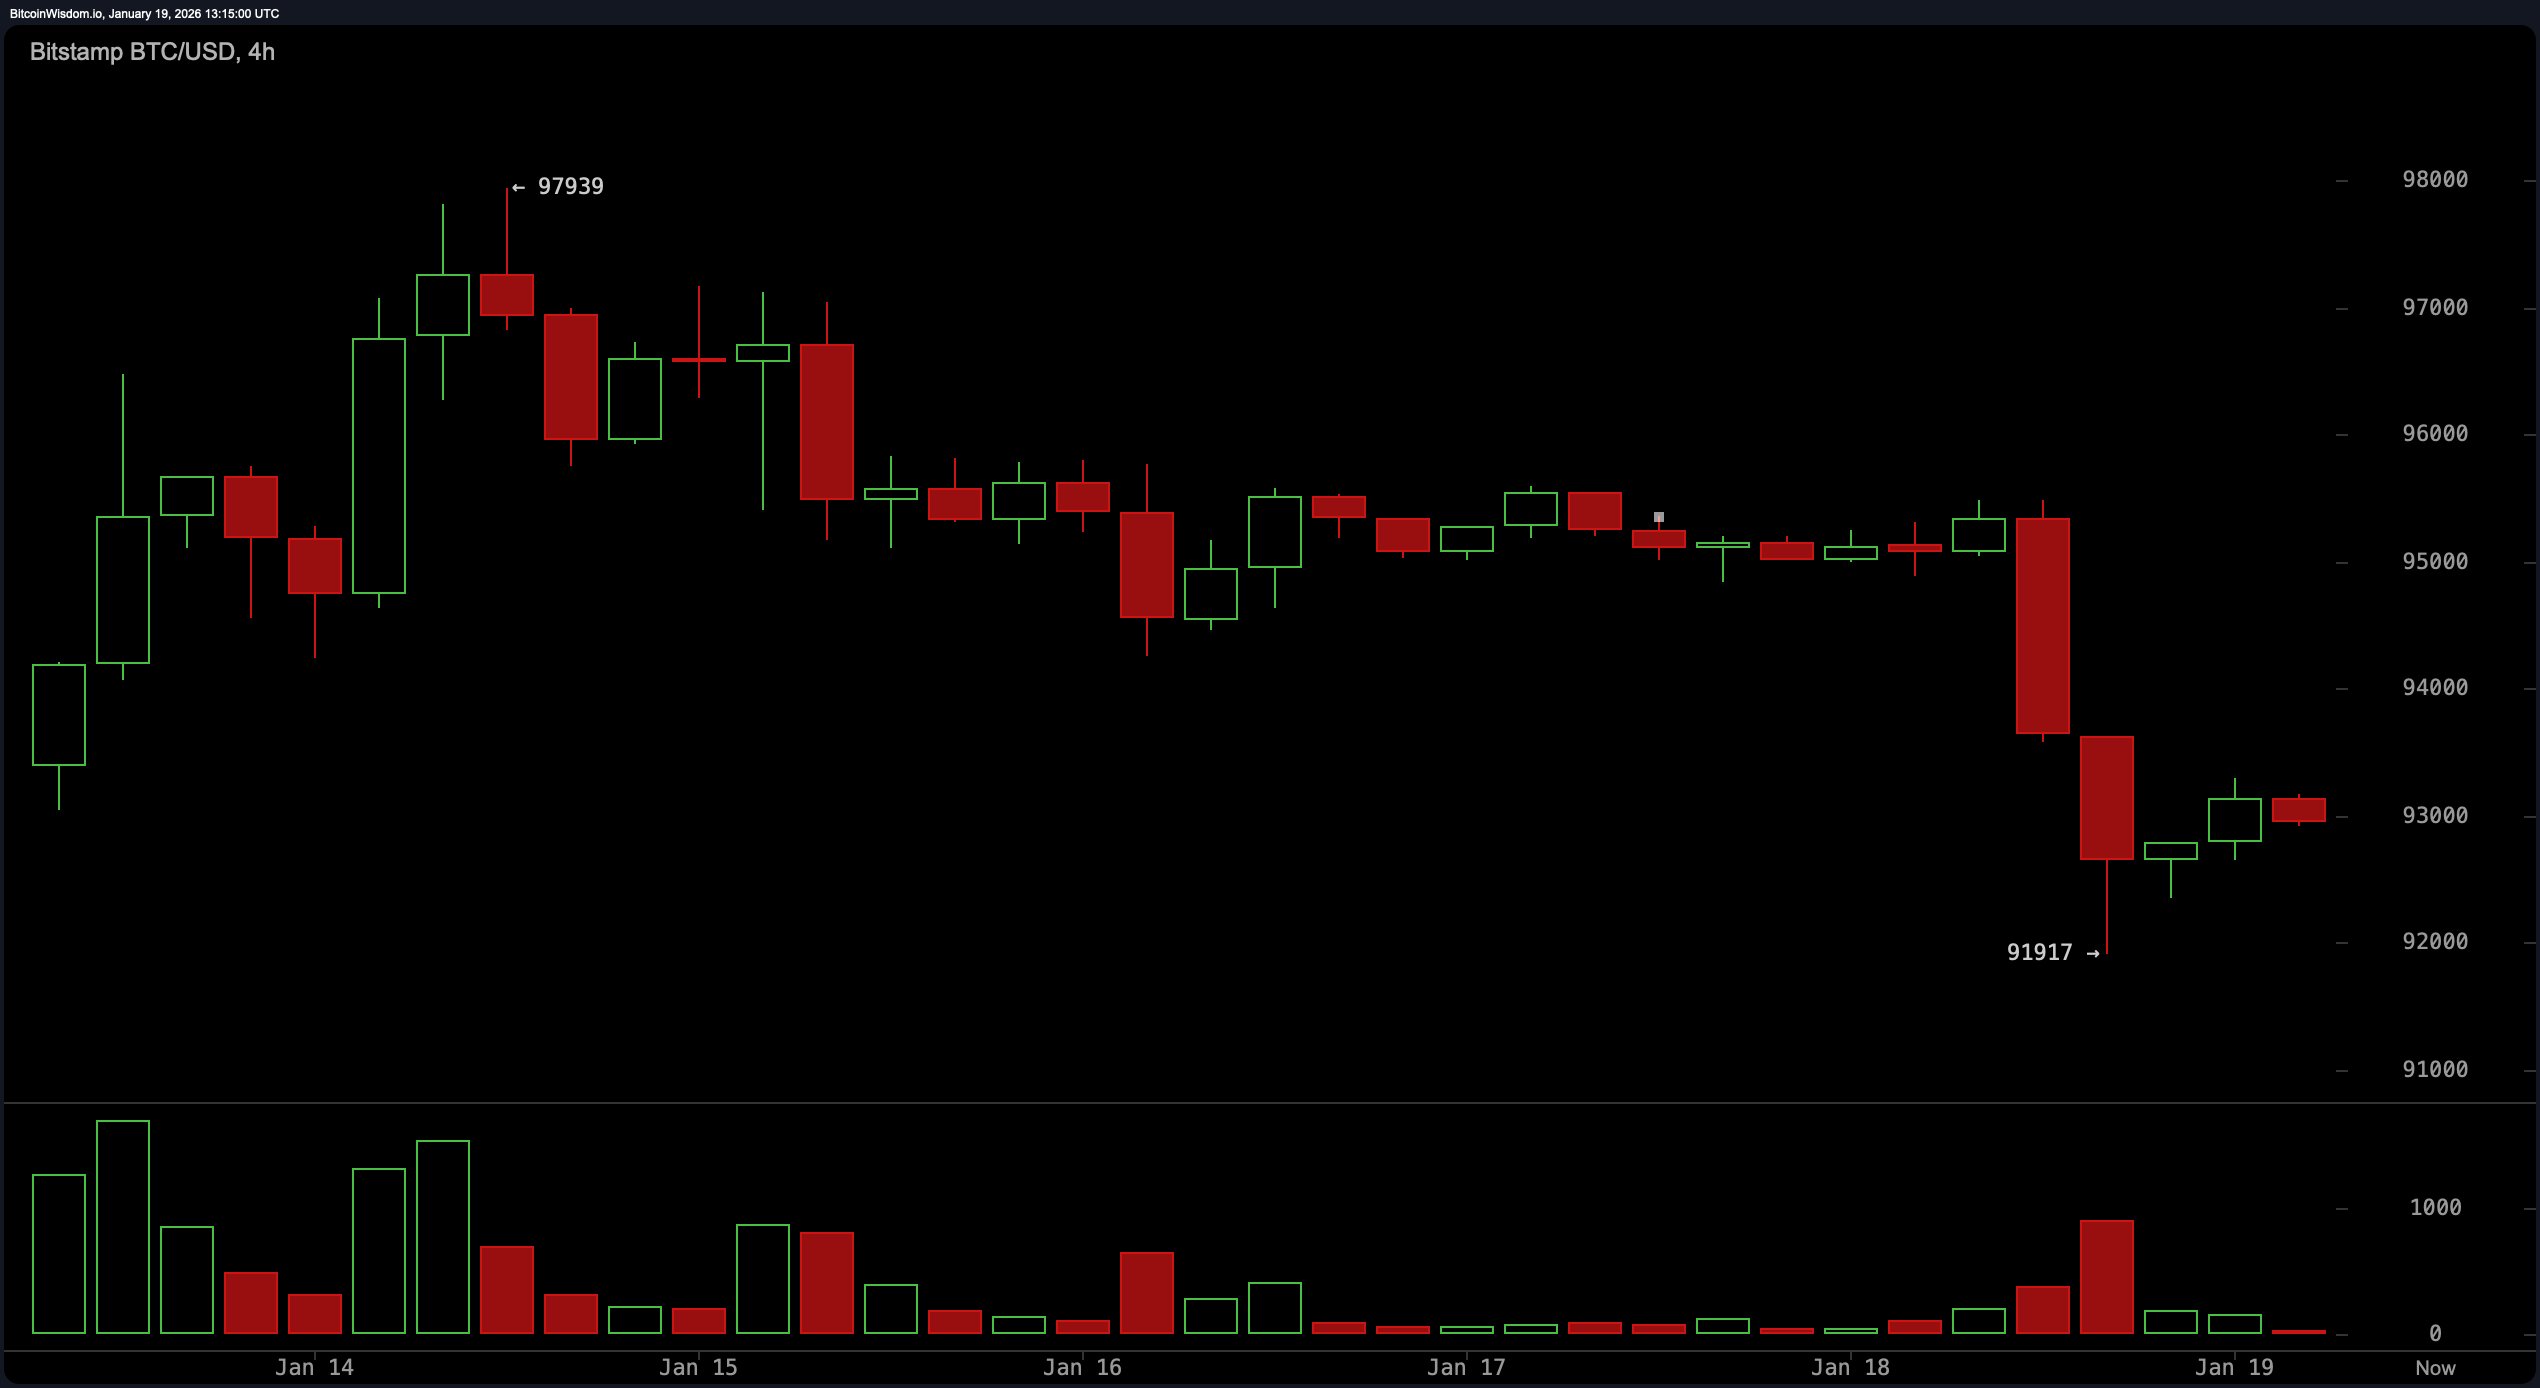
Zooming into the 4-hour chart, the storyline takes a more dramatic turn. A sharp drop from $95,480 to $91,917, accompanied by a burst of volume, makes one thing clear: sellers were not just exiting—they were stampeding. What followed were some hesitant green candles attempting a comeback, yet their frailty suggests more of a dead cat bounce than a rousing bullish resurgence. Price action hovering near $93,000 has the aura of a stalemate, with neither camp willing to make the next aggressive move.
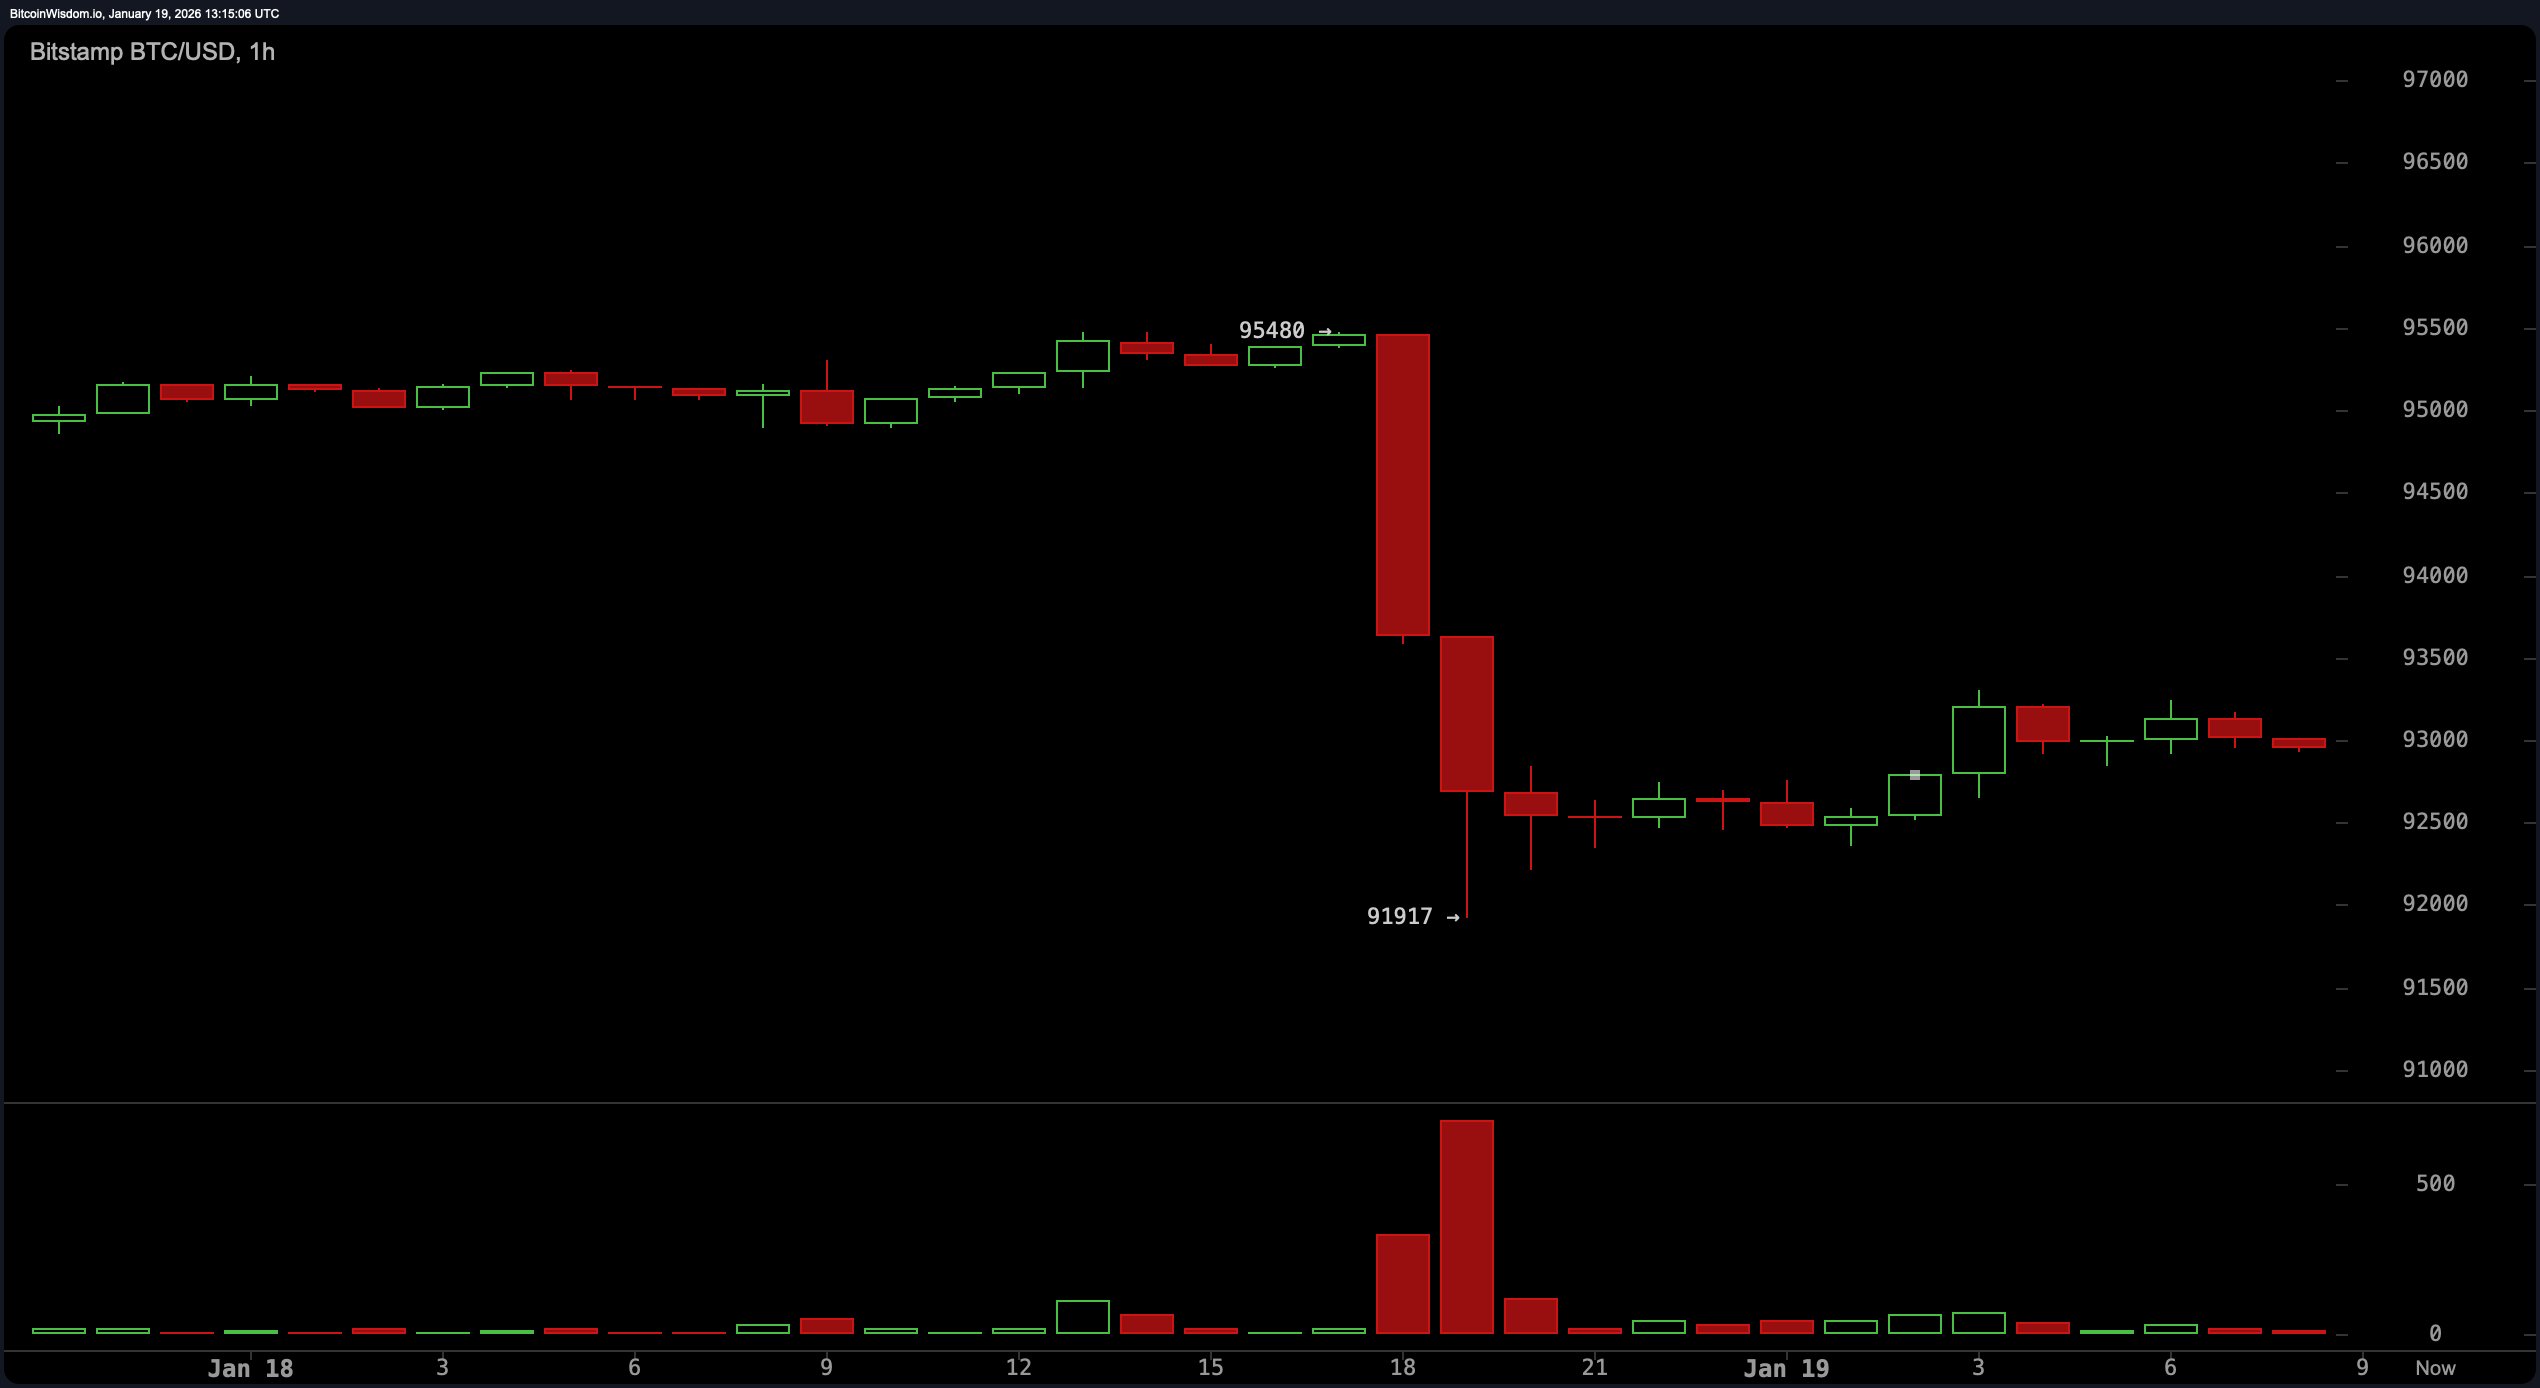
The 1-hour chart doesn’t sugarcoat things either. It displays a clean breakdown, where two red candles delivered a swift liquidity flush. What little recovery that followed has the texture of a truce rather than a triumph. Momentum has notably cooled, and volatility has settled into a lull, signaling the potential birth of a consolidation range. Traders are now in waiting mode—eying either a break above $94,000 or a slip below $91,000 to set the next act in motion.
Oscillator readings echo this indecision. The relative strength index ( RSI) at 53 and the Stochastic at 54 both suggest neutral momentum, while the momentum oscillator at 2,470 is tilting bearish. The moving average convergence divergence ( MACD) level, however, sits at 1,287 in bullish territory—because nothing in crypto can be straightforward. Meanwhile, the average directional index (ADX) at 33 indicates that trend strength is moderate but not convincing. It’s a cocktail of mixed signals, where traders must bring their own judgment.
As for moving averages (MAs), they’re practically arguing at a family reunion. Short-term signals such as the exponential moving average (EMA) 10 and simple moving average (SMA) 10 are bearish, while mid-range support shows strength—EMA 20, SMA 20, and even the EMA 30 all lean bullish. Yet the higher time frame averages, like the EMA 100 at $95,857 and the SMA 200 at a lofty $105,734, are still casting a long bearish shadow. This split in sentiment between the short and long game reflects a market unsure whether to dig in or bolt.
Bottom line? Bitcoin may be down from its recent highs, but it’s far from out. For now, the charts are whispering, not shouting, so traders should keep their ears to the ground and their stops tight.
Bull Verdict:
If bitcoin can hold the $91,000–$92,000 support zone and push past $94,500 with conviction, the bulls may yet have gas in the tank for another run toward $97,000 and beyond. The mid-range moving averages and the moving average convergence divergence ( MACD) support a potential upward continuation, assuming volume joins the party. Just don’t expect a smooth ride—this bull prefers rocky trails over paved roads.
Bear Verdict:
Should bitcoin fail to defend the $91,000 floor, the market may be bracing for a deeper correction toward $88,000 or even $85,000. Momentum is waning, several key moving averages remain in bearish alignment, and the 1-hour and 4-hour charts tell a tale of exhausted buyers. For now, the bears are circling—waiting for the next sign of weakness to pounce.
FAQ ⏱️
- What is bitcoin’s current price today? Bitcoin is trading at $92,970 as of January 19, 2026.
- Is bitcoin bullish or bearish right now? Bitcoin shows mixed signals, with short-term weakness and mid-term support strength.
- What is bitcoin’s price support level?Key support lies between $91,000 and $92,000.
- Where is bitcoin’s next resistance?Major resistance zones are at $95,500 and $97,500.