Bitcoin faces pressure at key support levels as liquidations rise, with geopolitical tensions and market volatility influencing price action.
The recent Bitcoin ($BTC) slide, tumbling more than 2.7% to around $92,570, has grabbed the market’s attention as geopolitical tensions intersect with crypto volatility. The sell‑off was primarily triggered by new Trump tariffs on eight European countries linked to the Greenland standoff, which spiked risk aversion among traders and compelled short‑term holders to reduce exposure.
Over the past week, Bitcoin’s performance has reflected this nervous sentiment, with price up only 0.9% over 7 days despite short spikes, and a more modest 0.3% gain in the last 14 days. While the 24‑hour drop stands out, the short‑term trend shows that Bitcoin has struggled to sustain upside momentum amid broader economic uncertainty.
The interaction of macroeconomic forces like tariffs, global trade tensions, and investor risk appetite will continue shaping price action in the days ahead. Where’s $BTC headed?
Bitcoin Price Analysis
A chart from TradingView showcases Bitcoin’s recent price action, using the Bollinger Bands and Average True Range as key indicators. Bitcoin’s price has dropped to test the middle line of the Bollinger Bands, which is the 20-day simple moving average, signaling a potential bearish trend.
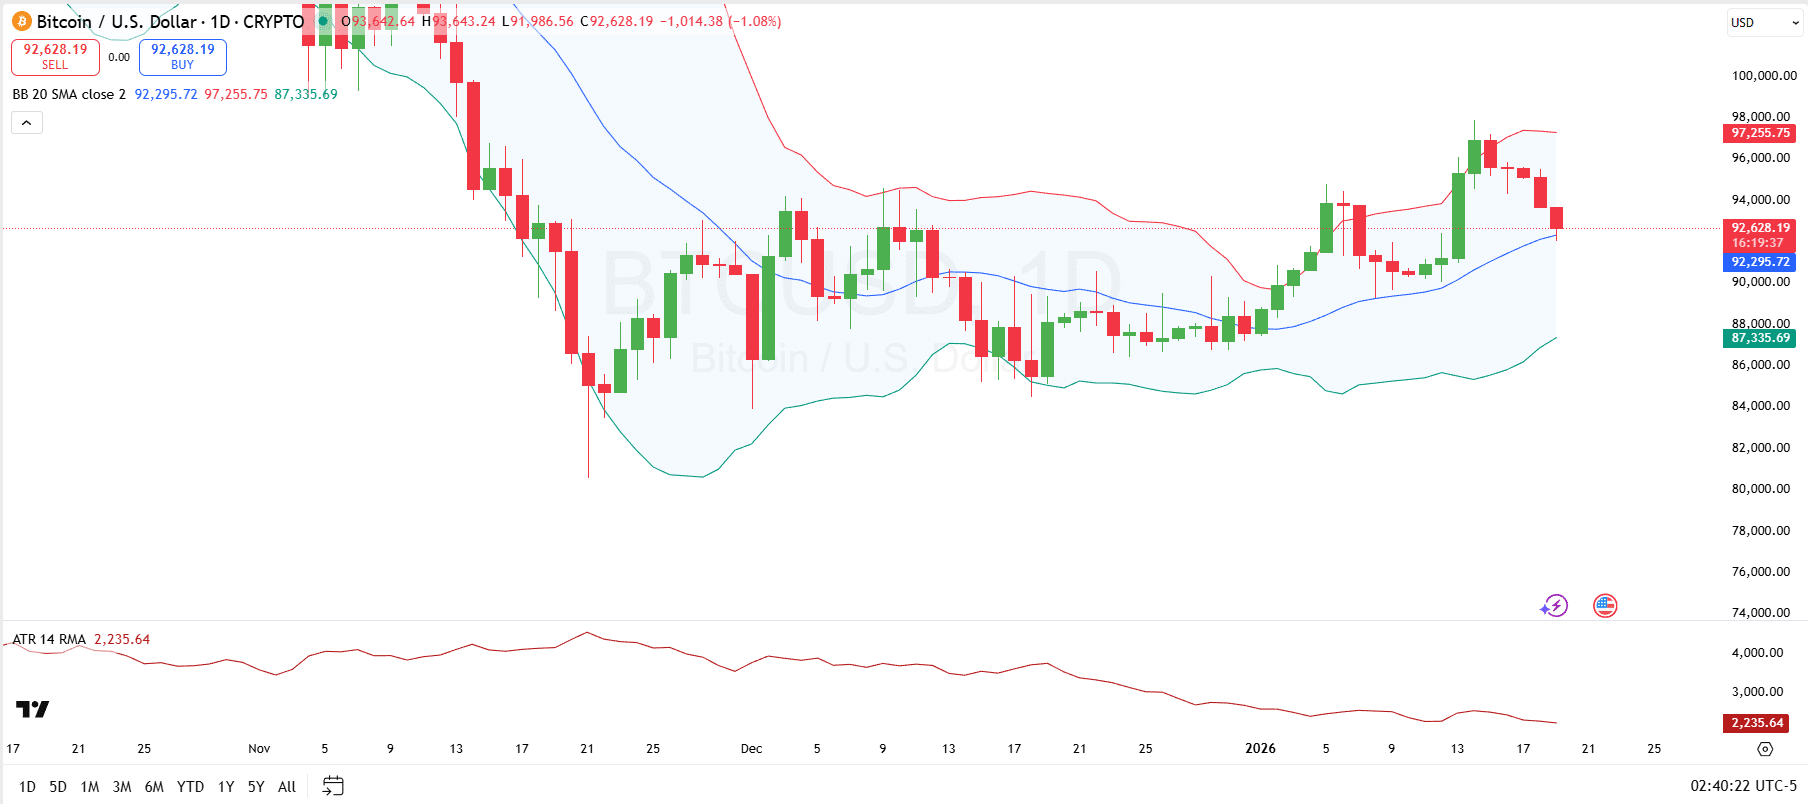
This suggests that Bitcoin is facing increased selling pressure, and there could be a further dip toward the $92,000 level or lower, with the next support appearing at the $87,335 level. On the resistance side, Bitcoin faces significant hurdles around the $97,255 level, marked by the upper boundary of the Bollinger Bands. This level could act as a strong resistance if the price attempts a reversal or bounce from current levels.
Looking at the ATR, currently at 2,235.64, this indicates declining volatility in the market. A lower ATR suggests that Bitcoin is experiencing smaller price movements within each trading day. If the ATR continues to fall, it generally indicates a decrease in market volatility, meaning that Bitcoin could experience less erratic price action.
Bitcoin Liquidation Data
The Bitcoin market rally observed recently appears to have lacked substantial backing from leveraged positions and whale activity, as highlighted by the liquidation data. In the 1-hour timeframe, over $192.66K in liquidations occurred, with the short positions leading the charge at $190.51K. Meanwhile, the long positions only saw a modest liquidation of $2.16K.
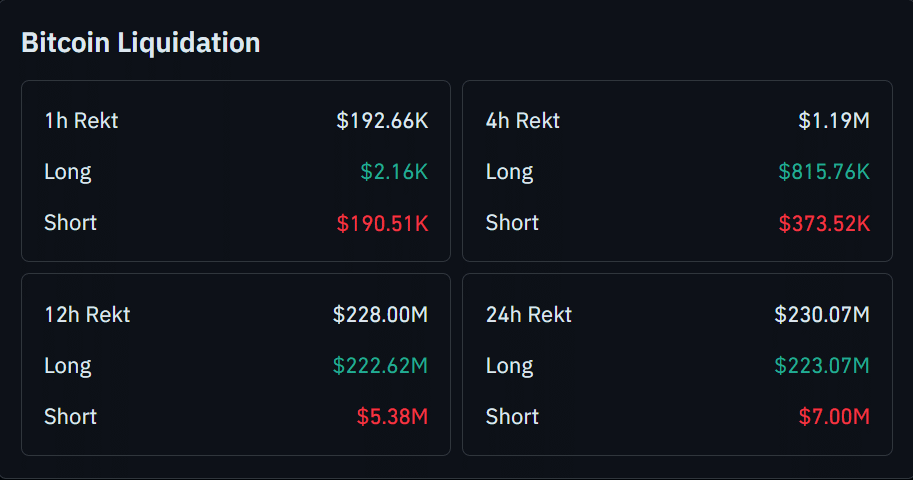
Examining the 24-hour and 12-hour liquidation data, the market exhibits a similar pattern. A significant portion of the liquidation came from short positions, with $222 million in long liquidations over the 12 hours, compared to just $5.38 million in short liquidations. The 24-hour data further confirms this, with $230.07M in total liquidations, again heavily skewed toward long positions.