
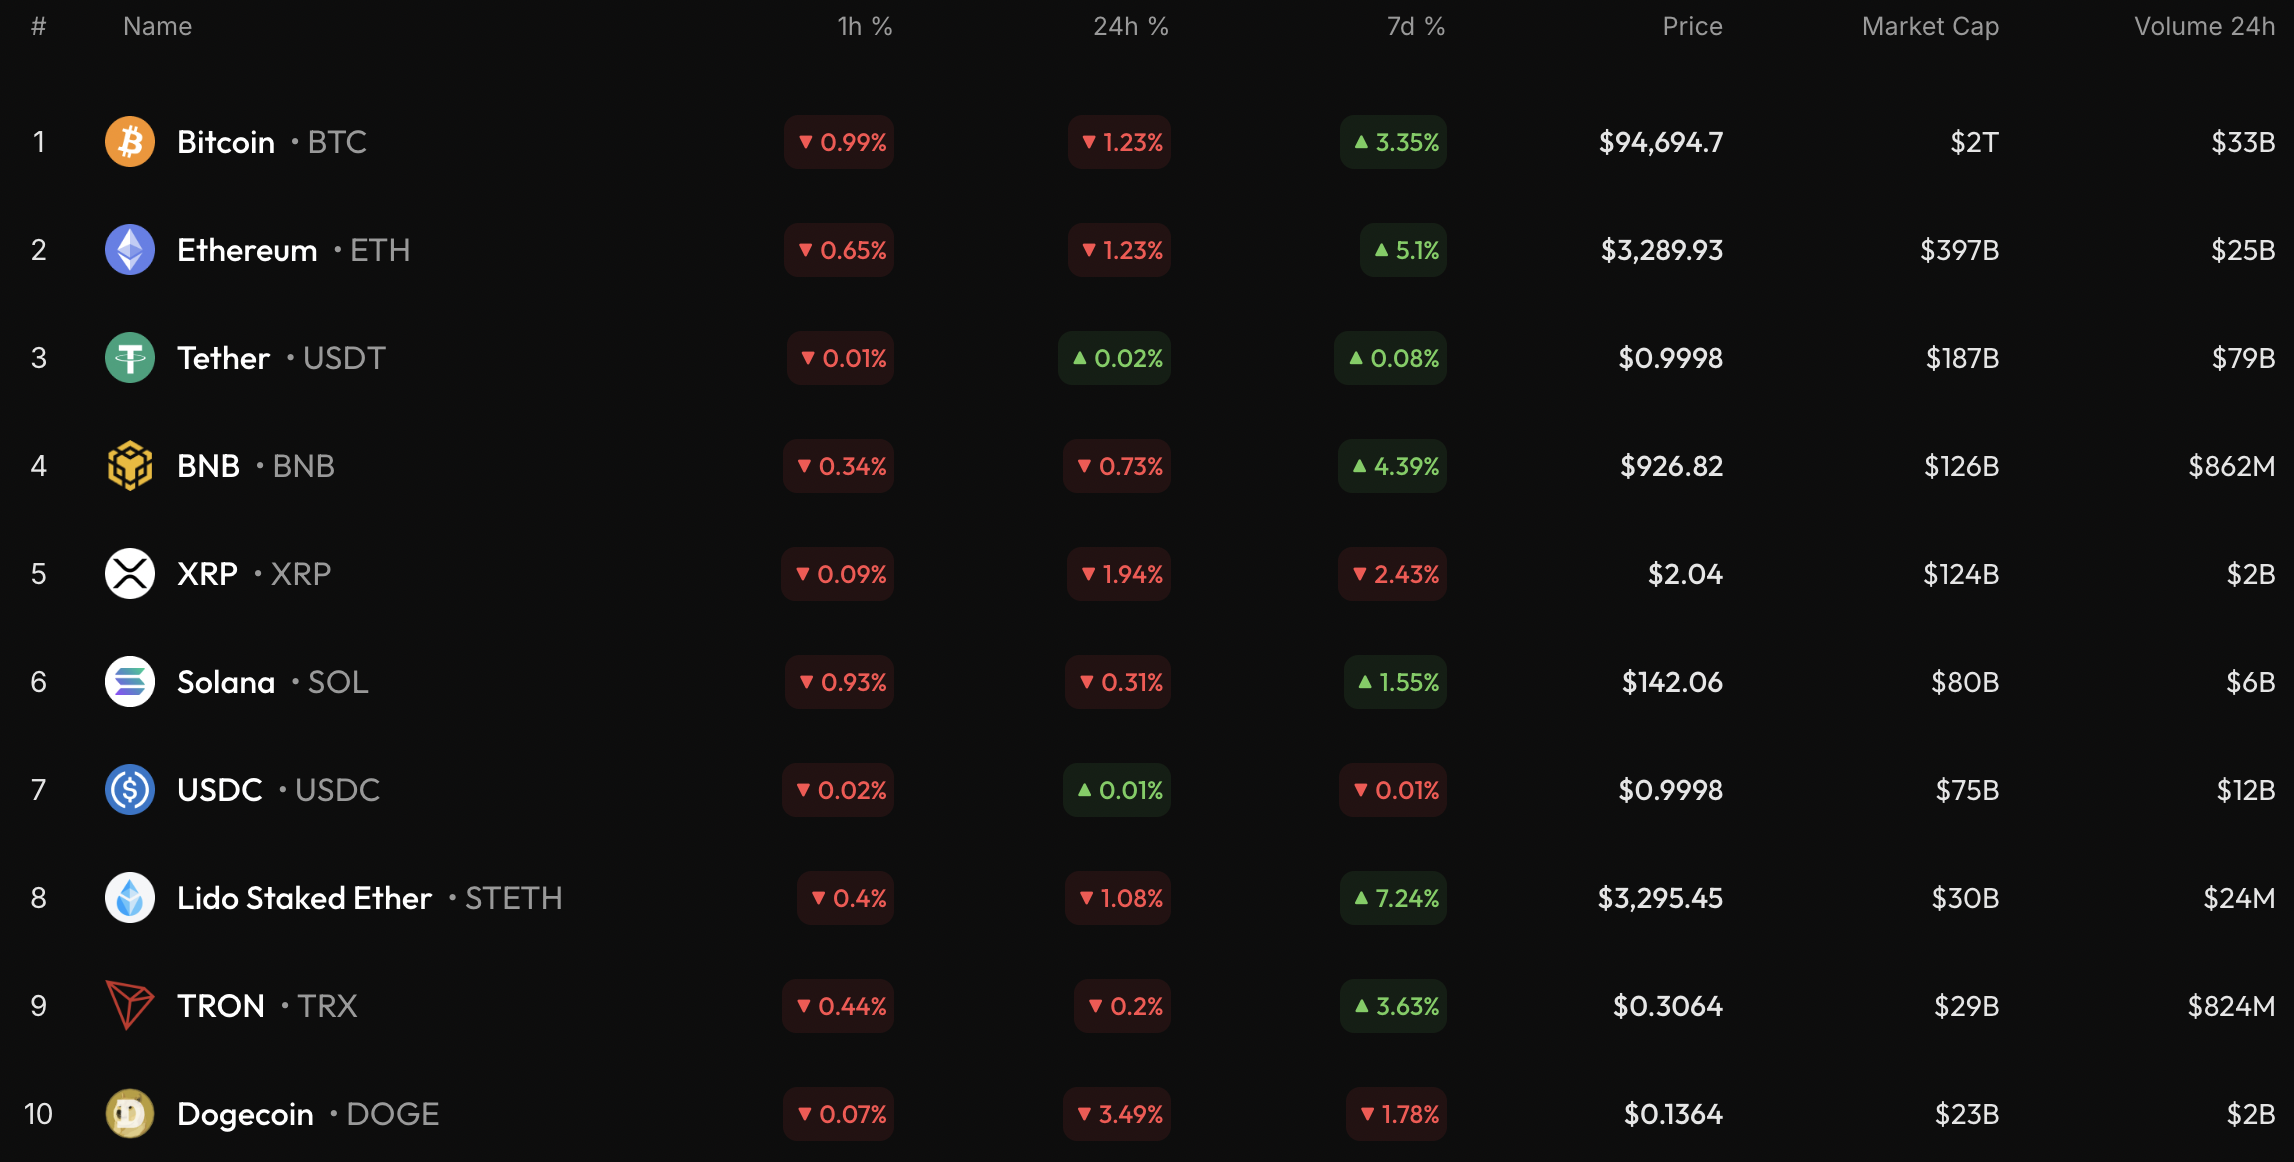
Most of the coins are in the red zone today, according to CoinStats.
$BTC/USD
The rate of Bitcoin ($BTC) has declined by 1.23% over the last 24 hours.
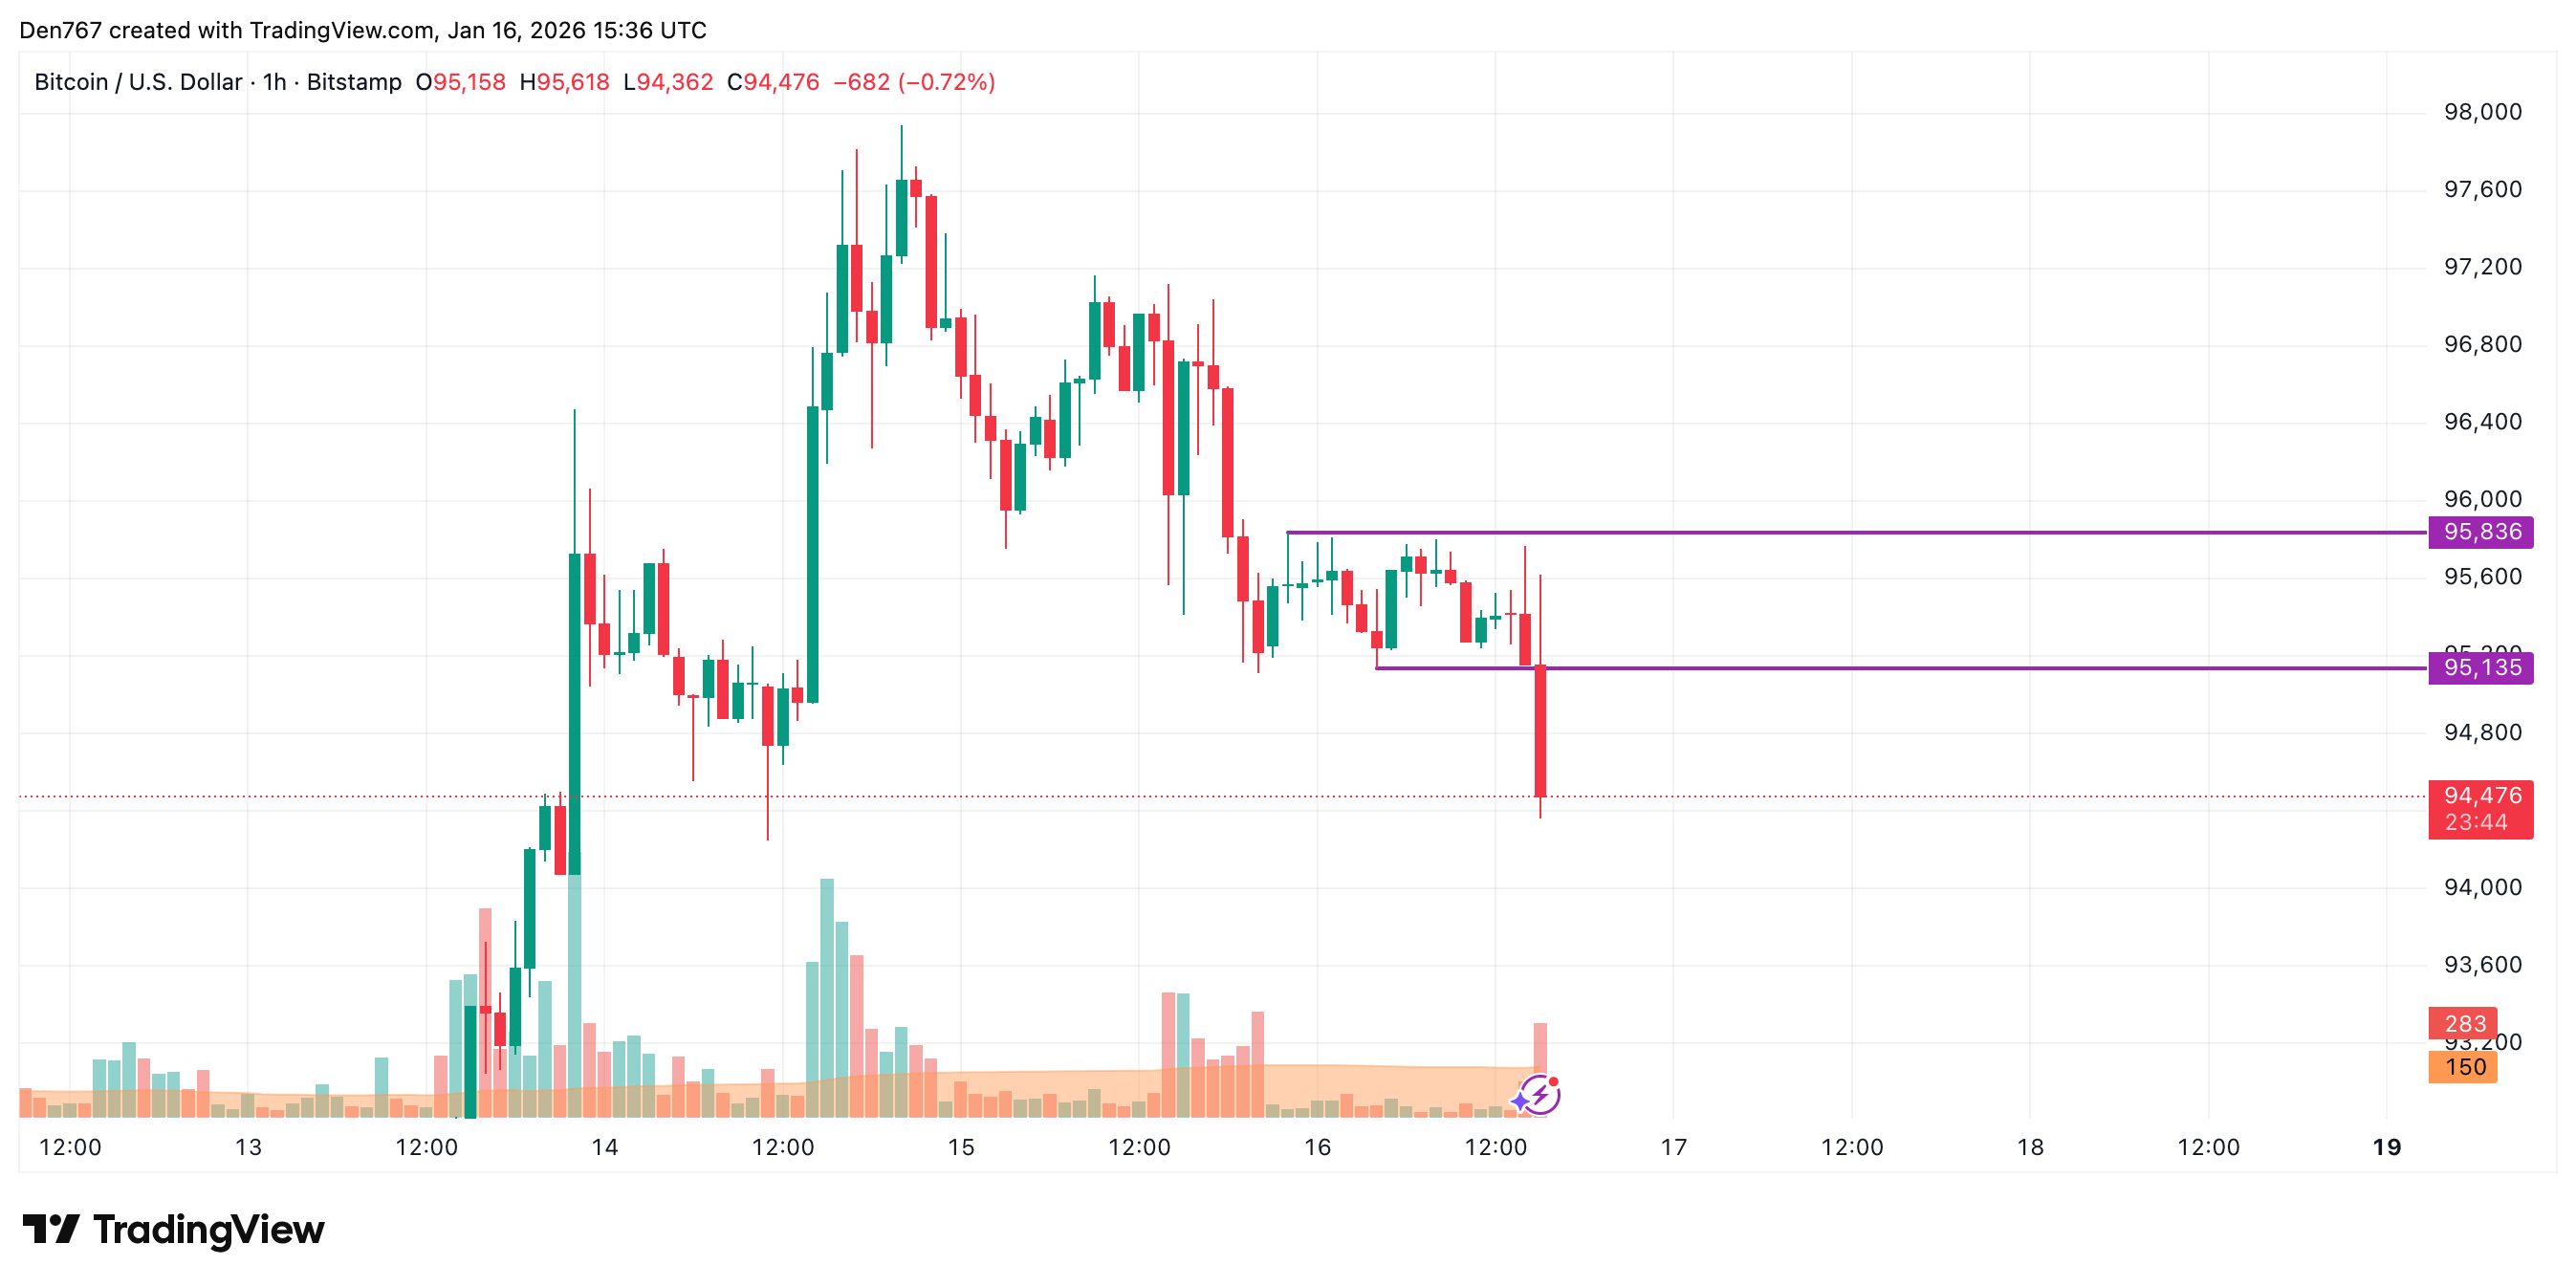
On the hourly chart, the price of $BTC is going down after a breakout of the local support at $95,135. If the daily bar closes far from that mark, traders may witness a further drop to the $94,000 zone tomorrow.
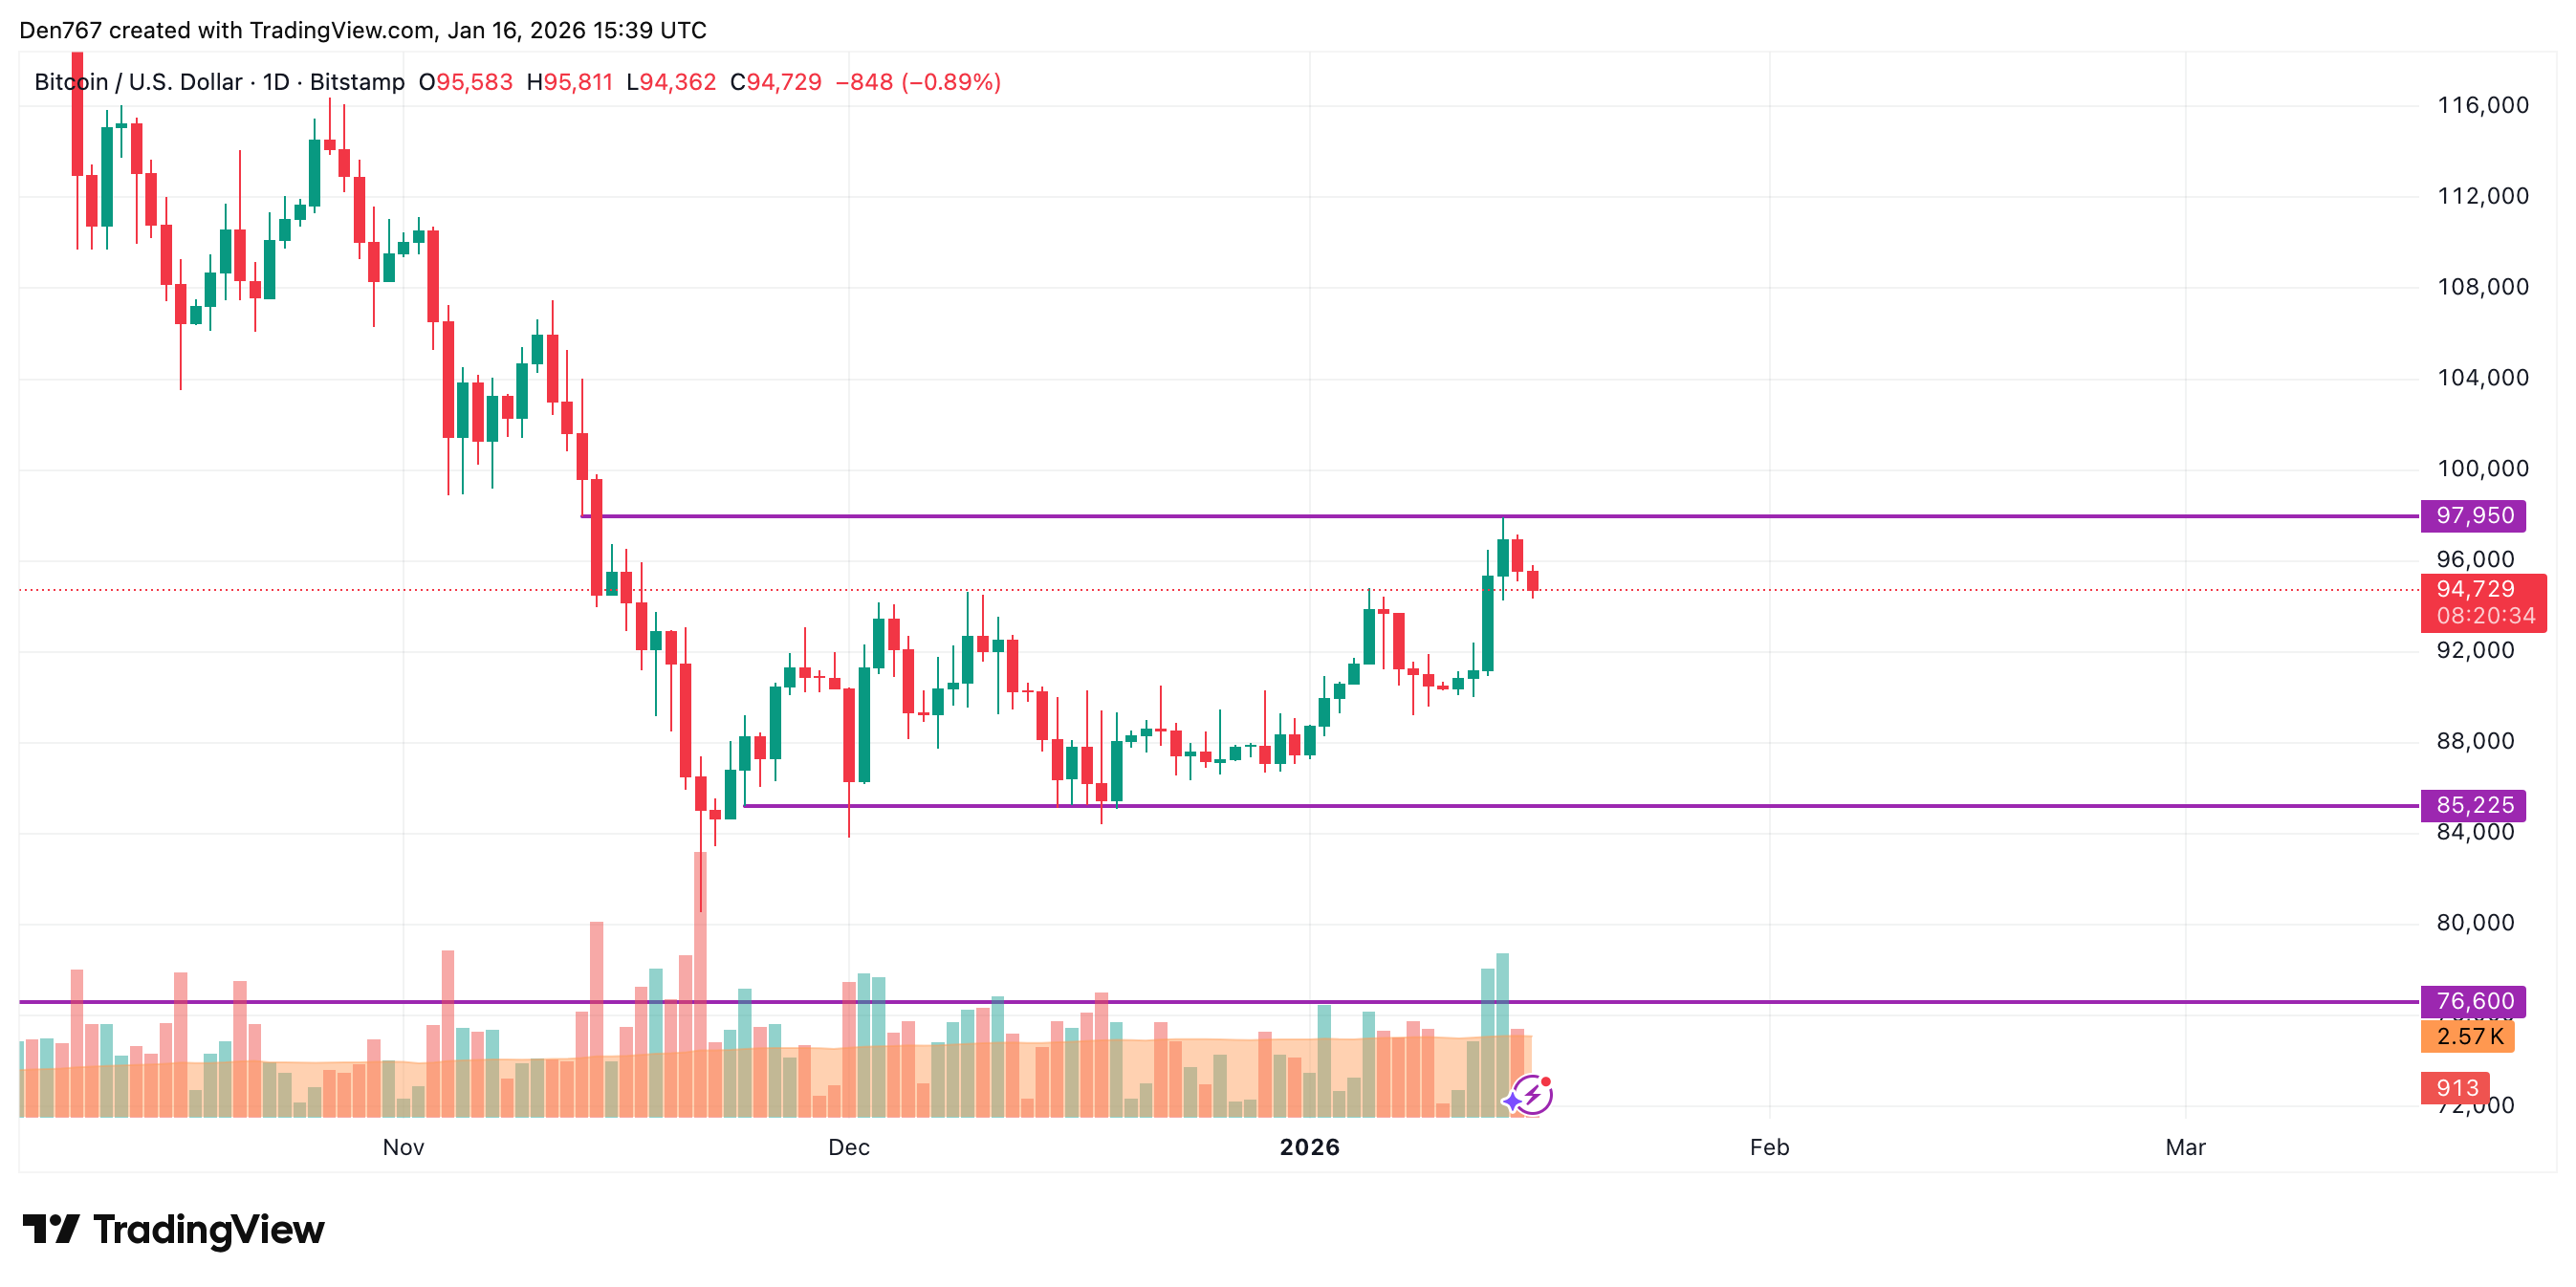
On the longer time frame, the rate of $BTC keeps declining after yesterday's bearish closure.
If the bar closes near its low, there is a high chance of seeing a test of the $93,000-$94,000 range by the end of the week.
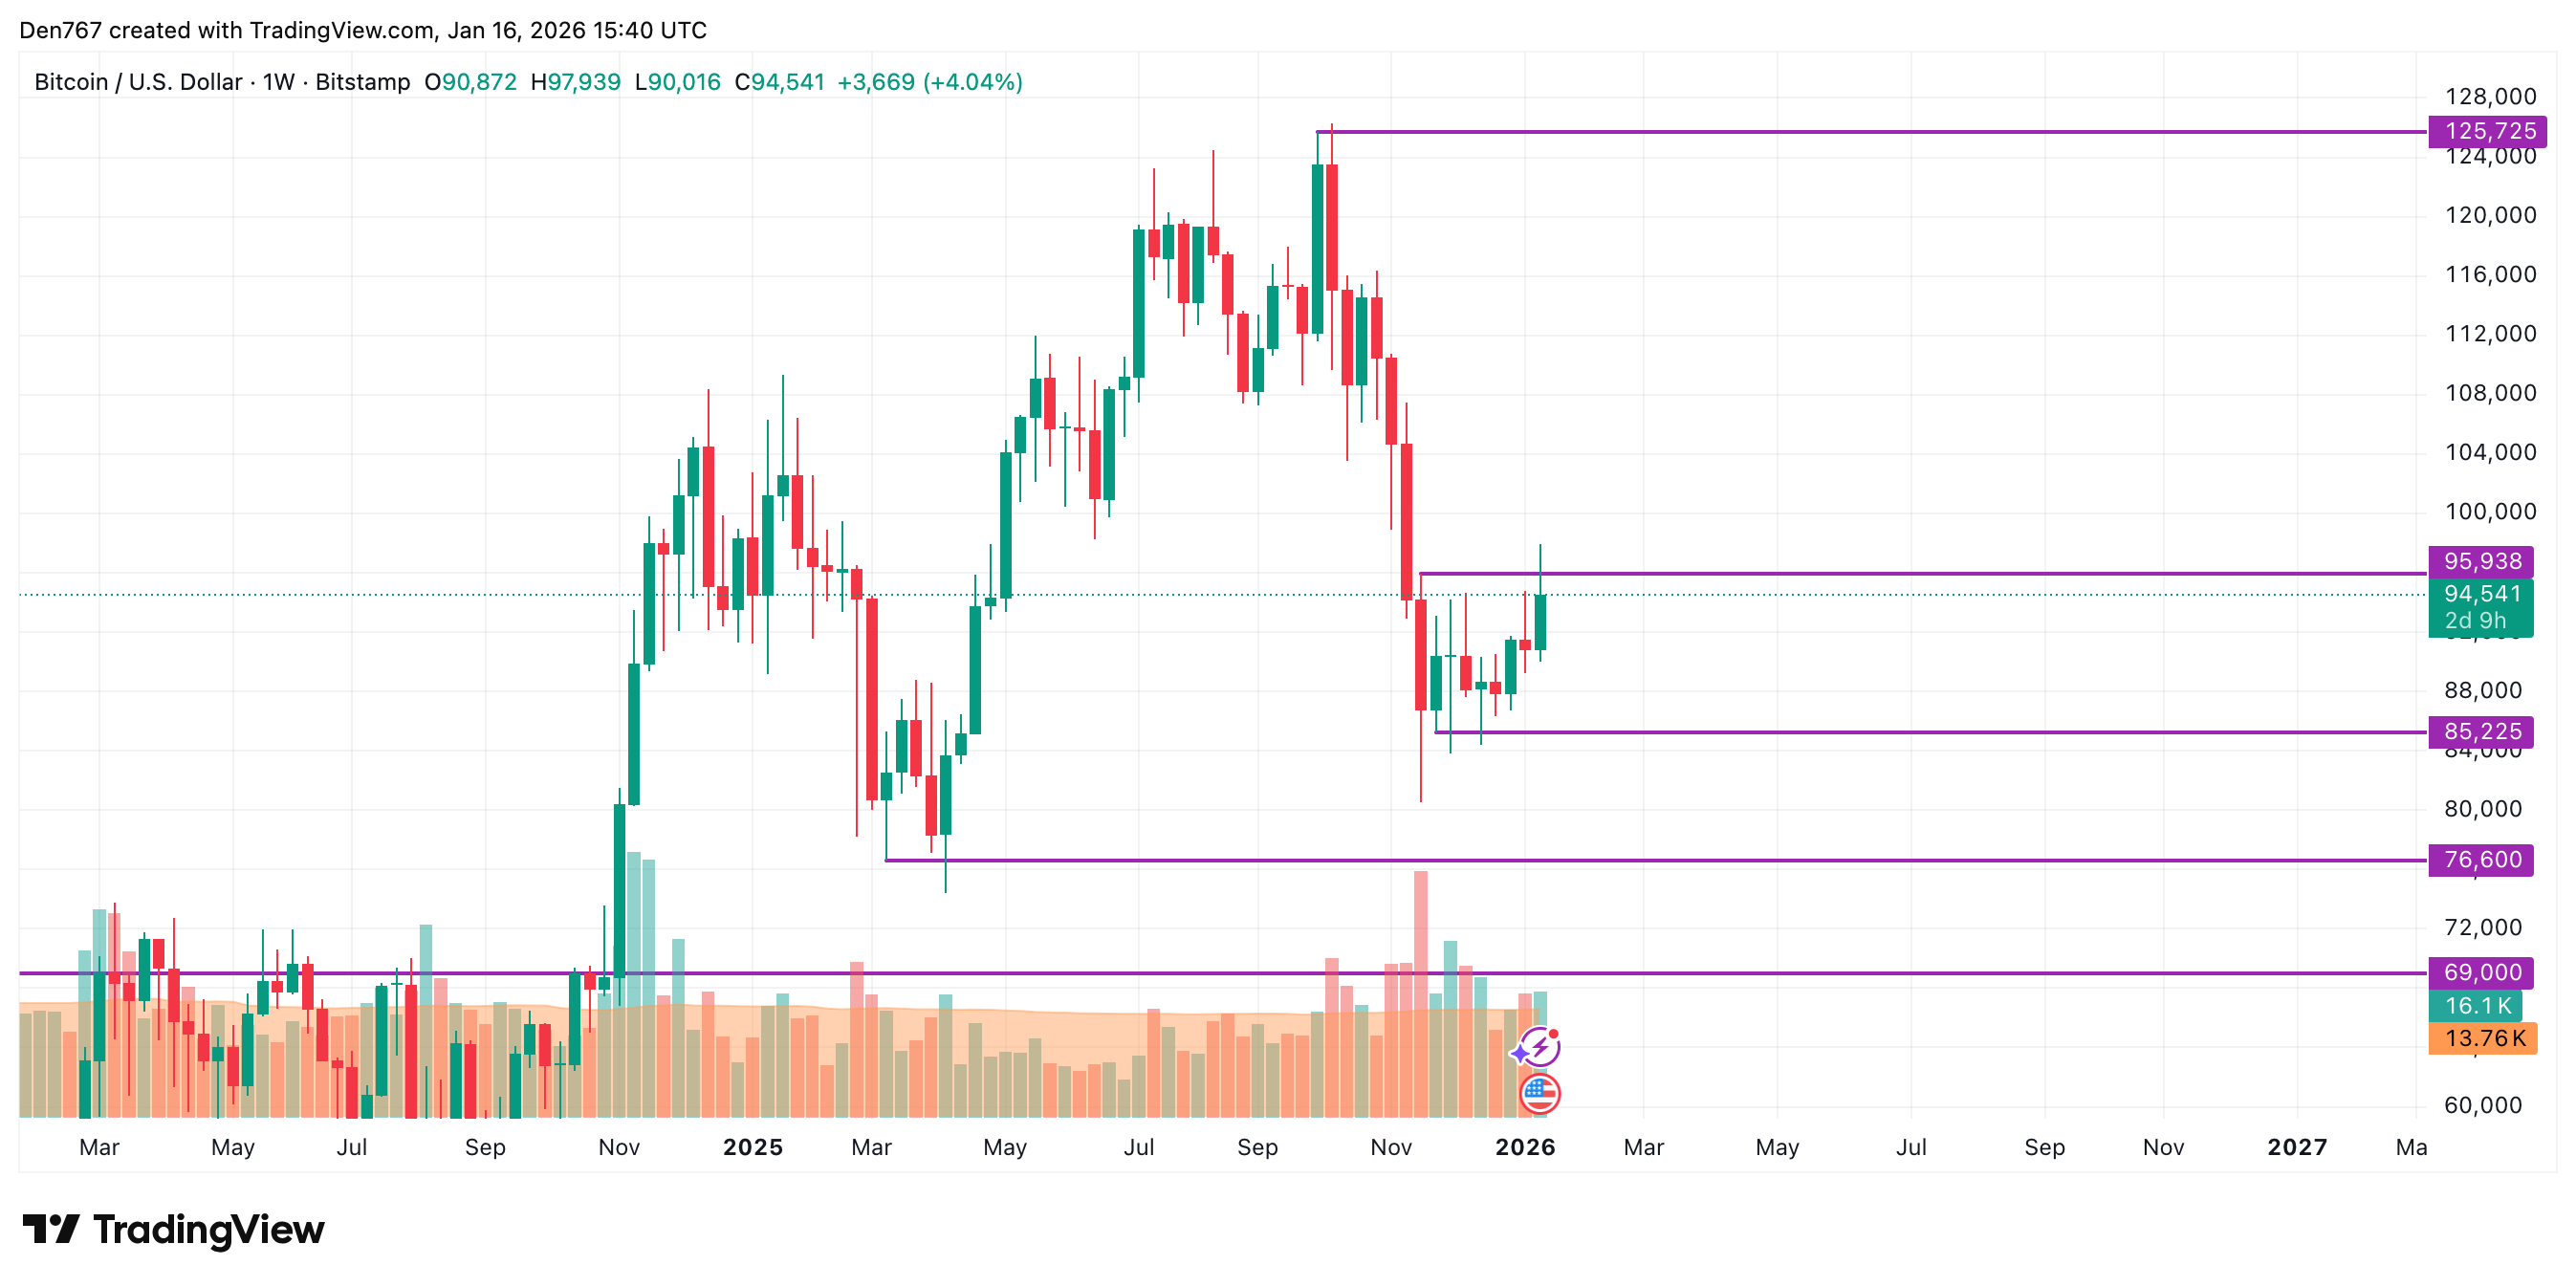
From the midterm point of view, one should pay attention to the weekly bar's closure in terms of the $95,938 level. If it happens far from it, bears may seize the initiative, which might lead to a decline to the $90,000-$92,000 range.
Bitcoin is trading at $94,541 at press time.