Bitcoin is grinding higher into a heavy resistance pocket while spot supply on exchanges keeps shrinking. Structurally, that’s a bullish backdrop, but technically, the price is pressing right into an area where profit-taking is expected. Therefore, either the price breaks and holds above this ceiling, or a corrective pullback into the mid-range would occur.
Bitcoin Price Analysis: The Daily Chart
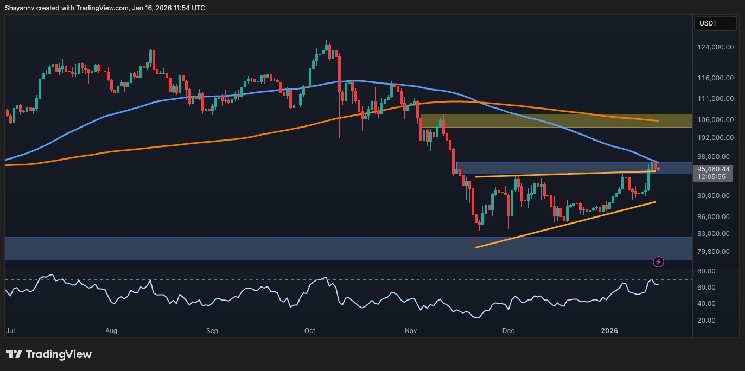
On the daily chart, $BTC has pushed back into the $95K resistance band, which lines up with the 100-day moving average. This is the same zone that rejected the asset on the previous bounces, so for now it still acts as a key supply area within the broader downtrend from the highs.
Daily RSI is also elevated but not at panic extremes anymore, signalling strong short-term momentum but still inside a larger corrective structure. As long as $BTC trades below the 100-day moving average and the $95k resistance block, the move is best treated as a counter-trend rally, not a confirmed new uptrend.
But in case the level breaks to the upside, a rally toward the $106K zone and the 200-day moving average located nearby would be expected, which could spark the beginning of a new, more prolonged bull run.
$BTC/USDT 4-Hour Chart
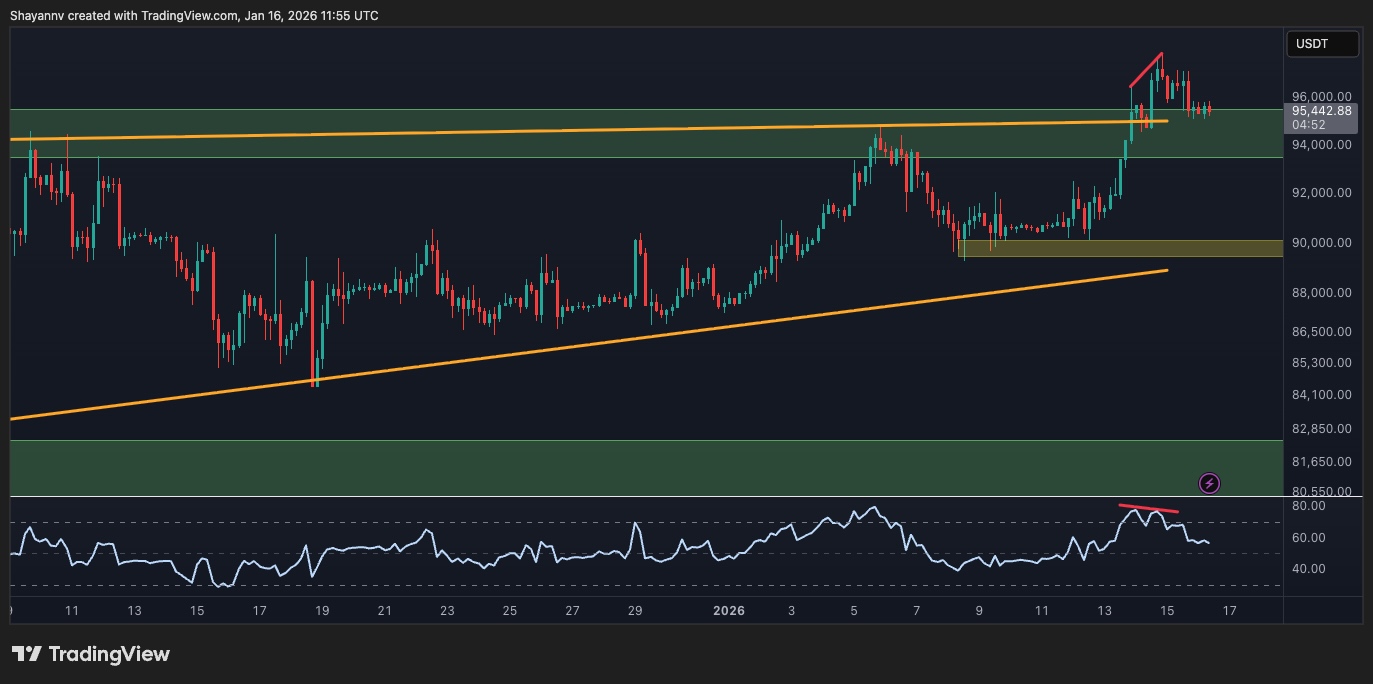
On the 4-hour chart, the price broke out from the ascending structure and is now consolidating right at the top of the pattern and at the higher-timeframe resistance. Momentum is clearly slowing: candles are getting smaller, and RSI has started to roll over from overbought after a bearish divergence, hinting at local distribution near the highs.
If buyers fail to defend the breakout area around $93K–$94K, a pullback toward the lower trendline of the pattern and the $90K region would be probable. Conversely, if $BTC can hold above $93K–$94K and build a base there, another push toward the $98K–$100K psychological level becomes realistic. Yet, buyers need quick follow-through, or the breakout risks turning into a fakeout.
On-Chain Analysis
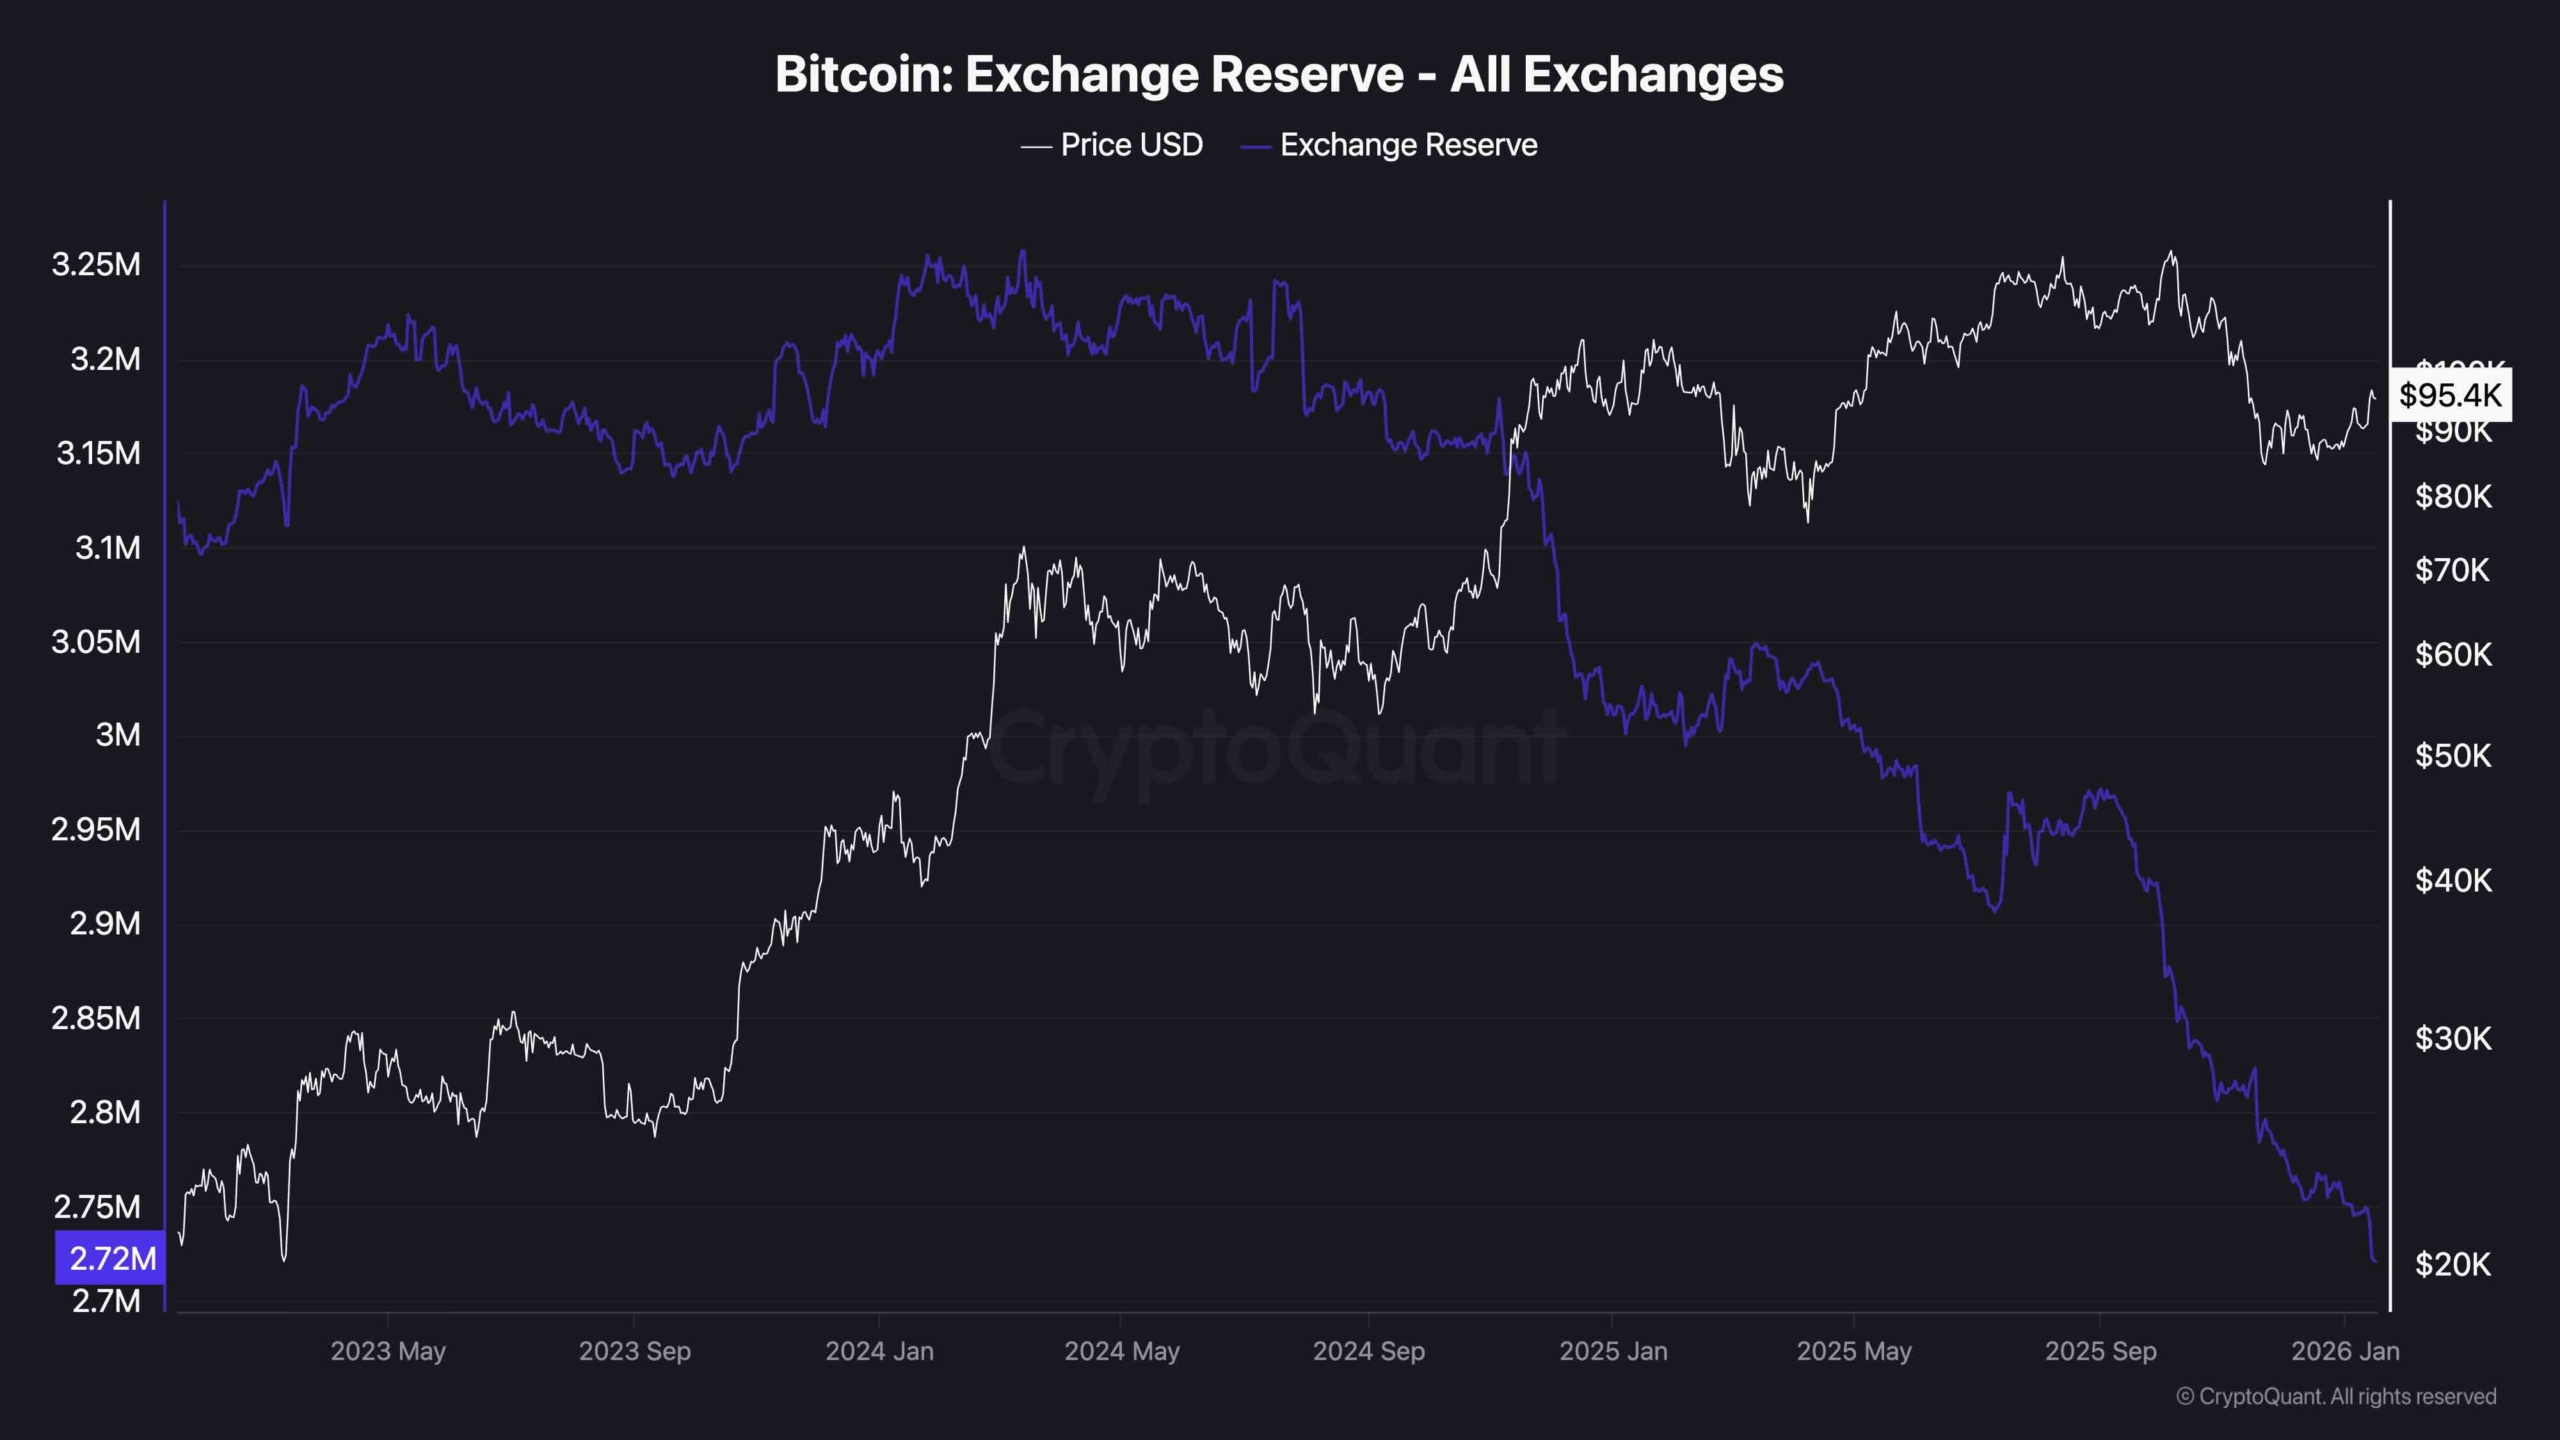
Exchange reserve data continues to trend lower while the price trades near the top of the local range. That means fewer $BTC are sitting on exchanges and more are in cold storage or strong hands, which is typically a constructive, supply-tight backdrop.
This does not prevent short-term corrections when the price is pressing into technical resistance, but it does argue that deeper dips into the $80K–$90K range are more likely to be bought than to trigger a full distribution top. Unless a sharp spike of $BTC flowing back to exchanges occurs, the on-chain picture still leans medium-term bullish even if the price experiences some near-term downside to reset momentum.