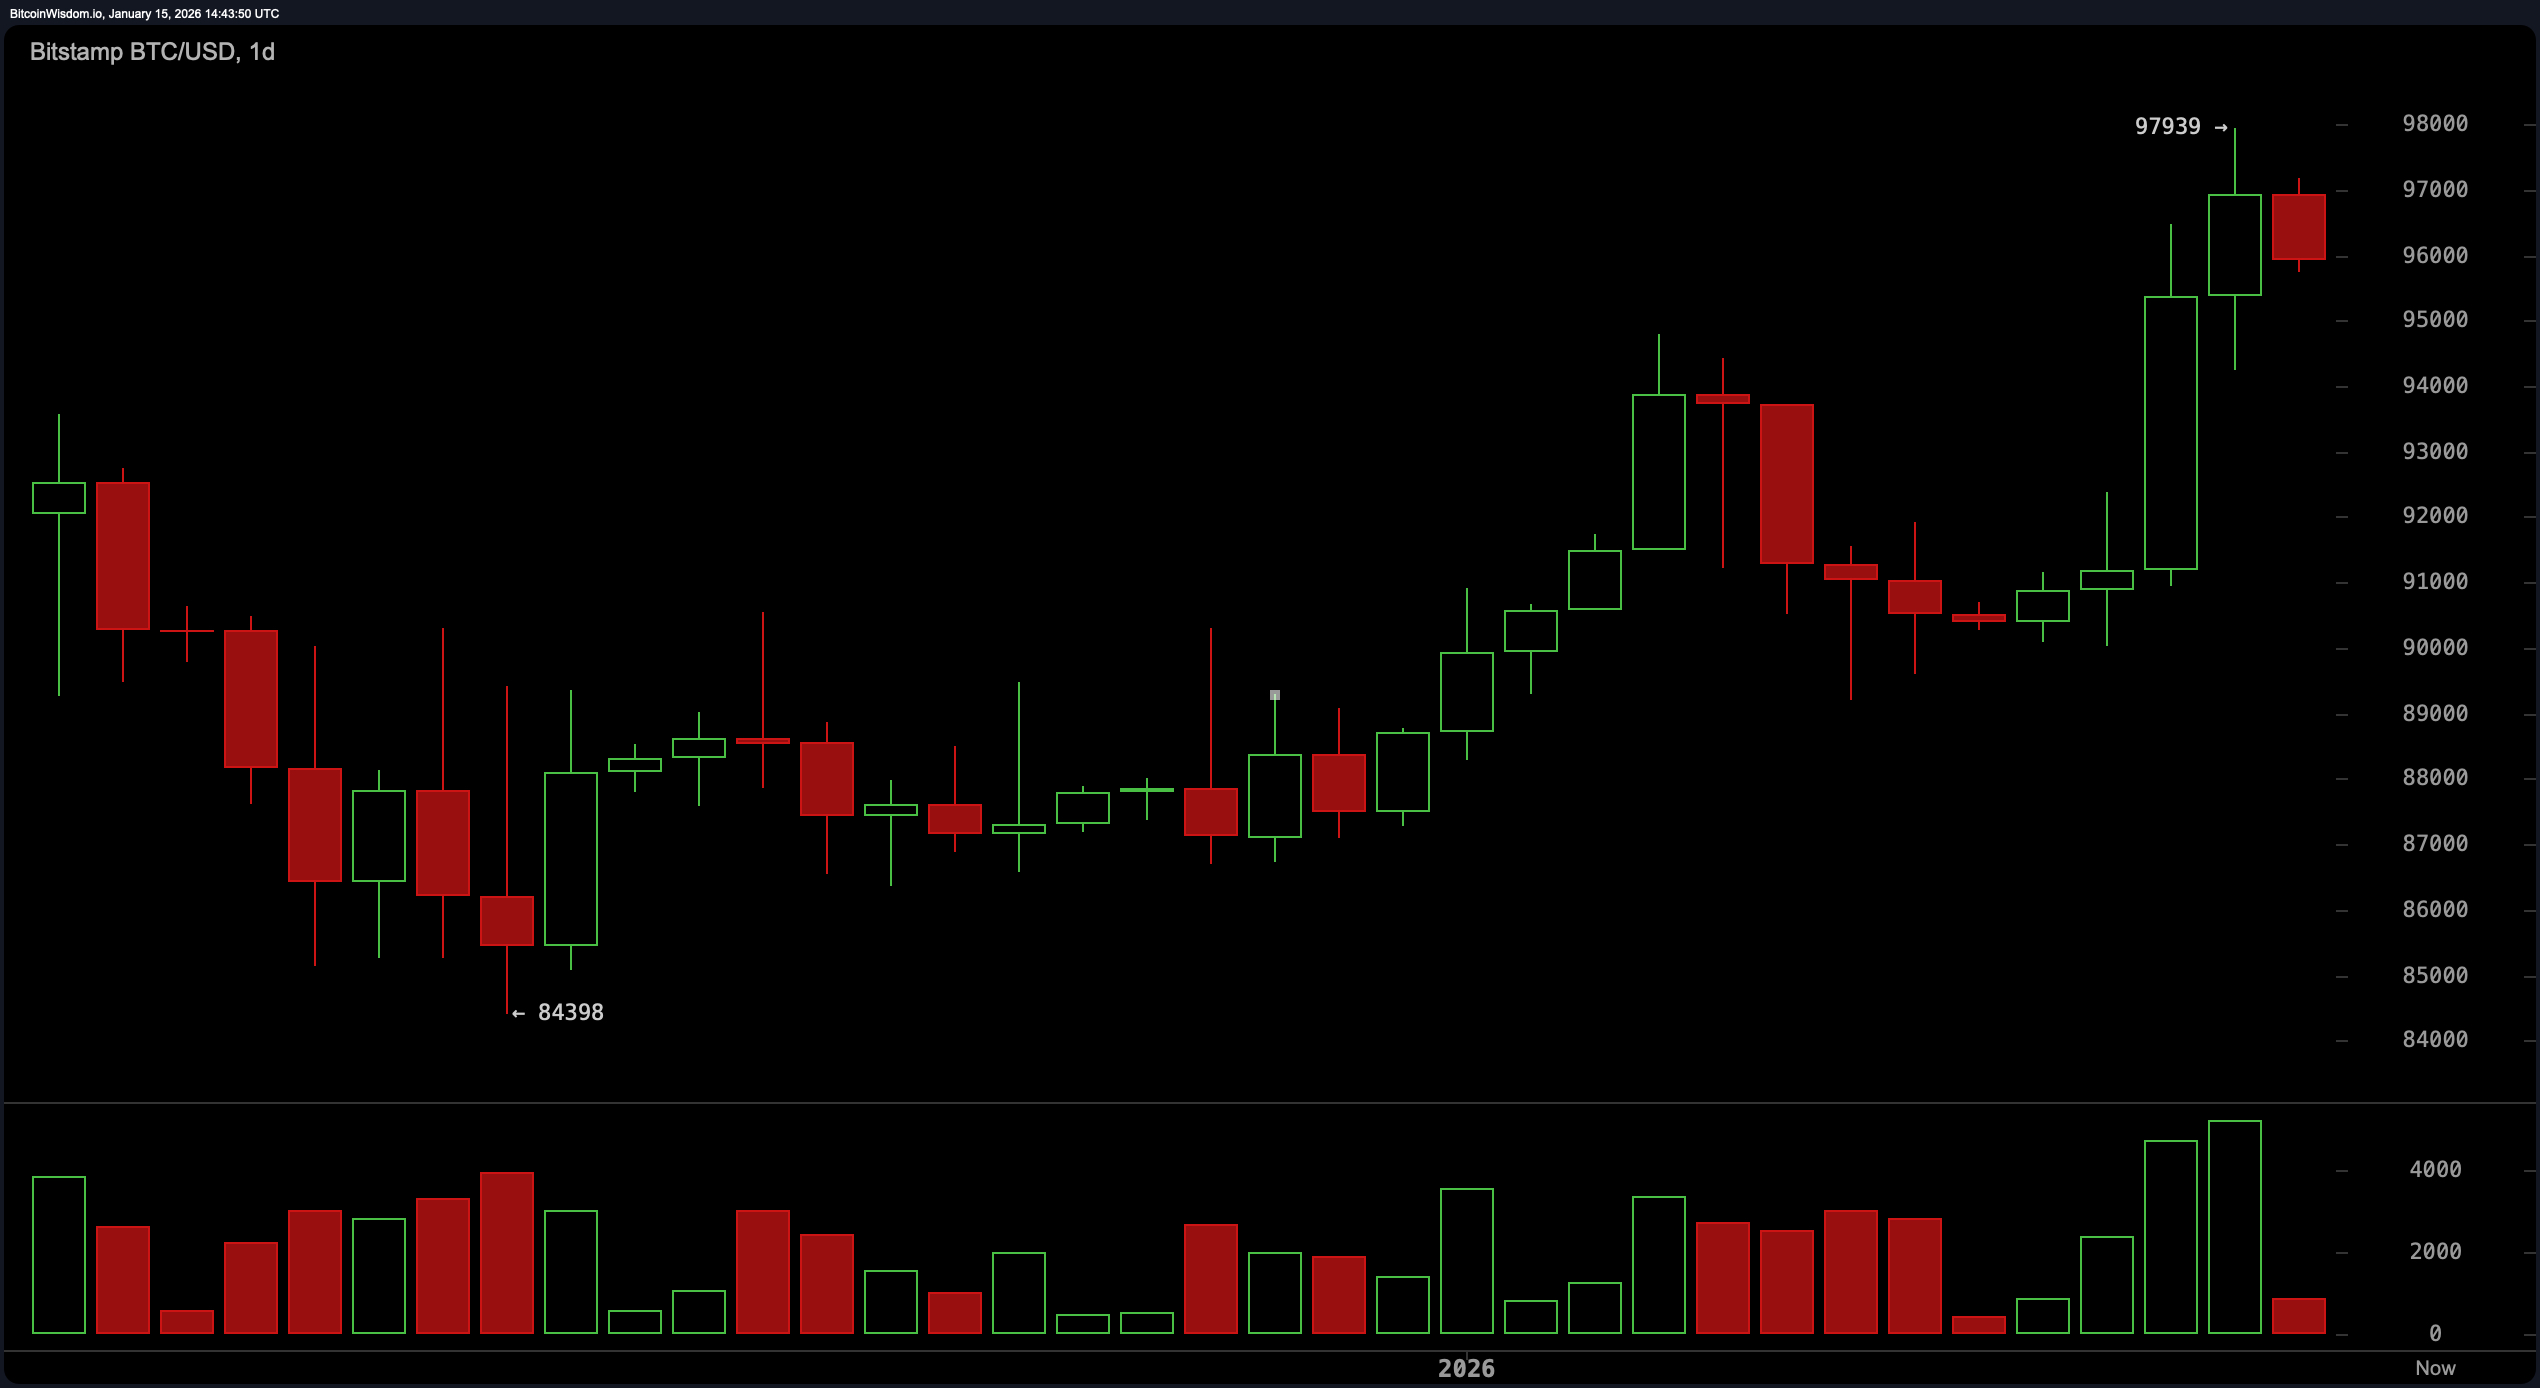
$BTC/USD 1-day chart via Bitstamp on Jan. 15, 2026.
The four-hour chart adds texture to the consolidation narrative. After a strong breakout that began around Jan. 13, price momentum cooled as bitcoin printed lower highs beneath the recent peak. Volume trends show consistent participation during the upswing, followed by a noticeable slowdown as prices stalled. This timeframe highlights the $94,500 to $95,000 area as an important reaction zone where previous demand emerged, while repeated failures to reclaim the $97,900 area suggest the market is reassessing short-term direction rather than reversing trend.
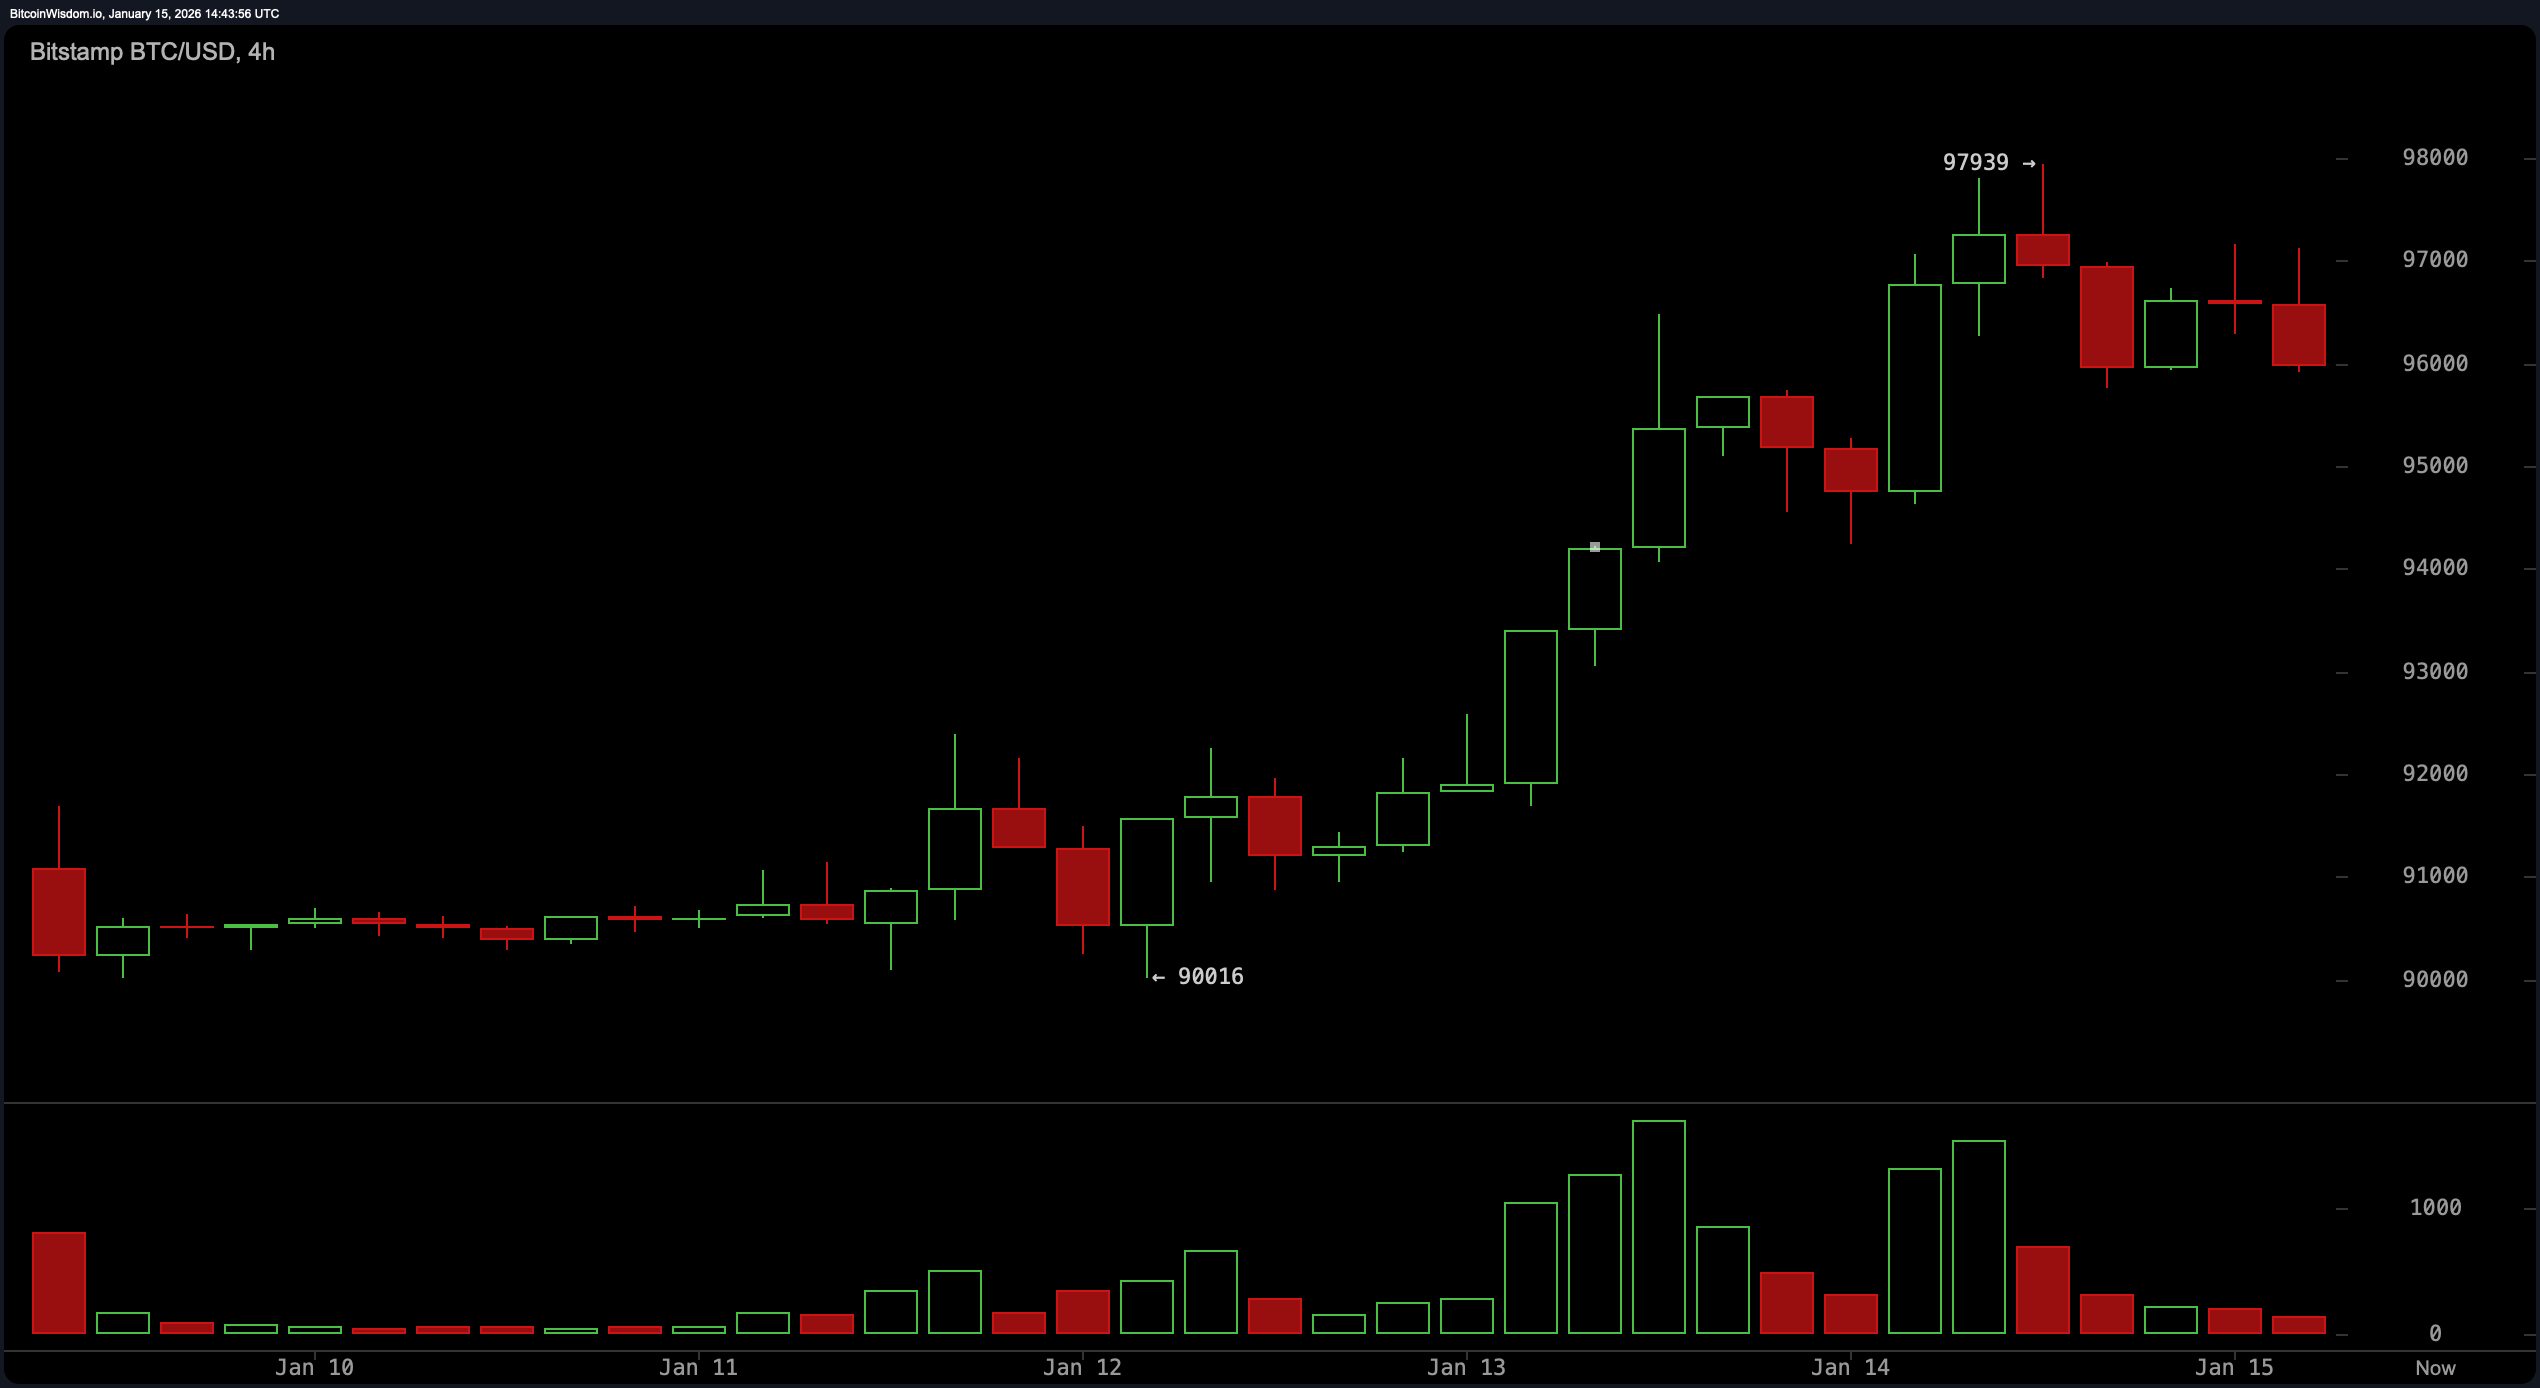
$BTC/USD 4-hour chart via Bitstamp on Jan. 15, 2026.
Short-term signals from the one-hour chart emphasize compression over conviction. Price has moved sideways with declining volume, indicating reduced momentum after the earlier push higher. The structure resembles a consolidation band, with $96,500 acting as a near-term inflection point; weakness below that level would tilt pressure downward within the range. Conversely, renewed strength above $97,200 would signal that short-term participants are re-engaging, though confirmation would require volume to return in force.
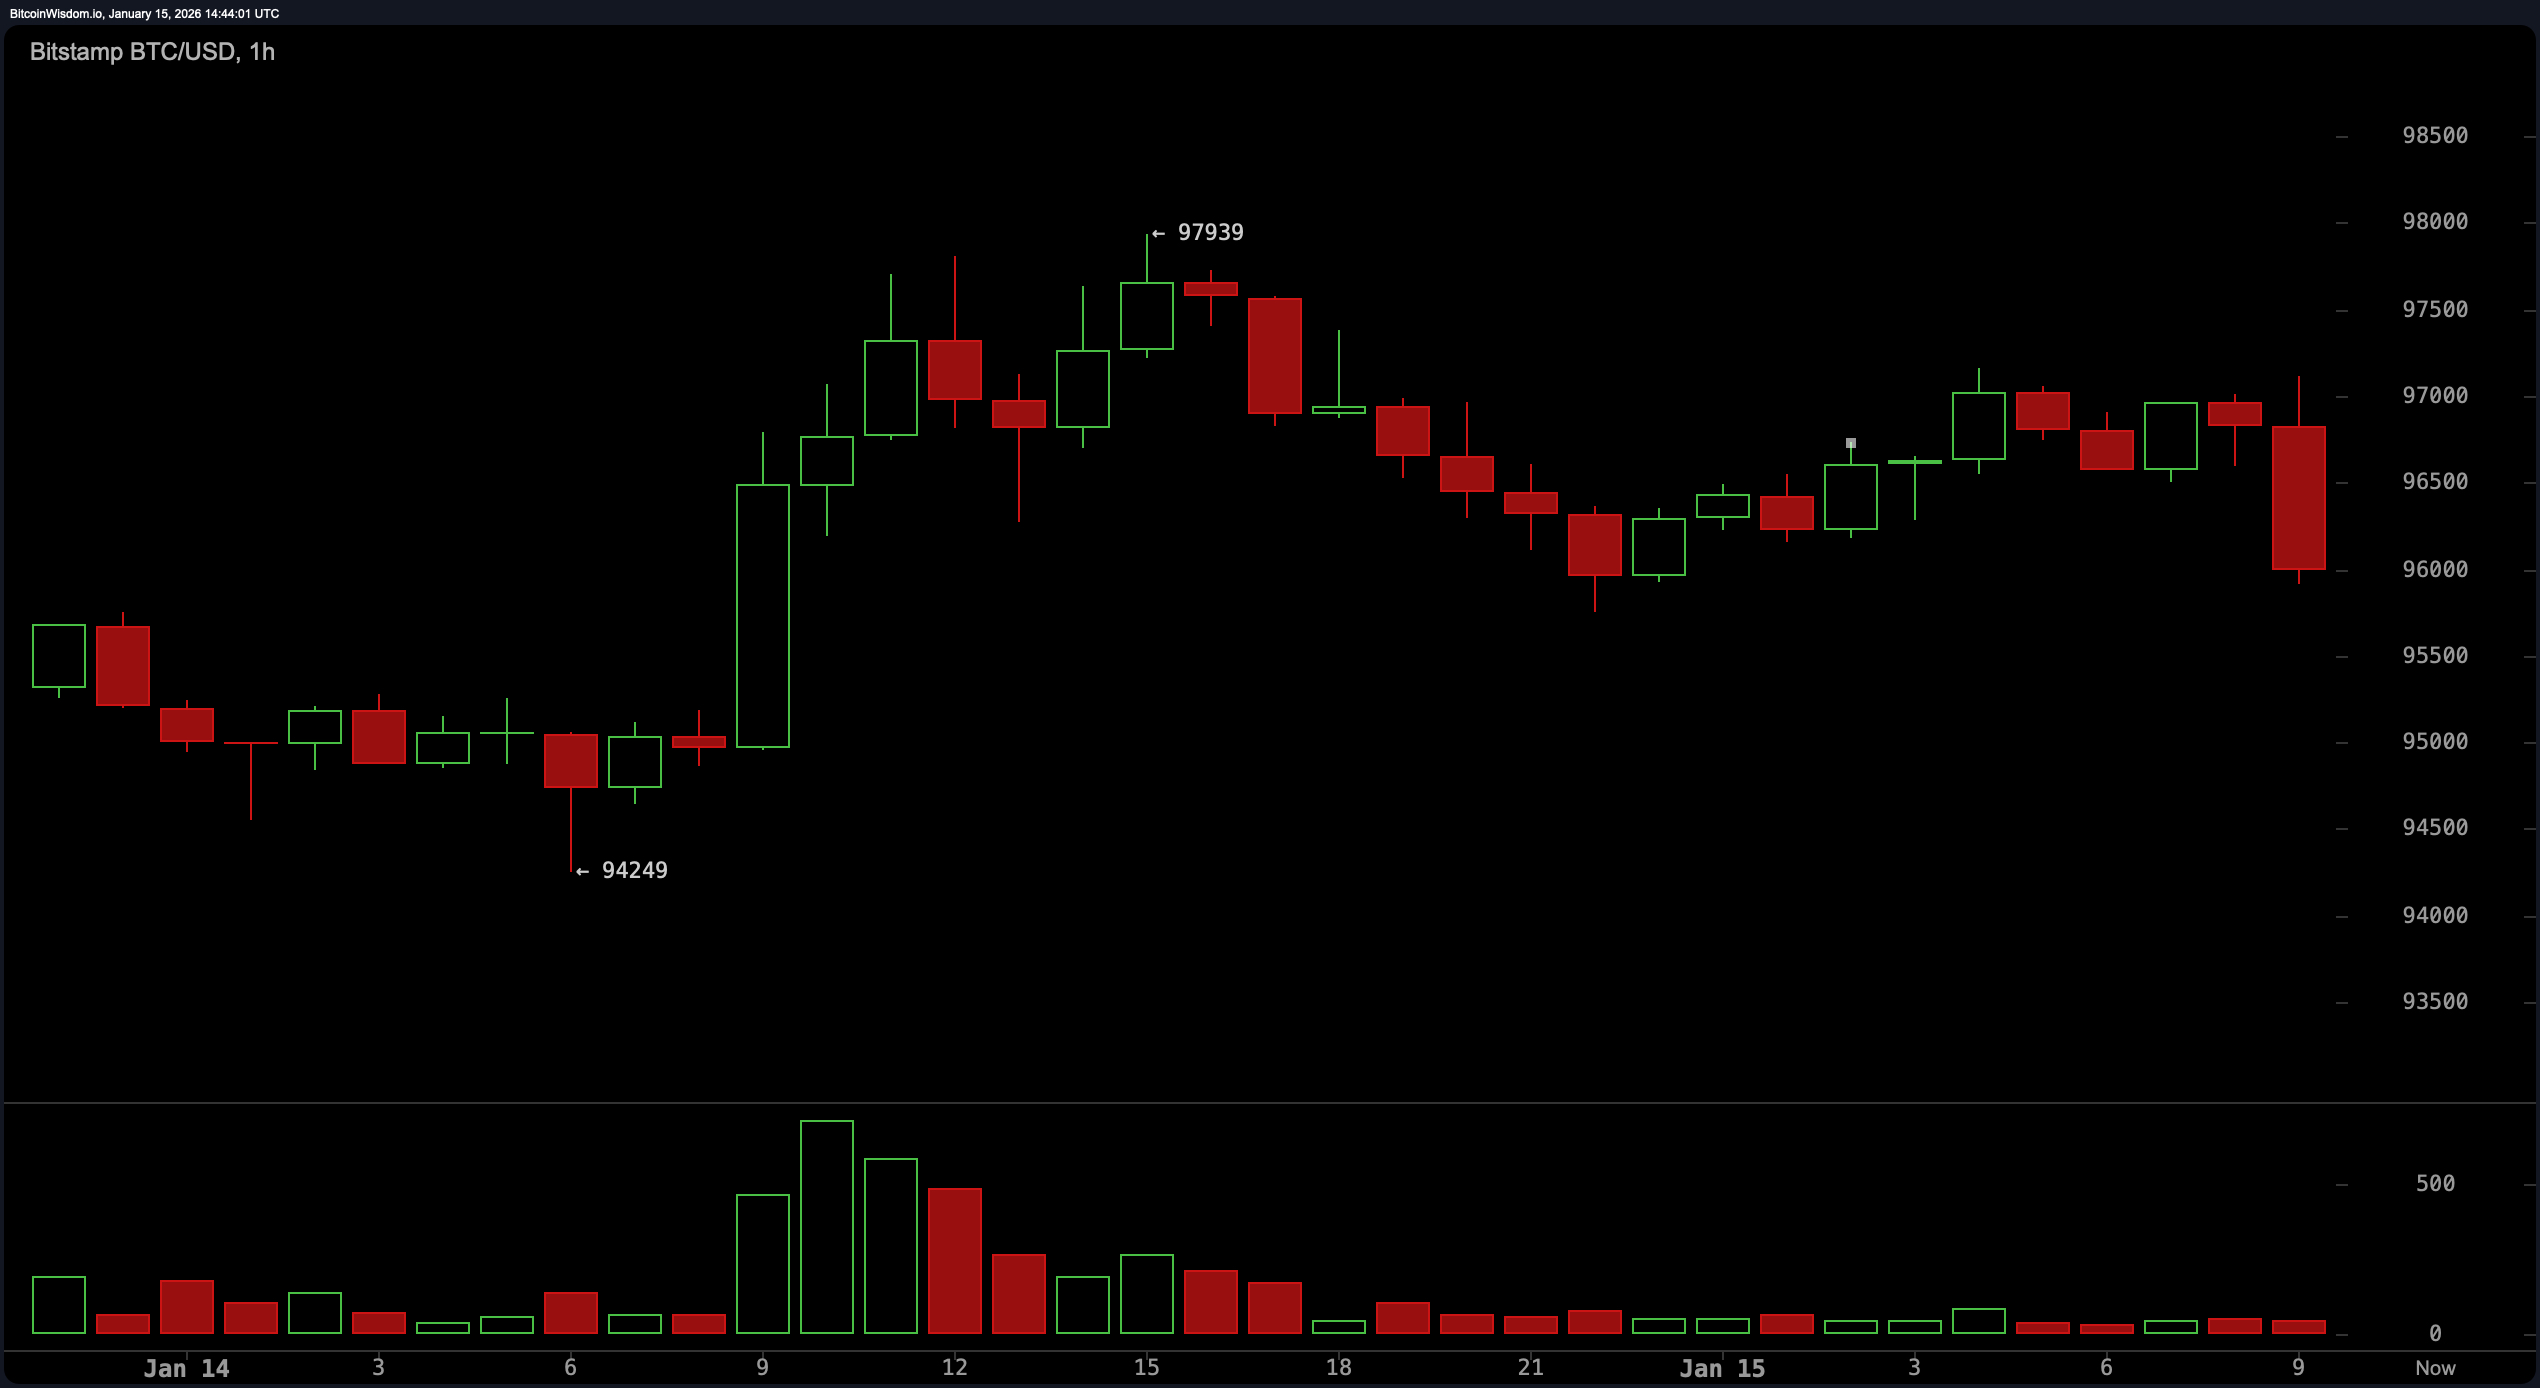
$BTC/USD 1-hour chart via Bitstamp on Jan. 15, 2026.
Oscillators present a mixed but coherent picture. The relative strength index ( RSI) at 69 and the Stochastic at 89 both register neutral readings, reflecting elevated but not extreme conditions. The average directional index (ADX) at 32 confirms trend presence without acceleration, while the Awesome oscillator at 3,966 remains neutral. At the same time, the commodity channel index (CCI) at 182 and momentum (10) at 2,900 signal stretched conditions following the rally, even as the moving average convergence divergence ( MACD) level at 1,476 maintains a positive bias. Together, these readings suggest momentum has slowed but not unraveled.
Moving averages reinforce the broader trend while highlighting overhead friction. Shorter-term measures, including the exponential moving average (EMA) and simple moving average (SMA) from 10 through 50 periods, continue to slope upward and remain supportive beneath the price. The exponential moving average (100) at $96,011 still aligns with the prevailing advance, while the simple moving average (100) at $97,092 sits closer to the current price, acting as near-term resistance. Longer-term pressure is evident at the exponential moving average (200) at $99,563 and the simple moving average (200) at $106,010, reinforcing the idea that bitcoin is consolidating below heavier technical ceilings rather than accelerating unchecked.
Bull Verdict:
Bitcoin’s broader structure remains constructive, with price holding well above key support zones and shorter-term exponential moving averages and simple moving averages continuing to trend upward. Consolidation beneath recent highs suggests digestion rather than deterioration, and momentum indicators, while stretched, have not flipped decisively against the prevailing trend. As long as the price remains supported above the mid-$90,000 range, the technical backdrop favors continuation following this pause.
Bear Verdict:
The failure to decisively clear the recent high near $97,900, combined with cooling volume and stretched oscillator readings, leaves bitcoin vulnerable to a deeper consolidation phase. Longer-term moving averages overhead continue to exert pressure, and a breakdown below short-term support would likely invite increased downside probing toward lower demand zones. In this scenario, the market would be signaling exhaustion rather than mere hesitation.
FAQ ❓
-
What is bitcoin’s price range on Jan. 15, 2026? Bitcoin traded at $96,137 at 9:40 a.m. Eastern time, with a wider intraday span of $94,887 to $97,704.
-
Why is bitcoin consolidating near $97,000? Technical indicators show cooling momentum after a rapid rally, prompting sideways price action near resistance.
-
Which levels matter most for bitcoin right now? Support sits near the mid-$90,000 zone, while resistance remains just below $98,000 and near $100,000.
-
What do indicators suggest for bitcoin’s short-term outlook? Oscillators and moving averages point to consolidation, not a confirmed trend reversal.

 news.bitcoin.com




