
The market rise has not lasted long, and most of the coins are again in the red zone, according to CoinMarketCap.
$BTC/USD
The rate of Bitcoin ($BTC) has declined by 2% over the last 24 hours.
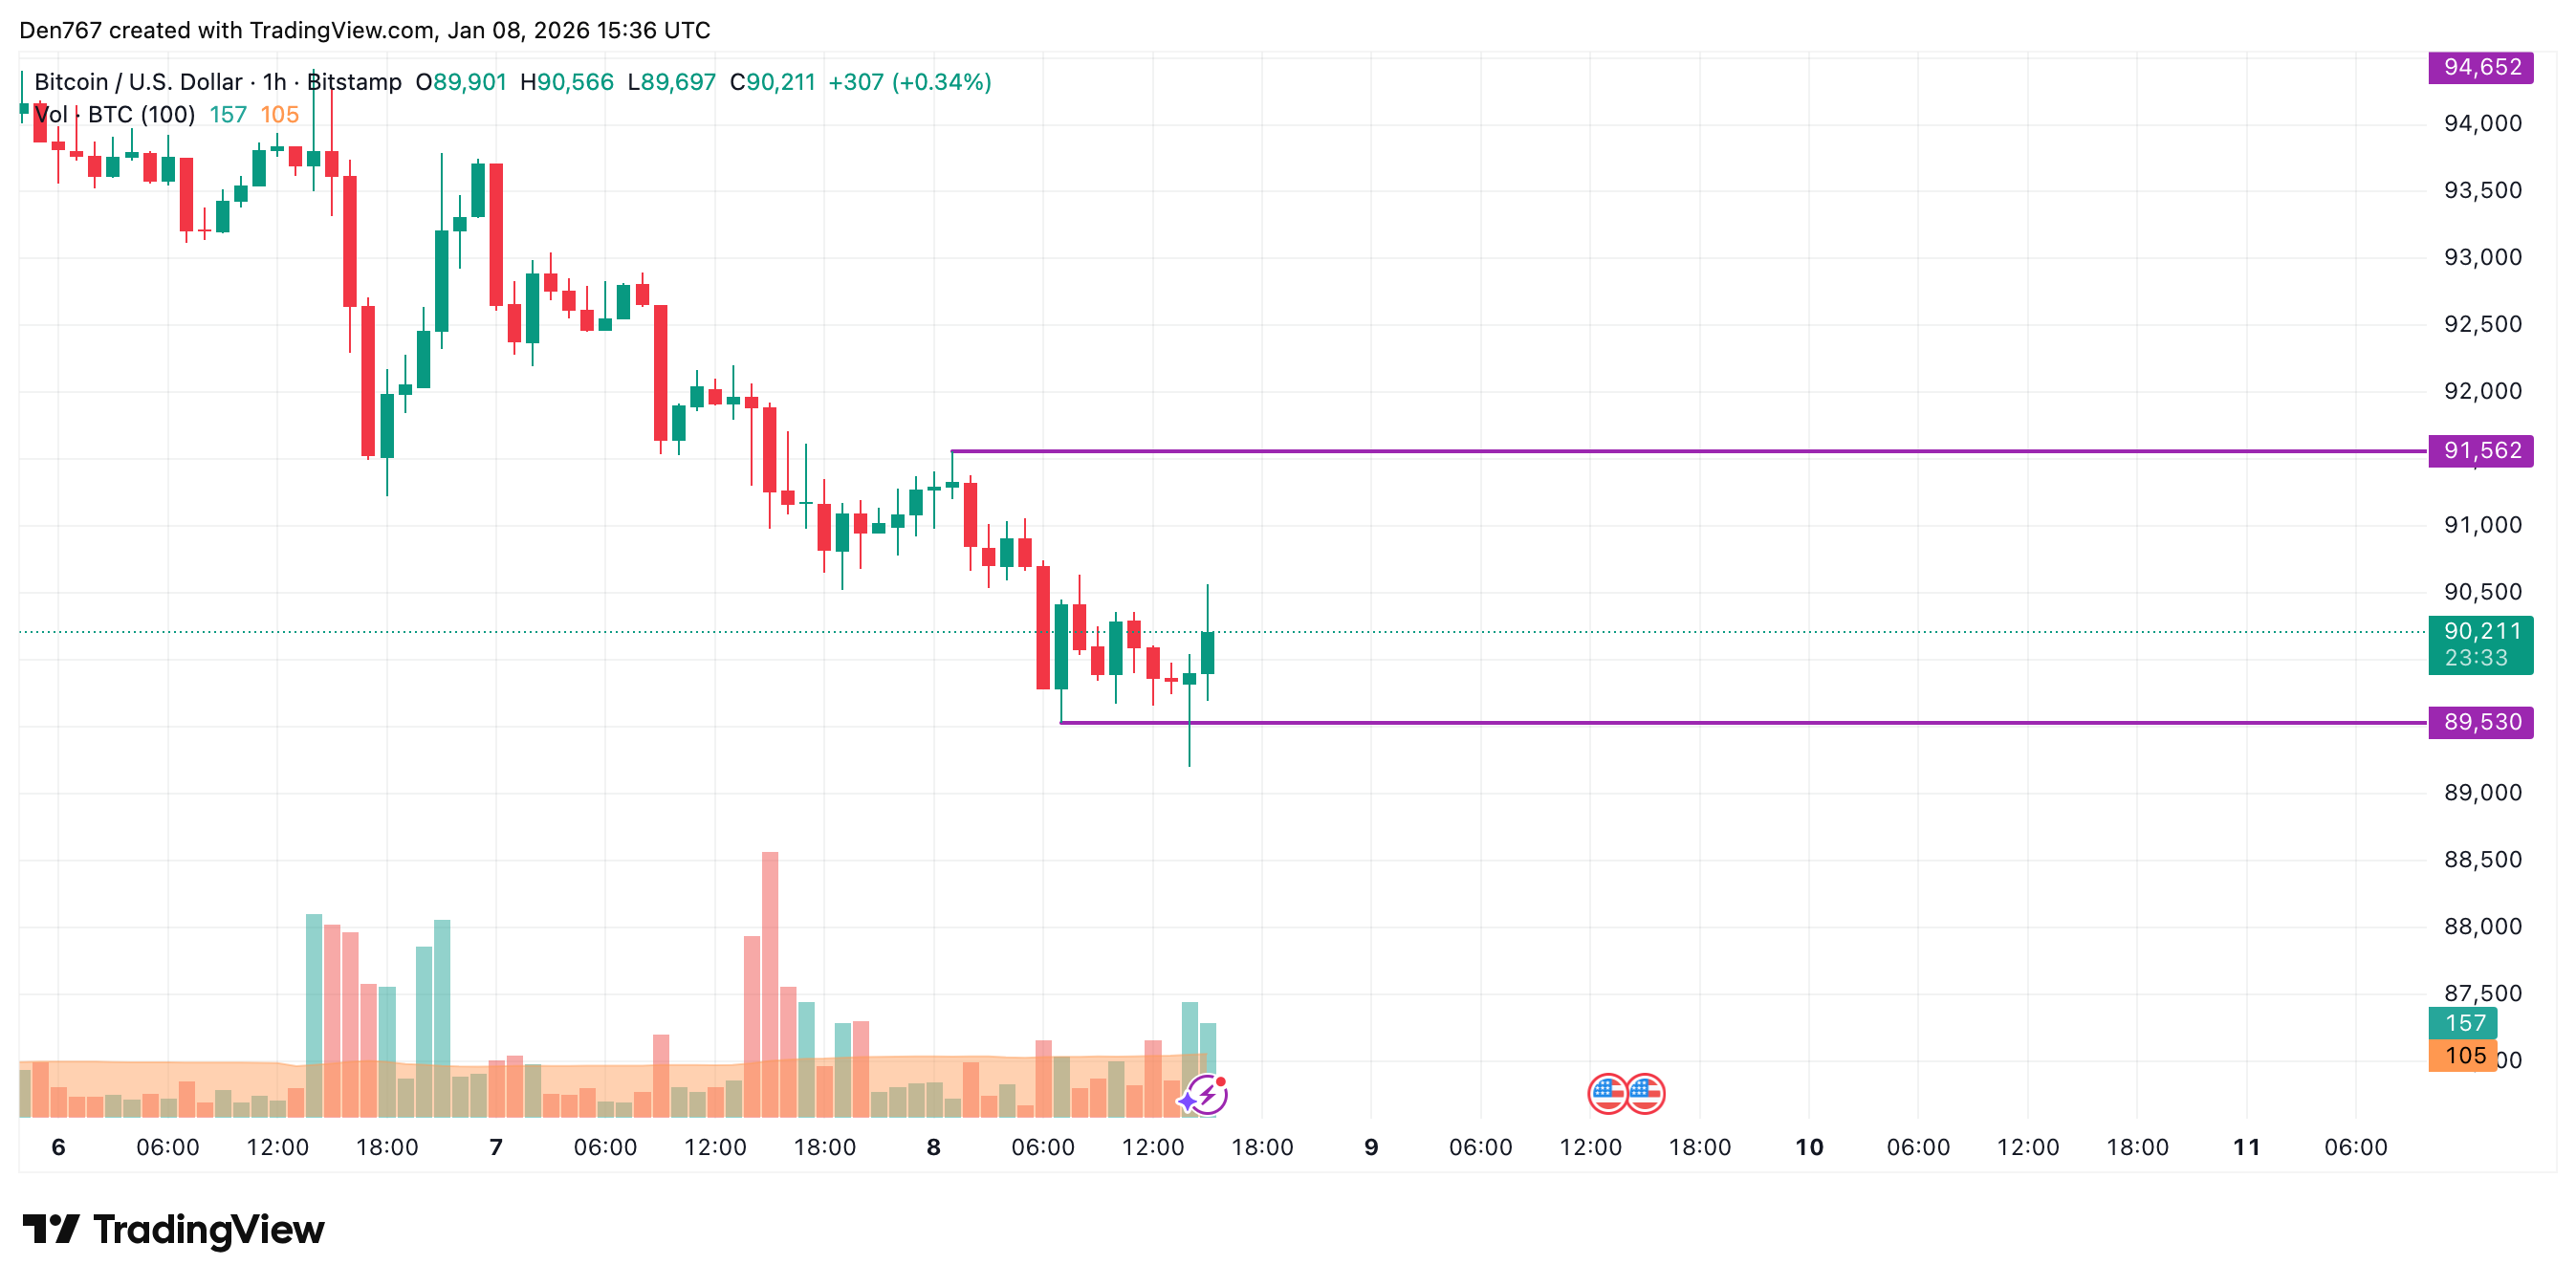
On the hourly chart, the price of $BTC has made a false breakout of the local support at $89,530.
However, if a bounce back does not happen by the end of the day, one can expect an ongoing correction to the $89,000 zone.
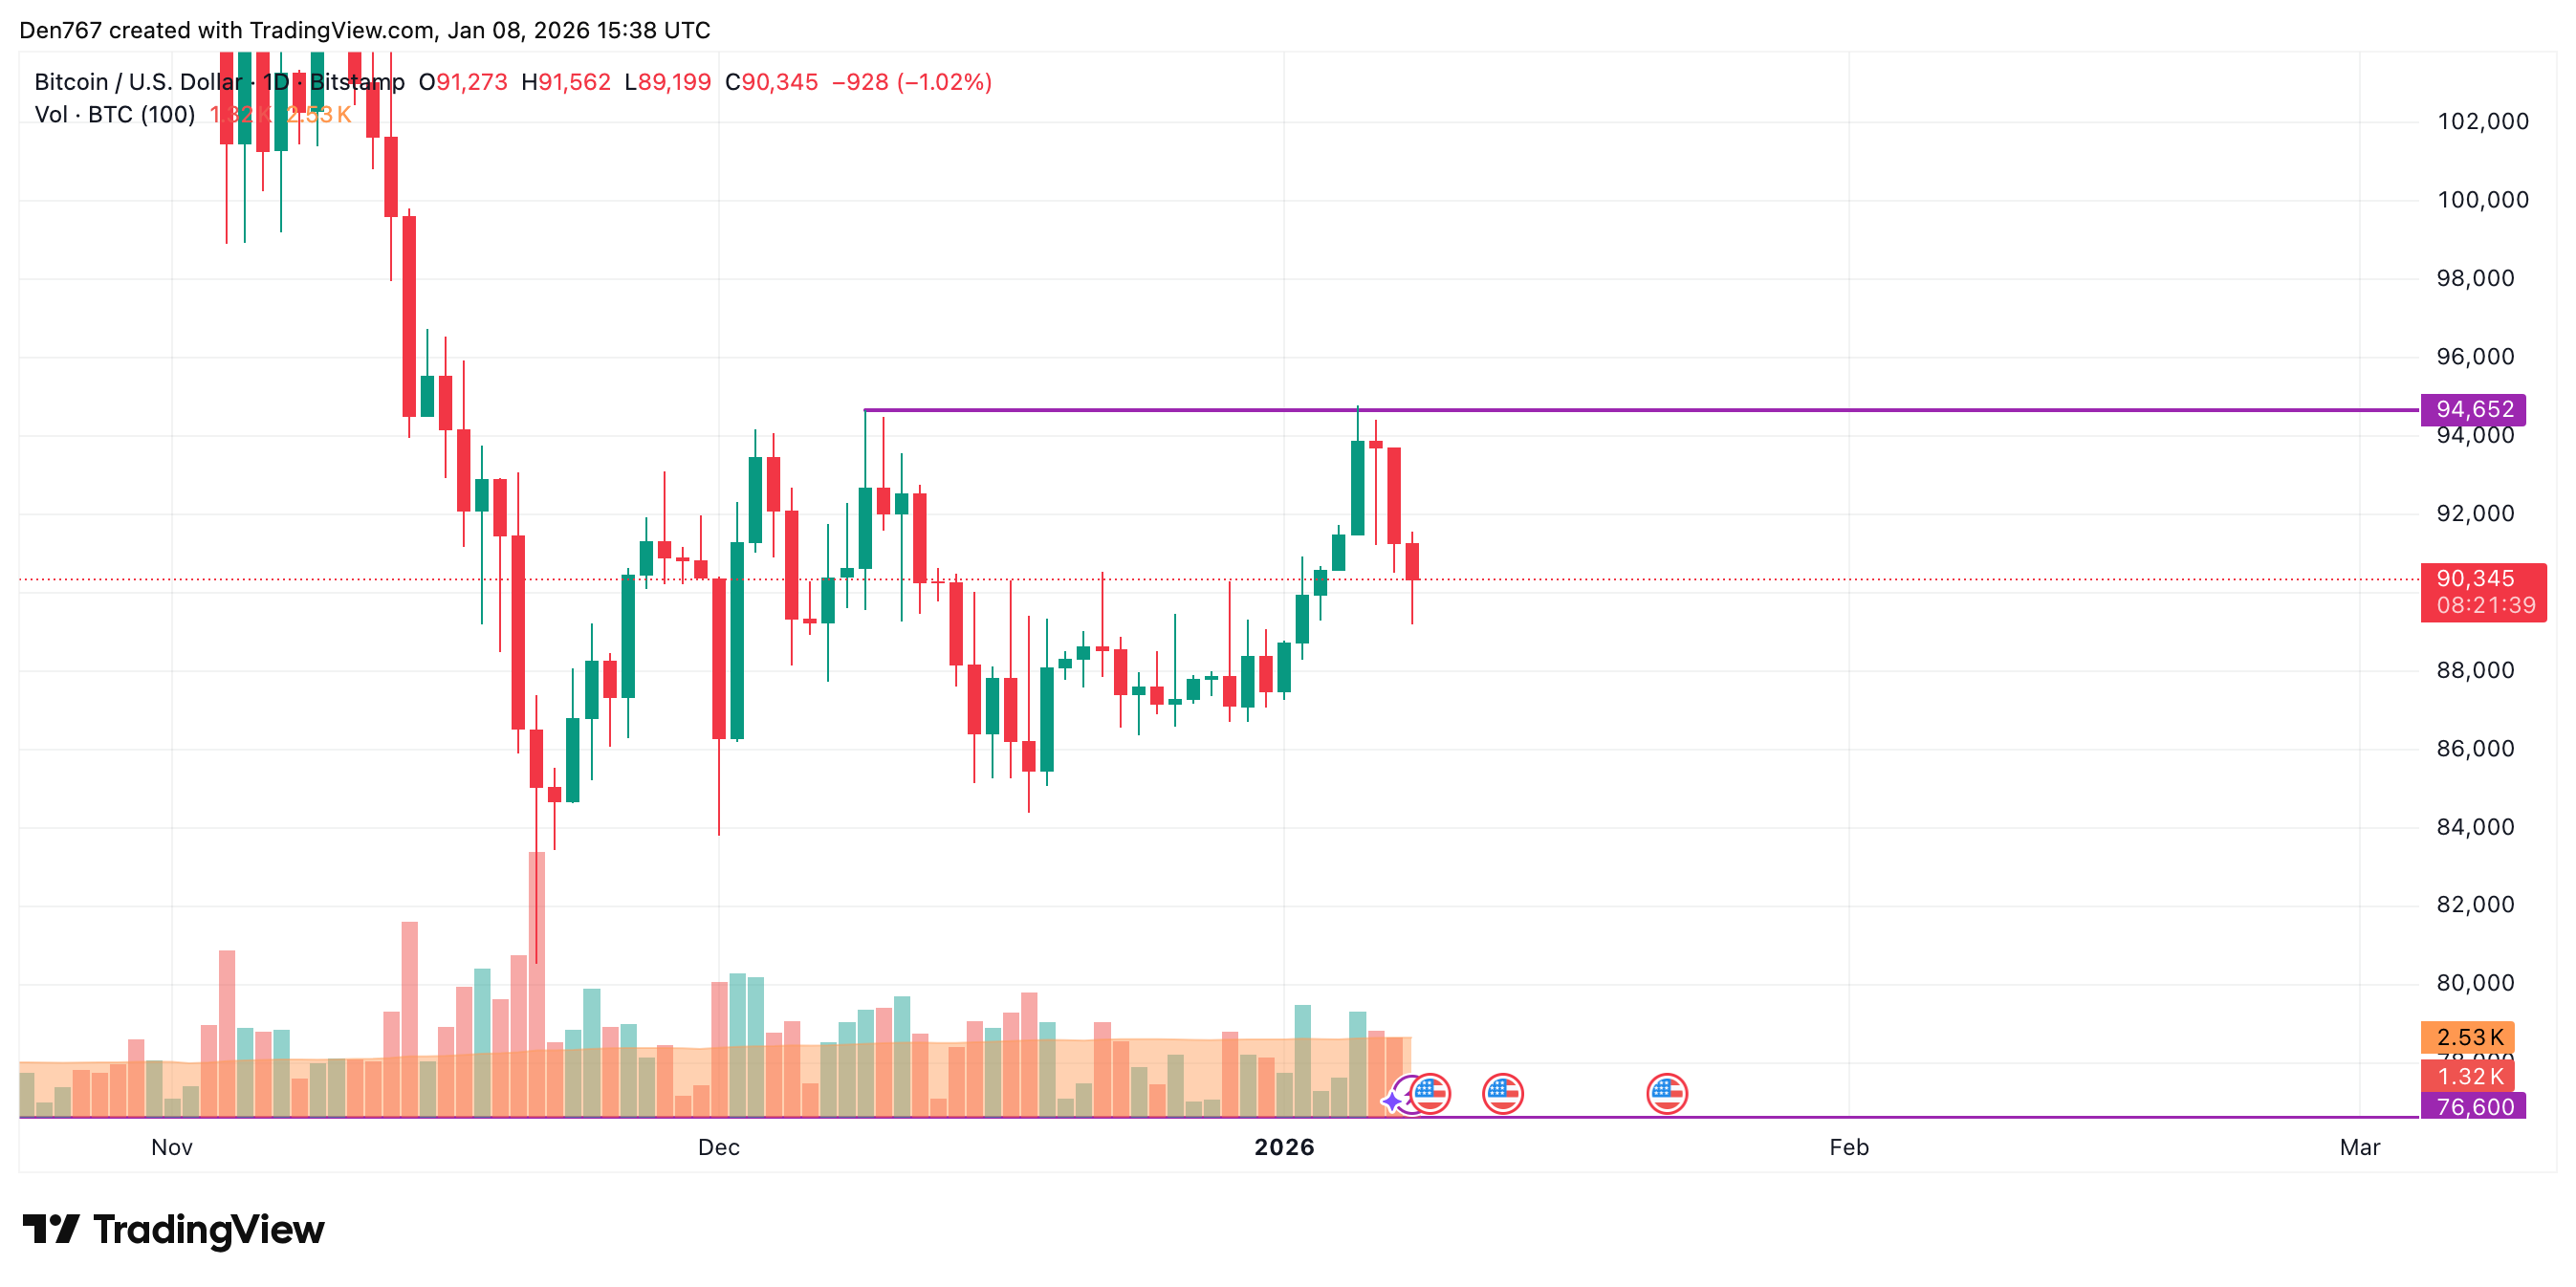
On the longer time frame, the rate of the main crypto is going down after a false breakout of the resistance at $94,652. Until the price is below that mark, bears remain more powerful than bulls, which means that a drop remains the most likely scenario.
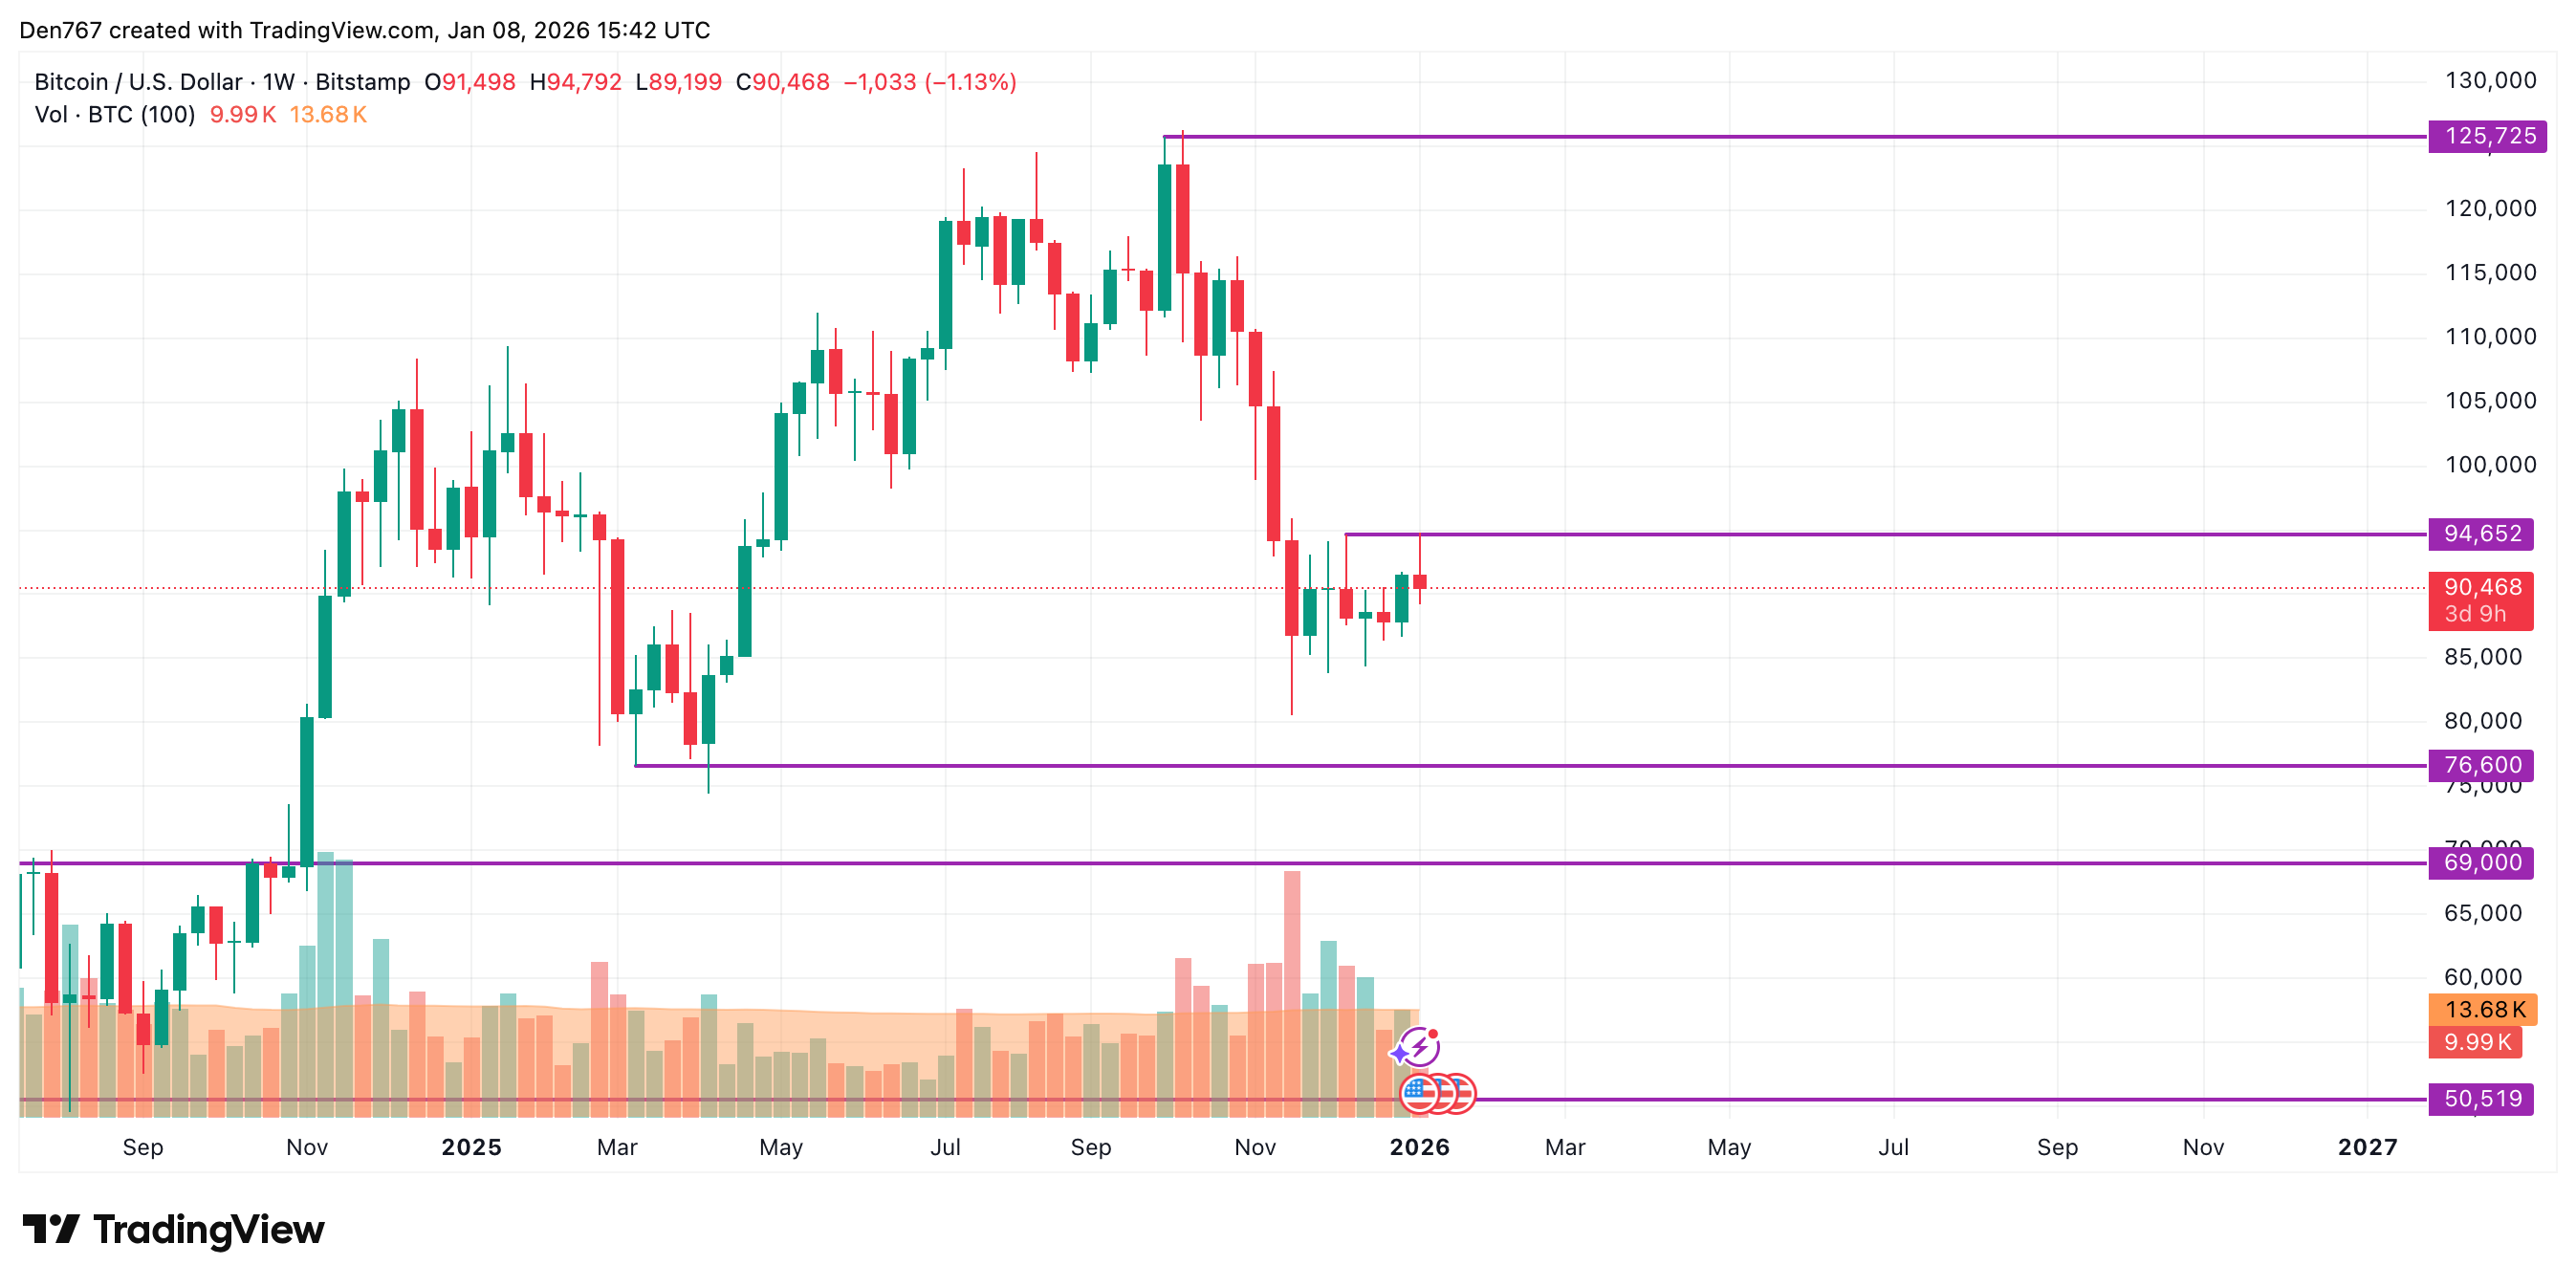
From the midterm point of view, the picture is similar. The price of $BTC has bounced off the resistance at $94,652. If the weekly bar closes far from that mark, traders may witness a test of the $80,000-$85,000 range shortly.
Bitcoin is trading at $90,468 at press time.