
Bitcoin is testing key levels within the Ichimoku Cloud, and whether it can hold above this zone will determine its next major price direction.
Bitcoin’s strong start to 2026 saw it quickly recover from December 2025’s losses, reclaiming the $90,000 mark early in January. Despite external pressures, including geopolitical tensions like the U.S. targeting Venezuela, Bitcoin held above this critical level over the weekend.
The bullish sentiment carried into the business week, with Bitcoin surging above $94,000 by Monday evening. The momentum continued on Tuesday, briefly pushing the crypto to a multi-week high just below $95,000.
However, the recent dip of 2.8% in the past 24 hours suggests some resistance as Bitcoin consolidates around the $90,000 to $92,500 range. Despite this short-term pullback, Bitcoin has remained resilient, and its medium term upward trend is intact. Where’s BTC headed?
Bitcoin Price Analysis
Bitcoin’s current price action on the daily chart shows it trading within the Ichimoku Cloud, which provides key insights into potential future price movements. The price is hovering around the $90,000 mark, facing immediate resistance at the upper cloud boundary near $93,997.
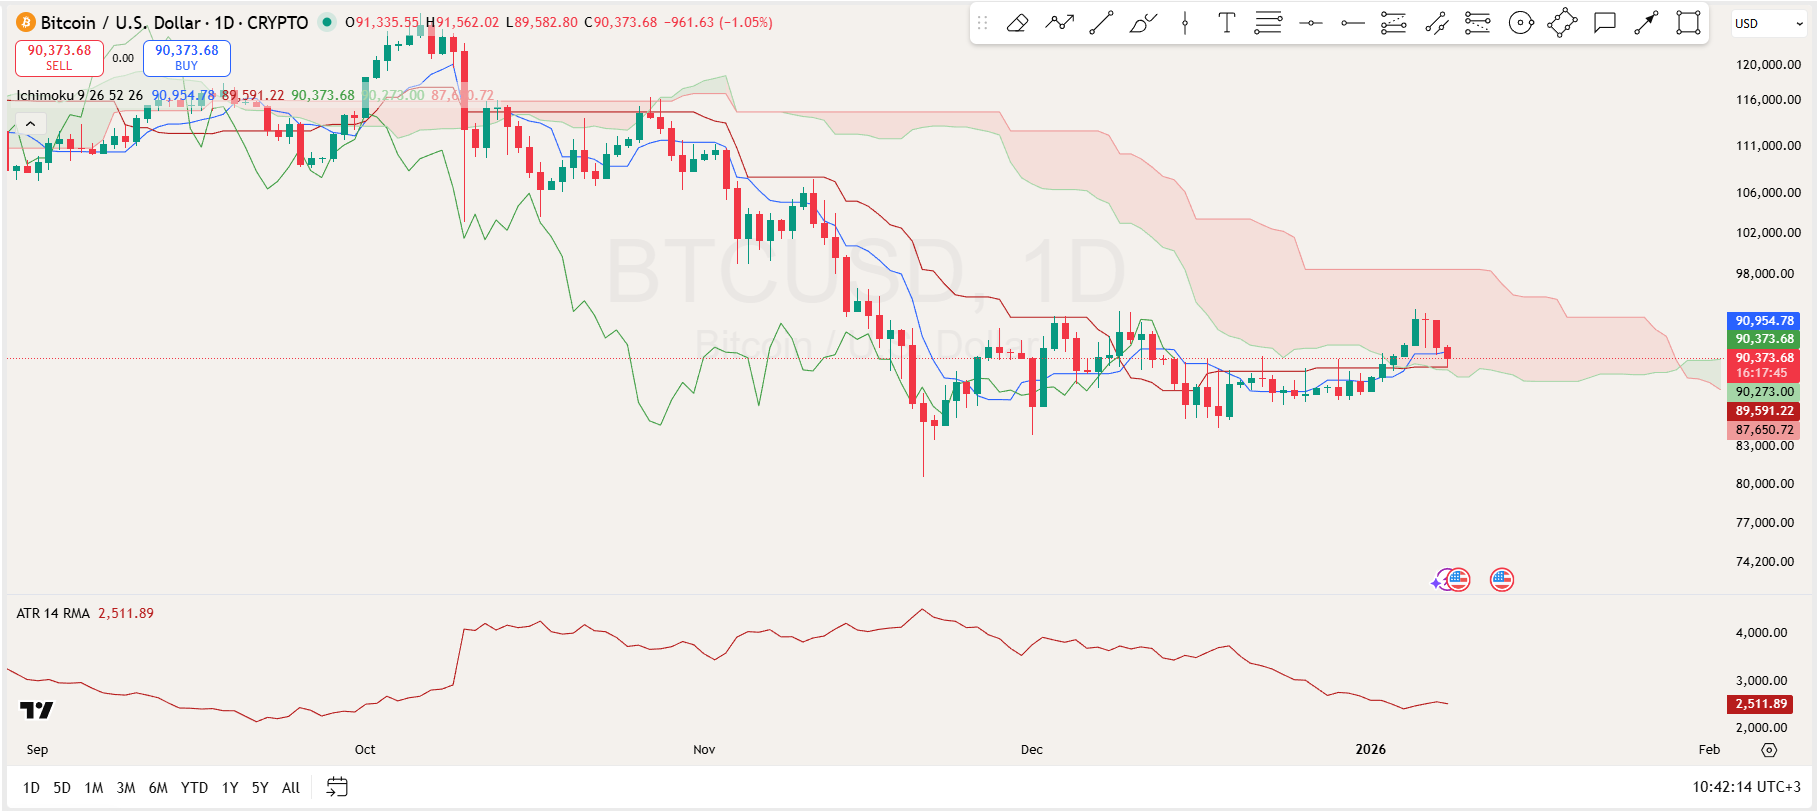
If Bitcoin manages to break above this resistance, it could potentially target higher levels, such as the $94,000 to $95,000 range. On the other hand, support rests near $88,300, where the lower cloud boundary provides additional cushion. A breakdown below this support could lead to further declines, potentially revisiting the $87,650 level.
Meanwhile, the Average True Range (ATR) indicator on the chart is currently at 2,511.89, which measures the volatility of Bitcoin. A higher ATR value indicates increased volatility, suggesting that the market could experience larger price swings in either direction. In the context of the current chart, the ATR is falling gradually, which may suggest a period of decreasing volatility.
Bitcoin Liquidation Data
Moreover, the Bitcoin liquidation data from CoinGlass shows significant market activity, indicating heightened volatility and potential risk for traders. Over the past 24 hours, a total of $145 million worth of liquidations have occurred, with the majority of this coming from long positions ($134.48 million).
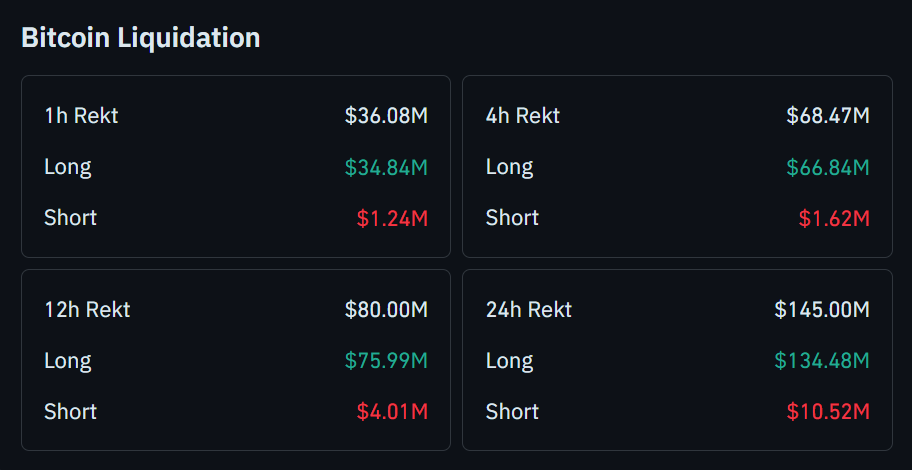
Looking at shorter timeframes, the liquidation data shows that the 12-hour and 4-hour periods also saw substantial liquidation volumes, with $80 million and $68.47 million liquidated, respectively. Long positions dominated these liquidations, with $75.99 million and $66.84 million in long positions being wiped out.
The relatively small amount of short liquidations across all timeframes, particularly in the 1-hour ($1.24 million) and 4-hour ($1.62 million) periods, suggest that short sellers have not been under as much pressure.